
White Biotech Market
White Biotech Market Forecasts to 2028 - Global Analysis By Product (Biopolymers, Biofuels and Other Products), End User (Electronics and Semiconductor, Consumer Goods And Services and Other End Users) and By Geography

|
Years Covered |
2020-2028 |
|
Estimated Year Value (2022) |
US $205.38 BN |
|
Projected Year Value (2028) |
US $432.15 BN |
|
CAGR (2022 - 2028) |
13.2% |
|
Regions Covered |
North America, Europe, Asia Pacific, South America, and Middle East & Africa |
|
Countries Covered |
US, Canada, Mexico, Germany, UK, Italy, France, Spain, Japan, China, India, Australia, New Zealand, South Korea, Rest of Asia Pacific, South America, Argentina, Brazil, Chile, Middle East & Africa, Saudi Arabia, UAE, Qatar, and South Africa |
|
Largest Market |
Asia Pacific |
|
Highest Growing Market |
North America |
According to Stratistics MRC, the Global White Biotech Market is accounted for $205.38 billion in 2022 and is expected to reach $432.15 billion by 2028 growing at a CAGR of 13.2% during the forecast period. The use of scientific and technical ideas forms the foundation of biotechnology. Industrial biotechnology is another name for white biotechnology. In order to produce bio-based products that may be used in a variety of industries, including chemicals, bio-energy, home care, food and feed, and pharmaceuticals, this method makes use of enzymes and microorganisms. The advantages of white biotech products in everyday life and the negative consequences of greenhouse gas emissions from non-biological products are not commonly known to end users in emerging and impoverished nations.
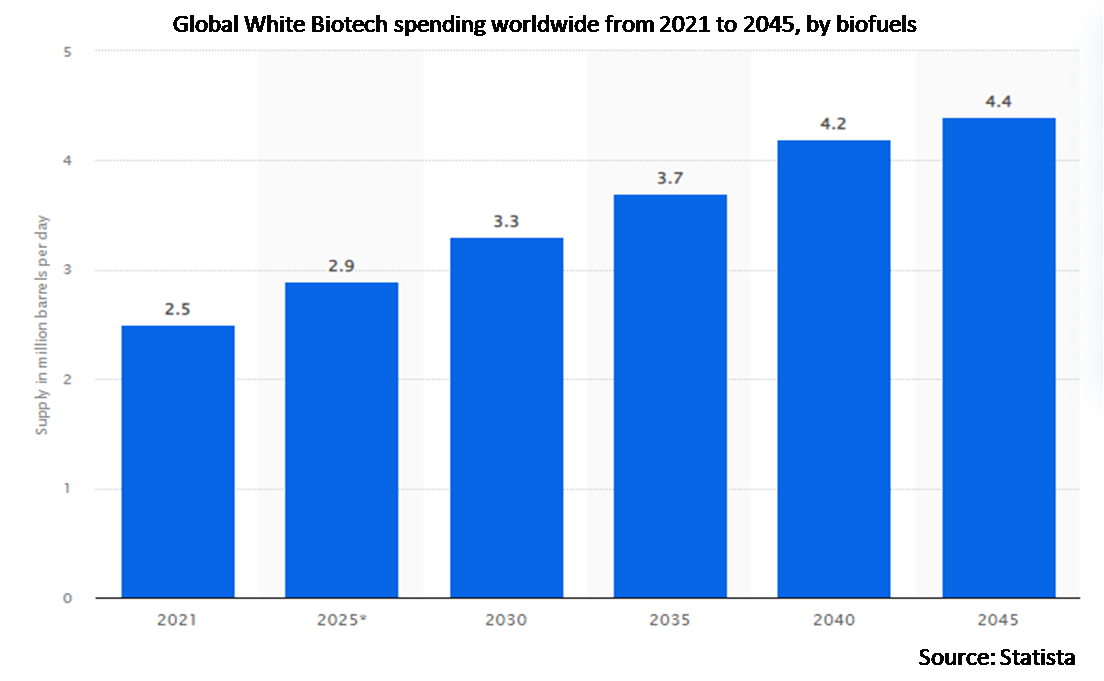
According to a report shared by the International Energy Agency (IEA), a France-based autonomous intergovernmental organization, by 2022, 45 billion liters of biodiesel will be produced worldwide, up from 37 billion in 2020.
Market Dynamics:
Driver:
Wide market application with different functionality
White biotechnology has seen a growth in demand from end users over the past few years as a result of a growing understanding of its uses and numerous benefits, which include eco-friendliness, reduced manufacturing costs, little waste formation, and maximum raw material utilisation. Consumer demand for green chemicals, especially in developed nations, is forcing manufacturers to adopt white biotechnology rather than conventional chemical production processes. Furthermore, the development of polymer production technology, notably from biomass, has created profitable opportunities in the biochemical market over the past few years.
Restraint:
Declining fertility of agricultural lands could hold back development
The production status of bio crops may soon be lost due to factors such as the growing population, the scarcity of agricultural land, small landholdings, and declining soil fertility. The fertility of agricultural areas also decreased due to the misuse and incorrect application of fertilisers to crops, which has led to the depletion of that fertility. Because there is uncertainty over the production yield, which is expected to restrict market expansion, the prices of bio-crops have also fluctuated due to excessive fertiliser use. The current degree of nutrient-use efficiency is still quite low for the majority of nutrients. As a result, falling land fertility is limiting the production of bio crops, which could restrict the market's growth throughout the projection period.
Opportunity:
Demand for bio plastic is surging
Global demand for bio-based and biodegradable polymers reached 960,000 metric tonnes. The bioplastics industry, though still in its infancy, has established itself as a cornerstone in a number of commercial industries and applications. Due to consumer preferences for eco-friendly materials, a growth in the usage of bioplastics by plastic processors and compounders, and the launch of new products that expand the benefits of bioplastics, demand is anticipated to rise significantly in almost all geographic areas.
Threat:
Lower adoption of biofertilizers
The global white biotechnology market is anticipated to experience slower growth due to lower adoption of biofertilizers compared to traditional fertilisers in both developed and emerging economies. Increased desire for conventional fertilisers is a result of declining soil fertility and growing food demand. Additionally, it is anticipated that lesser adoption of biofuels relative to conventional fuels will also restrain market expansion. This is caused by the variable supply of biofuels and the superior performance of conventional fuels over biofuels.
Covid-19 Impact
The COVID-19 pandemic had a huge impact on the pharmaceutical industry's innovation in the white biotechnology market, which suggests a successful market expansion in the sector. The growing consumer demand for green chemicals, particularly in developed regions like North America and Europe, is expected to drive manufacturers to use white biotechnology processes rather than conventional chemical manufacturing. Over the projection period, it is anticipated that the demand for technology would increase due to the growing pressure on various consumer industries, such as the automotive and consumer goods sectors, to fulfil the sustainability targets.
The biochemicals segment is expected to be the largest during the forecast period
The biochemicals segment is estimated to have a lucrative growth, as a result of stricter laws, environmental concerns, and customer demand for more sustainable products. As a result, producers of cleaning products including those for the home have been decreasing their carbon footprints for years by lowering suggested product temperatures, reducing packaging, and increasing the number of bio-based components.
The healthcare segment is expected to have the highest CAGR during the forecast period
The healthcare segment is anticipated to witness the fastest CAGR growth during the forecast period, due to increasing technological use in the production of biopharmaceuticals, particularly antibodies for cancer treatment that cannot be produced through chemical synthesis. Additionally, the creation of chiral molecules and other challenging-to-synthesize intermediates, including active pharmaceutical ingredients (API), is made possible by the enzymes used in this method.
Region with highest share:
Asia Pacific is projected to hold the largest market share during the forecast period owing to the availability of biotechnologically altered food ingredients. In this approach, players contribute money to nearby companies. Additionally, product contamination results in variable potency and poor product quality, which restrict the growth of the Chinese biotech and pharmaceutical industry.
Region with highest CAGR:
North America is projected to have the highest CAGR over the forecast period. Food demand is rising due to an increase in both human and livestock populations. As urban areas are encroaching on agricultural grounds, it puts pressure on how land is used. These international trends provide biotechnology with the opportunity to boost agricultural production.

Key players in the market
Some of the key players profiled in the White Biotech Market include Global Bioenergies, Solazyme, Borregaard, BioAmber., Fermentalg, Amyris, Codexis, Deinove, Novozymes, Metabolic Explorer, Evolva, Gevo, Kerry Group plc and BASF SE.
Key Developments:
In March 2022, Kerry Group plc (Kerry), an Ireland-based public food company, acquired 92% of the issued share capital of c-Lecta for $134.8 million (€ 137M). With this acquisition, Kerry's innovative capabilities in enzyme engineering, fermentation, and bioprocess development will be accelerated.
In March 2021, BASF Venture Capital (BVC) invested in Bota Biosciences Ltd (Bota Bio), an industrial synthetic biotech company located in Hangzhou, China, which develops next-generation biotechnology platforms, enabling sustainable and economical production of high-value products for a broad array of industrial applications, like sweeteners, vitamins, personal care, or crop protection products.
Products Covered:
• Biopolymers
• Biofuels
• Biochemicals
• Industrial Enzymes
• Other Products
End Users Covered:
• Electronics and Semiconductor
• Consumer Goods And Services
• Healthcare
• Agriculture
• Hospitality & Tourism
• Automotive
• Automation and Process Control
• Aerospace And Defense
• Food and Beverage
• Chemicals & Materials
• Energy and Resources
• Information Technology
• Other End Users
Regions Covered:
• North America
o US
o Canada
o Mexico
• Europe
o Germany
o UK
o Italy
o France
o Spain
o Rest of Europe
• Asia Pacific
o Japan
o China
o India
o Australia
o New Zealand
o South Korea
o Rest of Asia Pacific
• South America
o Argentina
o Brazil
o Chile
o Rest of South America
• Middle East & Africa
o Saudi Arabia
o UAE
o Qatar
o South Africa
o Rest of Middle East & Africa
What our report offers:
- Market share assessments for the regional and country-level segments
- Strategic recommendations for the new entrants
- Covers Market data for the years 2020, 2021, 2022, 2025, and 2028
- Market Trends (Drivers, Constraints, Opportunities, Threats, Challenges, Investment Opportunities, and recommendations)
- Strategic recommendations in key business segments based on the market estimations
- Competitive landscaping mapping the key common trends
- Company profiling with detailed strategies, financials, and recent developments
- Supply chain trends mapping the latest technological advancements
Free Customization Offerings:
All the customers of this report will be entitled to receive one of the following free customization options:
• Company Profiling
o Comprehensive profiling of additional market players (up to 3)
o SWOT Analysis of key players (up to 3)
• Regional Segmentation
o Market estimations, Forecasts and CAGR of any prominent country as per the client's interest (Note: Depends on feasibility check)
• Competitive Benchmarking
o Benchmarking of key players based on product portfolio, geographical presence, and strategic alliances
Table of Contents
1 Executive Summary
2 Preface
2.1 Abstract
2.2 Stake Holders
2.3 Research Scope
2.4 Research Methodology
2.4.1 Data Mining
2.4.2 Data Analysis
2.4.3 Data Validation
2.4.4 Research Approach
2.5 Research Sources
2.5.1 Primary Research Sources
2.5.2 Secondary Research Sources
2.5.3 Assumptions
3 Market Trend Analysis
3.1 Introduction
3.2 Drivers
3.3 Restraints
3.4 Opportunities
3.5 Threats
3.6 Product Analysis
3.7 End User Analysis
3.8 Emerging Markets
3.9 Impact of Covid-19
4 Porters Five Force Analysis
4.1 Bargaining power of suppliers
4.2 Bargaining power of buyers
4.3 Threat of substitutes
4.4 Threat of new entrants
4.5 Competitive rivalry
5 Global White Biotech Market, By Product
5.1 Introduction
5.2 Biopolymers
5.3 Biofuels
5.4 Biochemicals
5.5 Industrial Enzymes
5.6 Other Products
6 Global White Biotech Market, By End User
6.1 Introduction
6.2 Electronics and Semiconductor
6.3 Consumer Goods And Services
6.4 Healthcare
6.5 Agriculture
6.6 Hospitality & Tourism
6.7 Automotive
6.8 Automation and Process Control
6.9 Aerospace And Defense
6.10 Food and Beverage
6.11 Chemicals & Materials
6.12 Energy and Resources
6.13 Information Technology
6.14 Other End Users
7 Global White Biotech Market, By Geography
7.1 Introduction
7.2 North America
7.2.1 US
7.2.2 Canada
7.2.3 Mexico
7.3 Europe
7.3.1 Germany
7.3.2 UK
7.3.3 Italy
7.3.4 France
7.3.5 Spain
7.3.6 Rest of Europe
7.4 Asia Pacific
7.4.1 Japan
7.4.2 China
7.4.3 India
7.4.4 Australia
7.4.5 New Zealand
7.4.6 South Korea
7.4.7 Rest of Asia Pacific
7.5 South America
7.5.1 Argentina
7.5.2 Brazil
7.5.3 Chile
7.5.4 Rest of South America
7.6 Middle East & Africa
7.6.1 Saudi Arabia
7.6.2 UAE
7.6.3 Qatar
7.6.4 South Africa
7.6.5 Rest of Middle East & Africa
8 Key Developments
8.1 Agreements, Partnerships, Collaborations and Joint Ventures
8.2 Acquisitions & Mergers
8.3 New Product Launch
8.4 Expansions
8.5 Other Key Strategies
9 Company Profiling
9.1 Global Bioenergies
9.2 Solazyme
9.3 Borregaard
9.4 BioAmber.
9.5 Fermentalg
9.6 Amyris
9.7 Codexis
9.8 Deinove
9.9 Novozymes
9.10 Metabolic Explorer
9.11 Evolva
9.12 Gevo
9.13 Kerry Group plc
9.14 BASF SE
List of Tables
1 Global White Biotech Market Outlook, By Region (2020-2028) ($MN)
2 Global White Biotech Market Outlook, By Product (2020-2028) ($MN)
3 Global White Biotech Market Outlook, By Biopolymers (2020-2028) ($MN)
4 Global White Biotech Market Outlook, By Biofuels (2020-2028) ($MN)
5 Global White Biotech Market Outlook, By Biochemicals (2020-2028) ($MN)
6 Global White Biotech Market Outlook, By Industrial Enzymes (2020-2028) ($MN)
7 Global White Biotech Market Outlook, By Other Products (2020-2028) ($MN)
8 Global White Biotech Market Outlook, By End User (2020-2028) ($MN)
9 Global White Biotech Market Outlook, By Electronics and Semiconductor (2020-2028) ($MN)
10 Global White Biotech Market Outlook, By Consumer Goods And Services (2020-2028) ($MN)
11 Global White Biotech Market Outlook, By Healthcare (2020-2028) ($MN)
12 Global White Biotech Market Outlook, By Agriculture (2020-2028) ($MN)
13 Global White Biotech Market Outlook, By Hospitality & Tourism (2020-2028) ($MN)
14 Global White Biotech Market Outlook, By Automotive (2020-2028) ($MN)
15 Global White Biotech Market Outlook, By Automation and Process Control (2020-2028) ($MN)
16 Global White Biotech Market Outlook, By Aerospace And Defense (2020-2028) ($MN)
17 Global White Biotech Market Outlook, By Food and Beverage (2020-2028) ($MN)
18 Global White Biotech Market Outlook, By Chemicals & Materials (2020-2028) ($MN)
19 Global White Biotech Market Outlook, By Energy and Resources (2020-2028) ($MN)
20 Global White Biotech Market Outlook, By Information Technology (2020-2028) ($MN)
21 Global White Biotech Market Outlook, By Other End Users (2020-2028) ($MN)
22 North America White Biotech Market Outlook, By Country (2020-2028) ($MN)
23 North America White Biotech Market Outlook, By Product (2020-2028) ($MN)
24 North America White Biotech Market Outlook, By Biopolymers (2020-2028) ($MN)
25 North America White Biotech Market Outlook, By Biofuels (2020-2028) ($MN)
26 North America White Biotech Market Outlook, By Biochemicals (2020-2028) ($MN)
27 North America White Biotech Market Outlook, By Industrial Enzymes (2020-2028) ($MN)
28 North America White Biotech Market Outlook, By Other Products (2020-2028) ($MN)
29 North America White Biotech Market Outlook, By End User (2020-2028) ($MN)
30 North America White Biotech Market Outlook, By Electronics and Semiconductor (2020-2028) ($MN)
31 North America White Biotech Market Outlook, By Consumer Goods And Services (2020-2028) ($MN)
32 North America White Biotech Market Outlook, By Healthcare (2020-2028) ($MN)
33 North America White Biotech Market Outlook, By Agriculture (2020-2028) ($MN)
34 North America White Biotech Market Outlook, By Hospitality & Tourism (2020-2028) ($MN)
35 North America White Biotech Market Outlook, By Automotive (2020-2028) ($MN)
36 North America White Biotech Market Outlook, By Automation and Process Control (2020-2028) ($MN)
37 North America White Biotech Market Outlook, By Aerospace And Defense (2020-2028) ($MN)
38 North America White Biotech Market Outlook, By Food and Beverage (2020-2028) ($MN)
39 North America White Biotech Market Outlook, By Chemicals & Materials (2020-2028) ($MN)
40 North America White Biotech Market Outlook, By Energy and Resources (2020-2028) ($MN)
41 North America White Biotech Market Outlook, By Information Technology (2020-2028) ($MN)
42 North America White Biotech Market Outlook, By Other End Users (2020-2028) ($MN)
43 Europe White Biotech Market Outlook, By Country (2020-2028) ($MN)
44 Europe White Biotech Market Outlook, By Product (2020-2028) ($MN)
45 Europe White Biotech Market Outlook, By Biopolymers (2020-2028) ($MN)
46 Europe White Biotech Market Outlook, By Biofuels (2020-2028) ($MN)
47 Europe White Biotech Market Outlook, By Biochemicals (2020-2028) ($MN)
48 Europe White Biotech Market Outlook, By Industrial Enzymes (2020-2028) ($MN)
49 Europe White Biotech Market Outlook, By Other Products (2020-2028) ($MN)
50 Europe White Biotech Market Outlook, By End User (2020-2028) ($MN)
51 Europe White Biotech Market Outlook, By Electronics and Semiconductor (2020-2028) ($MN)
52 Europe White Biotech Market Outlook, By Consumer Goods And Services (2020-2028) ($MN)
53 Europe White Biotech Market Outlook, By Healthcare (2020-2028) ($MN)
54 Europe White Biotech Market Outlook, By Agriculture (2020-2028) ($MN)
55 Europe White Biotech Market Outlook, By Hospitality & Tourism (2020-2028) ($MN)
56 Europe White Biotech Market Outlook, By Automotive (2020-2028) ($MN)
57 Europe White Biotech Market Outlook, By Automation and Process Control (2020-2028) ($MN)
58 Europe White Biotech Market Outlook, By Aerospace And Defense (2020-2028) ($MN)
59 Europe White Biotech Market Outlook, By Food and Beverage (2020-2028) ($MN)
60 Europe White Biotech Market Outlook, By Chemicals & Materials (2020-2028) ($MN)
61 Europe White Biotech Market Outlook, By Energy and Resources (2020-2028) ($MN)
62 Europe White Biotech Market Outlook, By Information Technology (2020-2028) ($MN)
63 Europe White Biotech Market Outlook, By Other End Users (2020-2028) ($MN)
64 Asia Pacific White Biotech Market Outlook, By Country (2020-2028) ($MN)
65 Asia Pacific White Biotech Market Outlook, By Product (2020-2028) ($MN)
66 Asia Pacific White Biotech Market Outlook, By Biopolymers (2020-2028) ($MN)
67 Asia Pacific White Biotech Market Outlook, By Biofuels (2020-2028) ($MN)
68 Asia Pacific White Biotech Market Outlook, By Biochemicals (2020-2028) ($MN)
69 Asia Pacific White Biotech Market Outlook, By Industrial Enzymes (2020-2028) ($MN)
70 Asia Pacific White Biotech Market Outlook, By Other Products (2020-2028) ($MN)
71 Asia Pacific White Biotech Market Outlook, By End User (2020-2028) ($MN)
72 Asia Pacific White Biotech Market Outlook, By Electronics and Semiconductor (2020-2028) ($MN)
73 Asia Pacific White Biotech Market Outlook, By Consumer Goods And Services (2020-2028) ($MN)
74 Asia Pacific White Biotech Market Outlook, By Healthcare (2020-2028) ($MN)
75 Asia Pacific White Biotech Market Outlook, By Agriculture (2020-2028) ($MN)
76 Asia Pacific White Biotech Market Outlook, By Hospitality & Tourism (2020-2028) ($MN)
77 Asia Pacific White Biotech Market Outlook, By Automotive (2020-2028) ($MN)
78 Asia Pacific White Biotech Market Outlook, By Automation and Process Control (2020-2028) ($MN)
79 Asia Pacific White Biotech Market Outlook, By Aerospace And Defense (2020-2028) ($MN)
80 Asia Pacific White Biotech Market Outlook, By Food and Beverage (2020-2028) ($MN)
81 Asia Pacific White Biotech Market Outlook, By Chemicals & Materials (2020-2028) ($MN)
82 Asia Pacific White Biotech Market Outlook, By Energy and Resources (2020-2028) ($MN)
83 Asia Pacific White Biotech Market Outlook, By Information Technology (2020-2028) ($MN)
84 Asia Pacific White Biotech Market Outlook, By Other End Users (2020-2028) ($MN)
85 South America White Biotech Market Outlook, By Country (2020-2028) ($MN)
86 South America White Biotech Market Outlook, By Product (2020-2028) ($MN)
87 South America White Biotech Market Outlook, By Biopolymers (2020-2028) ($MN)
88 South America White Biotech Market Outlook, By Biofuels (2020-2028) ($MN)
89 South America White Biotech Market Outlook, By Biochemicals (2020-2028) ($MN)
90 South America White Biotech Market Outlook, By Industrial Enzymes (2020-2028) ($MN)
91 South America White Biotech Market Outlook, By Other Products (2020-2028) ($MN)
92 South America White Biotech Market Outlook, By End User (2020-2028) ($MN)
93 South America White Biotech Market Outlook, By Electronics and Semiconductor (2020-2028) ($MN)
94 South America White Biotech Market Outlook, By Consumer Goods And Services (2020-2028) ($MN)
95 South America White Biotech Market Outlook, By Healthcare (2020-2028) ($MN)
96 South America White Biotech Market Outlook, By Agriculture (2020-2028) ($MN)
97 South America White Biotech Market Outlook, By Hospitality & Tourism (2020-2028) ($MN)
98 South America White Biotech Market Outlook, By Automotive (2020-2028) ($MN)
99 South America White Biotech Market Outlook, By Automation and Process Control (2020-2028) ($MN)
100 South America White Biotech Market Outlook, By Aerospace And Defense (2020-2028) ($MN)
101 South America White Biotech Market Outlook, By Food and Beverage (2020-2028) ($MN)
102 South America White Biotech Market Outlook, By Chemicals & Materials (2020-2028) ($MN)
103 South America White Biotech Market Outlook, By Energy and Resources (2020-2028) ($MN)
104 South America White Biotech Market Outlook, By Information Technology (2020-2028) ($MN)
105 South America White Biotech Market Outlook, By Other End Users (2020-2028) ($MN)
106 Middle East & Africa White Biotech Market Outlook, By Country (2020-2028) ($MN)
107 Middle East & Africa White Biotech Market Outlook, By Product (2020-2028) ($MN)
108 Middle East & Africa White Biotech Market Outlook, By Biopolymers (2020-2028) ($MN)
109 Middle East & Africa White Biotech Market Outlook, By Biofuels (2020-2028) ($MN)
110 Middle East & Africa White Biotech Market Outlook, By Biochemicals (2020-2028) ($MN)
111 Middle East & Africa White Biotech Market Outlook, By Industrial Enzymes (2020-2028) ($MN)
112 Middle East & Africa White Biotech Market Outlook, By Other Products (2020-2028) ($MN)
113 Middle East & Africa White Biotech Market Outlook, By End User (2020-2028) ($MN)
114 Middle East & Africa White Biotech Market Outlook, By Electronics and Semiconductor (2020-2028) ($MN)
115 Middle East & Africa White Biotech Market Outlook, By Consumer Goods And Services (2020-2028) ($MN)
116 Middle East & Africa White Biotech Market Outlook, By Healthcare (2020-2028) ($MN)
117 Middle East & Africa White Biotech Market Outlook, By Agriculture (2020-2028) ($MN)
118 Middle East & Africa White Biotech Market Outlook, By Hospitality & Tourism (2020-2028) ($MN)
119 Middle East & Africa White Biotech Market Outlook, By Automotive (2020-2028) ($MN)
120 Middle East & Africa White Biotech Market Outlook, By Automation and Process Control (2020-2028) ($MN)
121 Middle East & Africa White Biotech Market Outlook, By Aerospace And Defense (2020-2028) ($MN)
122 Middle East & Africa White Biotech Market Outlook, By Food and Beverage (2020-2028) ($MN)
123 Middle East & Africa White Biotech Market Outlook, By Chemicals & Materials (2020-2028) ($MN)
124 Middle East & Africa White Biotech Market Outlook, By Energy and Resources (2020-2028) ($MN)
125 Middle East & Africa White Biotech Market Outlook, By Information Technology (2020-2028) ($MN)
126 Middle East & Africa White Biotech Market Outlook, By Other End Users (2020-2028) ($MN)
List of Figures
RESEARCH METHODOLOGY

We at ‘Stratistics’ opt for an extensive research approach which involves data mining, data validation, and data analysis. The various research sources include in-house repository, secondary research, competitor’s sources, social media research, client internal data, and primary research.
Our team of analysts prefers the most reliable and authenticated data sources in order to perform the comprehensive literature search. With access to most of the authenticated data bases our team highly considers the best mix of information through various sources to obtain extensive and accurate analysis.
Each report takes an average time of a month and a team of 4 industry analysts. The time may vary depending on the scope and data availability of the desired market report. The various parameters used in the market assessment are standardized in order to enhance the data accuracy.
Data Mining
The data is collected from several authenticated, reliable, paid and unpaid sources and is filtered depending on the scope & objective of the research. Our reports repository acts as an added advantage in this procedure. Data gathering from the raw material suppliers, distributors and the manufacturers is performed on a regular basis, this helps in the comprehensive understanding of the products value chain. Apart from the above mentioned sources the data is also collected from the industry consultants to ensure the objective of the study is in the right direction.
Market trends such as technological advancements, regulatory affairs, market dynamics (Drivers, Restraints, Opportunities and Challenges) are obtained from scientific journals, market related national & international associations and organizations.
Data Analysis
From the data that is collected depending on the scope & objective of the research the data is subjected for the analysis. The critical steps that we follow for the data analysis include:
- Product Lifecycle Analysis
- Competitor analysis
- Risk analysis
- Porters Analysis
- PESTEL Analysis
- SWOT Analysis
The data engineering is performed by the core industry experts considering both the Marketing Mix Modeling and the Demand Forecasting. The marketing mix modeling makes use of multiple-regression techniques to predict the optimal mix of marketing variables. Regression factor is based on a number of variables and how they relate to an outcome such as sales or profits.
Data Validation
The data validation is performed by the exhaustive primary research from the expert interviews. This includes telephonic interviews, focus groups, face to face interviews, and questionnaires to validate our research from all aspects. The industry experts we approach come from the leading firms, involved in the supply chain ranging from the suppliers, distributors to the manufacturers and consumers so as to ensure an unbiased analysis.
We are in touch with more than 15,000 industry experts with the right mix of consultants, CEO's, presidents, vice presidents, managers, experts from both supply side and demand side, executives and so on.
The data validation involves the primary research from the industry experts belonging to:
- Leading Companies
- Suppliers & Distributors
- Manufacturers
- Consumers
- Industry/Strategic Consultants
Apart from the data validation the primary research also helps in performing the fill gap research, i.e. providing solutions for the unmet needs of the research which helps in enhancing the reports quality.
For more details about research methodology, kindly write to us at info@strategymrc.com
Frequently Asked Questions
In case of any queries regarding this report, you can contact the customer service by filing the “Inquiry Before Buy” form available on the right hand side. You may also contact us through email: info@strategymrc.com or phone: +1-301-202-5929
Yes, the samples are available for all the published reports. You can request them by filling the “Request Sample” option available in this page.
Yes, you can request a sample with your specific requirements. All the customized samples will be provided as per the requirement with the real data masked.
All our reports are available in Digital PDF format. In case if you require them in any other formats, such as PPT, Excel etc you can submit a request through “Inquiry Before Buy” form available on the right hand side. You may also contact us through email: info@strategymrc.com or phone: +1-301-202-5929
We offer a free 15% customization with every purchase. This requirement can be fulfilled for both pre and post sale. You may send your customization requirements through email at info@strategymrc.com or call us on +1-301-202-5929.
We have 3 different licensing options available in electronic format.
- Single User Licence: Allows one person, typically the buyer, to have access to the ordered product. The ordered product cannot be distributed to anyone else.
- 2-5 User Licence: Allows the ordered product to be shared among a maximum of 5 people within your organisation.
- Corporate License: Allows the product to be shared among all employees of your organisation regardless of their geographical location.
All our reports are typically be emailed to you as an attachment.
To order any available report you need to register on our website. The payment can be made either through CCAvenue or PayPal payments gateways which accept all international cards.
We extend our support to 6 months post sale. A post sale customization is also provided to cover your unmet needs in the report.
Request Customization
We provide a free 15% customization on every purchase. This requirement can be fulfilled for both pre and post sale. You may send your customization requirements through email at info@strategymrc.com or call us on +1-301-202-5929.
Note: This customization is absolutely free until it falls under the 15% bracket. If your requirement exceeds this a feasibility check will be performed. Post that, a quote will be provided along with the timelines.
WHY CHOOSE US ?

Assured Quality
Best in class reports with high standard of research integrity

24X7 Research Support
Continuous support to ensure the best customer experience.

Free Customization
Adding more values to your product of interest.

Safe & Secure Access
Providing a secured environment for all online transactions.

Trusted by 600+ Brands
Serving the most reputed brands across the world.