
3d Ic And 25d Ic Packaging Market
3D Integrated Circuit (IC)and 2.5D Integrated Circuit (IC) Packaging Market Forecasts to 2028 - Global Analysis By Packaging Technology (3D Through-Silicon Via (TSV), 3D Wafer-Level Chip-Scale Packaging (WLCSP) and 2.5D), Application (Imaging & Optoelectronics, Memory, Logic, MEMS/Sensors, LED and Other Applications), End User and By Geography

|
Years Covered |
2020-2028 |
|
Estimated Year Value (2022) |
US $49.3 BN |
|
Projected Year Value (2028) |
US $101.0 BN |
|
CAGR (2022 - 2028) |
12.7% |
|
Regions Covered |
North America, Europe, Asia Pacific, South America, and Middle East & Africa |
|
Countries Covered |
US, Canada, Mexico, Germany, UK, Italy, France, Spain, Japan, China, India, Australia, New Zealand, South Korea, Rest of Asia Pacific, South America, Argentina, Brazil, Chile, Middle East & Africa, Saudi Arabia, UAE, Qatar, and South Africa |
|
Largest Market |
Asia Pacific |
|
Highest Growing Market |
North America |
According to Stratistics MRC, the Global 3D IC and 2.5D IC Packaging Market is accounted for $49.3 billion in 2022 and is expected to reach $101.0 billion by 2028 growing at a CAGR of 12.7% during the forecast period. 2.5D / 3D packaging is a way of putting numerous integrated circuits (IC) into the same package. Two or more active semiconductor chips are put side by side atop a silicon interposer in a 2.5D arrangement to achieve extraordinarily high die-to-die connection density. Active chips in 3D structures are integrated via die stacking for the shortest connectivity and lowest package footprint. Because of their advantages in obtaining exceptionally high package density and great energy efficiency, 2.5D and 3D have gained traction as an appropriate chiplet integration platform in recent years.
According to WSTS, the IC market for semiconductors reached USD 463 billion in revenue in 2021 and is expected to grow by over 10% to USD 510.96 billion in 2022 due to the surging usage of advanced wafer-level packaging technologies in sensors and MEMS, is expected to provide growth prospects for the 3D IC packaging market during the forecast period.
Market Dynamics:
Driver:
Consumer gadgets and gaming devices are becoming increasingly popular
Many new gadgets are entering the market as a result of recent technological advancements, such as e-book readers, gaming devices, tablet computers, 3D smart glass, augmented reality, and virtual reality products, all of which require high-performance electronic components. By shortening the critical route and lowering latency, 3D IC packaging technology has helped overcome the processor memory performance gap. It also enables scaling to continue in an effective manner by shifting the emphasis from device-level scaling to circuit- and system-level scaling.
Restraint:
Thermal difficulties caused by a higher level of integration
3D integrated circuits provide extremely dense multi-level integration per unit footprint. Though this is appealing for many applications where miniaturisation is a concern, it also poses thermal management challenges; increased integration leads to high on-chip temperatures. A bigger form factor, the need for a larger silicon interposer, and lengthier design cycles are all difficulties that must be addressed with 3D ICs. During the production of 3D ICs with TSVs, overheating has been observed. Elevated temperatures cause a decrease in threshold voltage and mobility deterioration.
Opportunity:
A growing number of smart infrastructure and smart city initiatives are being developed
3D IC packaging has the potential to play an important role in the development and deployment of smart city technologies. Smart cities use a range of electronic devices, sensors, and systems to gather and analyse data in real time, allowing for better decision-making and resource management. These devices and systems can be made smaller, more powerful, and energy efficient by utilising 3D IC packaging. This contributes to lowering the total cost and size of smart city infrastructure while enhancing performance and dependability.
Threat:
3D IC packaging reliability challenges
Applications like as information centred, cloud, accessibility, and the Internet of Things (IoT) drive the semiconductor sector business. To meet the needs of modern information and communication technology (ICT) systems, packaging technology must improve in tandem with the scaling of integrated circuit (IC) technology. Package development and design must fulfil price, efficiency, form factor, and dependability goals all at the same time. When it comes to operating the layout, the power density for a given footprint is higher than for typical 2D chips. However, addressing issues of dependability will be critical which hampers the growth of the market.
Covid-19 Impact
The COVID-19 pandemic has had a huge influence on different businesses while also propelling the development of new medical equipment and gadgets throughout the world. Following the pandemic outbreak, several medical equipment manufacturing companies announced an increase in the production of several new equipment and devices. Because 3D IC packaging has numerous applications in the medical and healthcare industries, increased manufacturing initiatives are expected to increase demand for 3D IC and 2.5D IC packaging.
The 3D wafer-level chip-scale packaging (WLCSP) segment is expected to be the largest during the forecast period
The 3D wafer-level chip-scale packaging (WLCSP) segment is estimated to have a lucrative growth, due to its one of most tightly packaging type, offering enhanced capabilities and improved thermal stability in printed circuit boards. 3D WLCSP is a simpler process architecture for producing 3D ICs, which employs polymers that can withstand high temperatures, resolving the thermal stability issue, which is the market's biggest difficulty. Because it provides economical, small, lightweight, exceptional performance semiconductor solutions, 3D WLCSP has been gaining prominence in facility-constrained consumer’s electronic applications and other portable consumer devices, as well as industrial products.
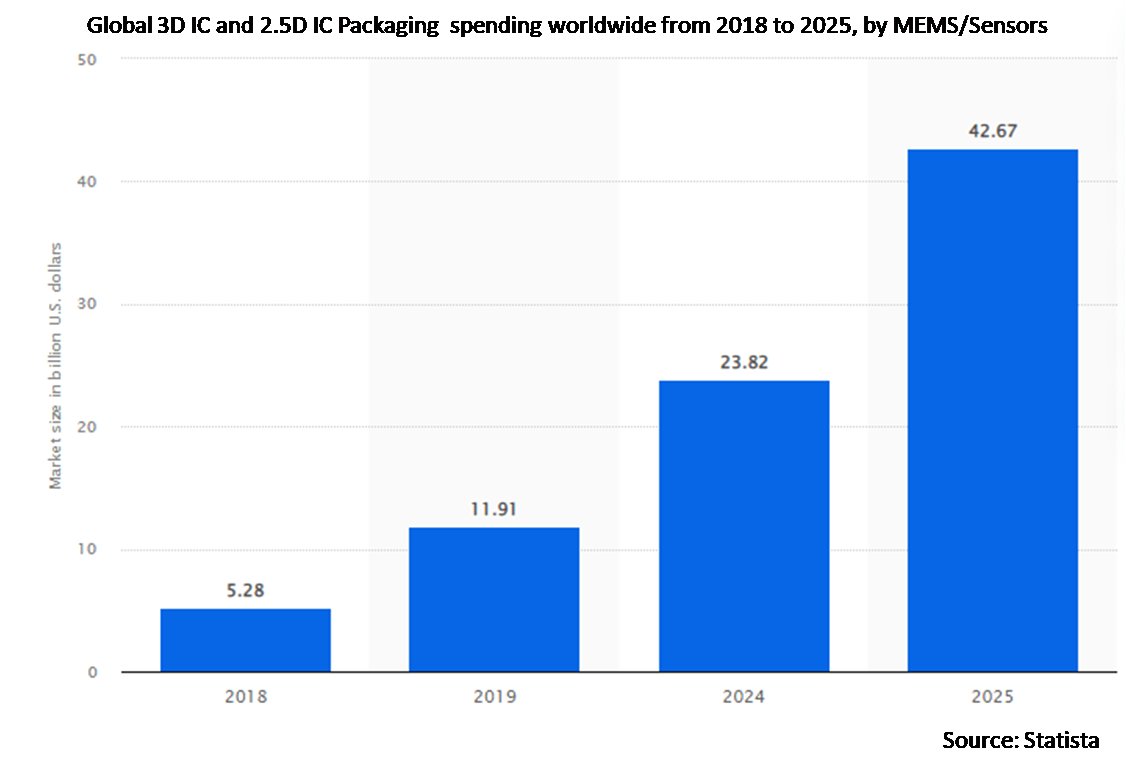
The MEMS/Sensors segment is expected to have the highest CAGR during the forecast period
The MEMS/Sensors segment is anticipated to witness the highest CAGR growth during the forecast period, because MEMS functional components include micro sensors, micro actuators, and microelectronics. MEMS advanced elements include accelerometers, gyroscopes, digital compasses, inertial modules, pressure sensors, humidity sensors, microphones, and smart sensors, among others. The essential need in all of these parts and sensors is a miniaturised construction. As a result, many sensors are now using 3D IC and 2.5D IC packaging.
Region with highest share:
Asia Pacific is projected to hold the highest market share during the forecast period owing to its extensive reach in numerous consumer electronics applications, notably smartphone and tablets, the Asia Pacific area is one of the important markets for 3D IC and 2.5D IC packaging. This is mostly due to the region's high population density, which makes it the greatest potential market for 3D IC and 2.5D IC packaging among the four key areas.
Region with highest CAGR:
North America is projected to have the highest CAGR over the forecast period, owing to rising demand for electronics; growing patterns of remote work and remote operations, and boosting digitalization have all contributed to the need for cutting-edge semiconductor devices in the United States. As the demand for semiconductor devices rises, modern packaging techniques provide the processing power and form factor required for today's digital world. These factors are expected to drive 3D IC and 2.5D IC sales in the United States.

Key players in the market
Some of the key players profiled in the 3D IC and 2.5D IC Packaging Market include Samsung, ASE Technology Holding Co., Ltd., Amkor Technology, Broadcom, United Microelectronics Corporation, Texas Instruments Inc, Powertech Technology Inc., JCET Group Co., Ltd., Taiwan Semiconductor Manufacturing Company, Ltd., Intel Corporation, Toshiba Corporation, Invensas, GlobalFoundries, Siliconware Precision Industries Co. Ltd (SPIL) and Jiangsu Changjiang Electronics Technology Co., Ltd.
Key Developments:
In April 2023, Samsung Opens Free-to-Play Gaming Zones in Collaboration With Xbox at Microsoft Experience Centers in London, New York, with this partnership, Samsung Gaming Hub users are now able to stream over 100 high-quality games through the Xbox App by subscribing to Xbox Game Pass Ultimate.
In April 2023, Samsung and TOILETPAPER Collaborate to Introduce Edgy, Iconic Designs for Bespoke Appliances, together with creative partner TOILETPAPER, Samsung offers new, limited-edition Bespoke panels that maximize bold self-expression and personalization in the kitchen.
In March 2023, Amkor Expands Power Solutions for Automotive Electrification, as the demand for electrification, renewable energy, and efficient power delivery continues to grow, Amkor is focusing increased effort on silicon carbide
Packaging Technologies Covered:
• 3D Through-Silicon Via (TSV)
• 3D Wafer-Level Chip-Scale Packaging (WLCSP)
• 2.5D
Applications Covered:
• Imaging & Optoelectronics
• Memory
• Logic
• MEMS/Sensors
• LED
• Other Applications
End Users Covered:
• Industrial
• Telecommunications
• Consumer Electronics
• Military & Aerospace
• Medical Devices
• Automotive
Regions Covered:
• North America
o US
o Canada
o Mexico
• Europe
o Germany
o UK
o Italy
o France
o Spain
o Rest of Europe
• Asia Pacific
o Japan
o China
o India
o Australia
o New Zealand
o South Korea
o Rest of Asia Pacific
• South America
o Argentina
o Brazil
o Chile
o Rest of South America
• Middle East & Africa
o Saudi Arabia
o UAE
o Qatar
o South Africa
o Rest of Middle East & Africa
What our report offers:
- Market share assessments for the regional and country-level segments
- Strategic recommendations for the new entrants
- Covers Market data for the years 2020, 2021, 2022, 2025, and 2028
- Market Trends (Drivers, Constraints, Opportunities, Threats, Challenges, Investment Opportunities, and recommendations)
- Strategic recommendations in key business segments based on the market estimations
- Competitive landscaping mapping the key common trends
- Company profiling with detailed strategies, financials, and recent developments
- Supply chain trends mapping the latest technological advancements
Free Customization Offerings:
All the customers of this report will be entitled to receive one of the following free customization options:
• Company Profiling
o Comprehensive profiling of additional market players (up to 3)
o SWOT Analysis of key players (up to 3)
• Regional Segmentation
o Market estimations, Forecasts and CAGR of any prominent country as per the client's interest (Note: Depends on feasibility check)
• Competitive Benchmarking
o Benchmarking of key players based on product portfolio, geographical presence, and strategic alliances
Table of Contents
1 Executive Summary
2 Preface
2.1 Abstract
2.2 Stake Holders
2.3 Research Scope
2.4 Research Methodology
2.4.1 Data Mining
2.4.2 Data Analysis
2.4.3 Data Validation
2.4.4 Research Approach
2.5 Research Sources
2.5.1 Primary Research Sources
2.5.2 Secondary Research Sources
2.5.3 Assumptions
3 Market Trend Analysis
3.1 Introduction
3.2 Drivers
3.3 Restraints
3.4 Opportunities
3.5 Threats
3.6 Application Analysis
3.7 End User Analysis
3.8 Emerging Markets
3.9 Impact of Covid-19
4 Porters Five Force Analysis
4.1 Bargaining power of suppliers
4.2 Bargaining power of buyers
4.3 Threat of substitutes
4.4 Threat of new entrants
4.5 Competitive rivalry
5 Global 3D IC and 2.5D IC Packaging Market, By Packaging Technology
5.1 Introduction
5.2 3D Through-Silicon Via (TSV)
5.3 3D Wafer-Level Chip-Scale Packaging (WLCSP)
5.4 2.5D
6 Global 3D IC and 2.5D IC Packaging Market, By Application
6.1 Introduction
6.2 Imaging & Optoelectronics
6.3 Memory
6.4 Logic
6.5 MEMS/Sensors
6.6 LED
6.7 Other Applications
7 Global 3D IC and 2.5D IC Packaging Market, By End User
7.1 Introduction
7.2 Industrial
7.3 Telecommunications
7.4 Consumer Electronics
7.5 Military & Aerospace
7.6 Medical Devices
7.7 Automotive
8 Global 3D IC and 2.5D IC Packaging Market, By Geography
8.1 Introduction
8.2 North America
8.2.1 US
8.2.2 Canada
8.2.3 Mexico
8.3 Europe
8.3.1 Germany
8.3.2 UK
8.3.3 Italy
8.3.4 France
8.3.5 Spain
8.3.6 Rest of Europe
8.4 Asia Pacific
8.4.1 Japan
8.4.2 China
8.4.3 India
8.4.4 Australia
8.4.5 New Zealand
8.4.6 South Korea
8.4.7 Rest of Asia Pacific
8.5 South America
8.5.1 Argentina
8.5.2 Brazil
8.5.3 Chile
8.5.4 Rest of South America
8.6 Middle East & Africa
8.6.1 Saudi Arabia
8.6.2 UAE
8.6.3 Qatar
8.6.4 South Africa
8.6.5 Rest of Middle East & Africa
9 Key Developments
9.1 Agreements, Partnerships, Collaborations and Joint Ventures
9.2 Acquisitions & Mergers
9.3 New Product Launch
9.4 Expansions
9.5 Other Key Strategies
10 Company Profiling
10.1 Samsung
10.2 ASE Technology Holding Co., Ltd.
10.3 Amkor Technology
10.4 Broadcom
10.5 United Microelectronics Corporation
10.6 Texas Instruments Inc
10.7 Powertech Technology Inc.
10.8 JCET Group Co., Ltd.
10.9 Taiwan Semiconductor Manufacturing Company, Ltd.
10.10 Intel Corporation
10.11 Toshiba Corporation
10.12 Invensas
10.13 GlobalFoundries
10.14 Siliconware Precision Industries Co. Ltd (SPIL)
10.15 Jiangsu Changjiang Electronics Technology Co., Ltd.
List of Tables
1 Global 3D IC and 2.5D IC Packaging Market Outlook, By Region (2020-2028) ($MN)
2 Global 3D IC and 2.5D IC Packaging Market Outlook, By Packaging Technology (2020-2028) ($MN)
3 Global 3D IC and 2.5D IC Packaging Market Outlook, By 3D Through-Silicon Via (TSV) (2020-2028) ($MN)
4 Global 3D IC and 2.5D IC Packaging Market Outlook, By 3D Wafer-Level Chip-Scale Packaging (WLCSP) (2020-2028) ($MN)
5 Global 3D IC and 2.5D IC Packaging Market Outlook, By 2.5D (2020-2028) ($MN)
6 Global 3D IC and 2.5D IC Packaging Market Outlook, By Application (2020-2028) ($MN)
7 Global 3D IC and 2.5D IC Packaging Market Outlook, By Imaging & Optoelectronics (2020-2028) ($MN)
8 Global 3D IC and 2.5D IC Packaging Market Outlook, By Memory (2020-2028) ($MN)
9 Global 3D IC and 2.5D IC Packaging Market Outlook, By Logic (2020-2028) ($MN)
10 Global 3D IC and 2.5D IC Packaging Market Outlook, By MEMS/Sensors (2020-2028) ($MN)
11 Global 3D IC and 2.5D IC Packaging Market Outlook, By LED (2020-2028) ($MN)
12 Global 3D IC and 2.5D IC Packaging Market Outlook, By Other Applications (2020-2028) ($MN)
13 Global 3D IC and 2.5D IC Packaging Market Outlook, By End User (2020-2028) ($MN)
14 Global 3D IC and 2.5D IC Packaging Market Outlook, By Industrial (2020-2028) ($MN)
15 Global 3D IC and 2.5D IC Packaging Market Outlook, By Telecommunications (2020-2028) ($MN)
16 Global 3D IC and 2.5D IC Packaging Market Outlook, By Consumer Electronics (2020-2028) ($MN)
17 Global 3D IC and 2.5D IC Packaging Market Outlook, By Military & Aerospace (2020-2028) ($MN)
18 Global 3D IC and 2.5D IC Packaging Market Outlook, By Medical Devices (2020-2028) ($MN)
19 Global 3D IC and 2.5D IC Packaging Market Outlook, By Automotive (2020-2028) ($MN)
20 North America 3D IC and 2.5D IC Packaging Market Outlook, By Country (2020-2028) ($MN)
21 North America 3D IC and 2.5D IC Packaging Market Outlook, By Packaging Technology (2020-2028) ($MN)
22 North America 3D IC and 2.5D IC Packaging Market Outlook, By 3D Through-Silicon Via (TSV) (2020-2028) ($MN)
23 North America 3D IC and 2.5D IC Packaging Market Outlook, By 3D Wafer-Level Chip-Scale Packaging (WLCSP) (2020-2028) ($MN)
24 North America 3D IC and 2.5D IC Packaging Market Outlook, By 2.5D (2020-2028) ($MN)
25 North America 3D IC and 2.5D IC Packaging Market Outlook, By Application (2020-2028) ($MN)
26 North America 3D IC and 2.5D IC Packaging Market Outlook, By Imaging & Optoelectronics (2020-2028) ($MN)
27 North America 3D IC and 2.5D IC Packaging Market Outlook, By Memory (2020-2028) ($MN)
28 North America 3D IC and 2.5D IC Packaging Market Outlook, By Logic (2020-2028) ($MN)
29 North America 3D IC and 2.5D IC Packaging Market Outlook, By MEMS/Sensors (2020-2028) ($MN)
30 North America 3D IC and 2.5D IC Packaging Market Outlook, By LED (2020-2028) ($MN)
31 North America 3D IC and 2.5D IC Packaging Market Outlook, By Other Applications (2020-2028) ($MN)
32 North America 3D IC and 2.5D IC Packaging Market Outlook, By End User (2020-2028) ($MN)
33 North America 3D IC and 2.5D IC Packaging Market Outlook, By Industrial (2020-2028) ($MN)
34 North America 3D IC and 2.5D IC Packaging Market Outlook, By Telecommunications (2020-2028) ($MN)
35 North America 3D IC and 2.5D IC Packaging Market Outlook, By Consumer Electronics (2020-2028) ($MN)
36 North America 3D IC and 2.5D IC Packaging Market Outlook, By Military & Aerospace (2020-2028) ($MN)
37 North America 3D IC and 2.5D IC Packaging Market Outlook, By Medical Devices (2020-2028) ($MN)
38 North America 3D IC and 2.5D IC Packaging Market Outlook, By Automotive (2020-2028) ($MN)
39 Europe 3D IC and 2.5D IC Packaging Market Outlook, By Country (2020-2028) ($MN)
40 Europe 3D IC and 2.5D IC Packaging Market Outlook, By Packaging Technology (2020-2028) ($MN)
41 Europe 3D IC and 2.5D IC Packaging Market Outlook, By 3D Through-Silicon Via (TSV) (2020-2028) ($MN)
42 Europe 3D IC and 2.5D IC Packaging Market Outlook, By 3D Wafer-Level Chip-Scale Packaging (WLCSP) (2020-2028) ($MN)
43 Europe 3D IC and 2.5D IC Packaging Market Outlook, By 2.5D (2020-2028) ($MN)
44 Europe 3D IC and 2.5D IC Packaging Market Outlook, By Application (2020-2028) ($MN)
45 Europe 3D IC and 2.5D IC Packaging Market Outlook, By Imaging & Optoelectronics (2020-2028) ($MN)
46 Europe 3D IC and 2.5D IC Packaging Market Outlook, By Memory (2020-2028) ($MN)
47 Europe 3D IC and 2.5D IC Packaging Market Outlook, By Logic (2020-2028) ($MN)
48 Europe 3D IC and 2.5D IC Packaging Market Outlook, By MEMS/Sensors (2020-2028) ($MN)
49 Europe 3D IC and 2.5D IC Packaging Market Outlook, By LED (2020-2028) ($MN)
50 Europe 3D IC and 2.5D IC Packaging Market Outlook, By Other Applications (2020-2028) ($MN)
51 Europe 3D IC and 2.5D IC Packaging Market Outlook, By End User (2020-2028) ($MN)
52 Europe 3D IC and 2.5D IC Packaging Market Outlook, By Industrial (2020-2028) ($MN)
53 Europe 3D IC and 2.5D IC Packaging Market Outlook, By Telecommunications (2020-2028) ($MN)
54 Europe 3D IC and 2.5D IC Packaging Market Outlook, By Consumer Electronics (2020-2028) ($MN)
55 Europe 3D IC and 2.5D IC Packaging Market Outlook, By Military & Aerospace (2020-2028) ($MN)
56 Europe 3D IC and 2.5D IC Packaging Market Outlook, By Medical Devices (2020-2028) ($MN)
57 Europe 3D IC and 2.5D IC Packaging Market Outlook, By Automotive (2020-2028) ($MN)
58 Asia Pacific 3D IC and 2.5D IC Packaging Market Outlook, By Country (2020-2028) ($MN)
59 Asia Pacific 3D IC and 2.5D IC Packaging Market Outlook, By Packaging Technology (2020-2028) ($MN)
60 Asia Pacific 3D IC and 2.5D IC Packaging Market Outlook, By 3D Through-Silicon Via (TSV) (2020-2028) ($MN)
61 Asia Pacific 3D IC and 2.5D IC Packaging Market Outlook, By 3D Wafer-Level Chip-Scale Packaging (WLCSP) (2020-2028) ($MN)
62 Asia Pacific 3D IC and 2.5D IC Packaging Market Outlook, By 2.5D (2020-2028) ($MN)
63 Asia Pacific 3D IC and 2.5D IC Packaging Market Outlook, By Application (2020-2028) ($MN)
64 Asia Pacific 3D IC and 2.5D IC Packaging Market Outlook, By Imaging & Optoelectronics (2020-2028) ($MN)
65 Asia Pacific 3D IC and 2.5D IC Packaging Market Outlook, By Memory (2020-2028) ($MN)
66 Asia Pacific 3D IC and 2.5D IC Packaging Market Outlook, By Logic (2020-2028) ($MN)
67 Asia Pacific 3D IC and 2.5D IC Packaging Market Outlook, By MEMS/Sensors (2020-2028) ($MN)
68 Asia Pacific 3D IC and 2.5D IC Packaging Market Outlook, By LED (2020-2028) ($MN)
69 Asia Pacific 3D IC and 2.5D IC Packaging Market Outlook, By Other Applications (2020-2028) ($MN)
70 Asia Pacific 3D IC and 2.5D IC Packaging Market Outlook, By End User (2020-2028) ($MN)
71 Asia Pacific 3D IC and 2.5D IC Packaging Market Outlook, By Industrial (2020-2028) ($MN)
72 Asia Pacific 3D IC and 2.5D IC Packaging Market Outlook, By Telecommunications (2020-2028) ($MN)
73 Asia Pacific 3D IC and 2.5D IC Packaging Market Outlook, By Consumer Electronics (2020-2028) ($MN)
74 Asia Pacific 3D IC and 2.5D IC Packaging Market Outlook, By Military & Aerospace (2020-2028) ($MN)
75 Asia Pacific 3D IC and 2.5D IC Packaging Market Outlook, By Medical Devices (2020-2028) ($MN)
76 Asia Pacific 3D IC and 2.5D IC Packaging Market Outlook, By Automotive (2020-2028) ($MN)
77 South America 3D IC and 2.5D IC Packaging Market Outlook, By Country (2020-2028) ($MN)
78 South America 3D IC and 2.5D IC Packaging Market Outlook, By Packaging Technology (2020-2028) ($MN)
79 South America 3D IC and 2.5D IC Packaging Market Outlook, By 3D Through-Silicon Via (TSV) (2020-2028) ($MN)
80 South America 3D IC and 2.5D IC Packaging Market Outlook, By 3D Wafer-Level Chip-Scale Packaging (WLCSP) (2020-2028) ($MN)
81 South America 3D IC and 2.5D IC Packaging Market Outlook, By 2.5D (2020-2028) ($MN)
82 South America 3D IC and 2.5D IC Packaging Market Outlook, By Application (2020-2028) ($MN)
83 South America 3D IC and 2.5D IC Packaging Market Outlook, By Imaging & Optoelectronics (2020-2028) ($MN)
84 South America 3D IC and 2.5D IC Packaging Market Outlook, By Memory (2020-2028) ($MN)
85 South America 3D IC and 2.5D IC Packaging Market Outlook, By Logic (2020-2028) ($MN)
86 South America 3D IC and 2.5D IC Packaging Market Outlook, By MEMS/Sensors (2020-2028) ($MN)
87 South America 3D IC and 2.5D IC Packaging Market Outlook, By LED (2020-2028) ($MN)
88 South America 3D IC and 2.5D IC Packaging Market Outlook, By Other Applications (2020-2028) ($MN)
89 South America 3D IC and 2.5D IC Packaging Market Outlook, By End User (2020-2028) ($MN)
90 South America 3D IC and 2.5D IC Packaging Market Outlook, By Industrial (2020-2028) ($MN)
91 South America 3D IC and 2.5D IC Packaging Market Outlook, By Telecommunications (2020-2028) ($MN)
92 South America 3D IC and 2.5D IC Packaging Market Outlook, By Consumer Electronics (2020-2028) ($MN)
93 South America 3D IC and 2.5D IC Packaging Market Outlook, By Military & Aerospace (2020-2028) ($MN)
94 South America 3D IC and 2.5D IC Packaging Market Outlook, By Medical Devices (2020-2028) ($MN)
95 South America 3D IC and 2.5D IC Packaging Market Outlook, By Automotive (2020-2028) ($MN)
96 Middle East & Africa 3D IC and 2.5D IC Packaging Market Outlook, By Country (2020-2028) ($MN)
97 Middle East & Africa 3D IC and 2.5D IC Packaging Market Outlook, By Packaging Technology (2020-2028) ($MN)
98 Middle East & Africa 3D IC and 2.5D IC Packaging Market Outlook, By 3D Through-Silicon Via (TSV) (2020-2028) ($MN)
99 Middle East & Africa 3D IC and 2.5D IC Packaging Market Outlook, By 3D Wafer-Level Chip-Scale Packaging (WLCSP) (2020-2028) ($MN)
100 Middle East & Africa 3D IC and 2.5D IC Packaging Market Outlook, By 2.5D (2020-2028) ($MN)
101 Middle East & Africa 3D IC and 2.5D IC Packaging Market Outlook, By Application (2020-2028) ($MN)
102 Middle East & Africa 3D IC and 2.5D IC Packaging Market Outlook, By Imaging & Optoelectronics (2020-2028) ($MN)
103 Middle East & Africa 3D IC and 2.5D IC Packaging Market Outlook, By Memory (2020-2028) ($MN)
104 Middle East & Africa 3D IC and 2.5D IC Packaging Market Outlook, By Logic (2020-2028) ($MN)
105 Middle East & Africa 3D IC and 2.5D IC Packaging Market Outlook, By MEMS/Sensors (2020-2028) ($MN)
106 Middle East & Africa 3D IC and 2.5D IC Packaging Market Outlook, By LED (2020-2028) ($MN)
107 Middle East & Africa 3D IC and 2.5D IC Packaging Market Outlook, By Other Applications (2020-2028) ($MN)
108 Middle East & Africa 3D IC and 2.5D IC Packaging Market Outlook, By End User (2020-2028) ($MN)
109 Middle East & Africa 3D IC and 2.5D IC Packaging Market Outlook, By Industrial (2020-2028) ($MN)
110 Middle East & Africa 3D IC and 2.5D IC Packaging Market Outlook, By Telecommunications (2020-2028) ($MN)
111 Middle East & Africa 3D IC and 2.5D IC Packaging Market Outlook, By Consumer Electronics (2020-2028) ($MN)
112 Middle East & Africa 3D IC and 2.5D IC Packaging Market Outlook, By Military & Aerospace (2020-2028) ($MN)
113 Middle East & Africa 3D IC and 2.5D IC Packaging Market Outlook, By Medical Devices (2020-2028) ($MN)
114 Middle East & Africa 3D IC and 2.5D IC Packaging Market Outlook, By Automotive (2020-2028) ($MN)
List of Figures
RESEARCH METHODOLOGY

We at ‘Stratistics’ opt for an extensive research approach which involves data mining, data validation, and data analysis. The various research sources include in-house repository, secondary research, competitor’s sources, social media research, client internal data, and primary research.
Our team of analysts prefers the most reliable and authenticated data sources in order to perform the comprehensive literature search. With access to most of the authenticated data bases our team highly considers the best mix of information through various sources to obtain extensive and accurate analysis.
Each report takes an average time of a month and a team of 4 industry analysts. The time may vary depending on the scope and data availability of the desired market report. The various parameters used in the market assessment are standardized in order to enhance the data accuracy.
Data Mining
The data is collected from several authenticated, reliable, paid and unpaid sources and is filtered depending on the scope & objective of the research. Our reports repository acts as an added advantage in this procedure. Data gathering from the raw material suppliers, distributors and the manufacturers is performed on a regular basis, this helps in the comprehensive understanding of the products value chain. Apart from the above mentioned sources the data is also collected from the industry consultants to ensure the objective of the study is in the right direction.
Market trends such as technological advancements, regulatory affairs, market dynamics (Drivers, Restraints, Opportunities and Challenges) are obtained from scientific journals, market related national & international associations and organizations.
Data Analysis
From the data that is collected depending on the scope & objective of the research the data is subjected for the analysis. The critical steps that we follow for the data analysis include:
- Product Lifecycle Analysis
- Competitor analysis
- Risk analysis
- Porters Analysis
- PESTEL Analysis
- SWOT Analysis
The data engineering is performed by the core industry experts considering both the Marketing Mix Modeling and the Demand Forecasting. The marketing mix modeling makes use of multiple-regression techniques to predict the optimal mix of marketing variables. Regression factor is based on a number of variables and how they relate to an outcome such as sales or profits.
Data Validation
The data validation is performed by the exhaustive primary research from the expert interviews. This includes telephonic interviews, focus groups, face to face interviews, and questionnaires to validate our research from all aspects. The industry experts we approach come from the leading firms, involved in the supply chain ranging from the suppliers, distributors to the manufacturers and consumers so as to ensure an unbiased analysis.
We are in touch with more than 15,000 industry experts with the right mix of consultants, CEO's, presidents, vice presidents, managers, experts from both supply side and demand side, executives and so on.
The data validation involves the primary research from the industry experts belonging to:
- Leading Companies
- Suppliers & Distributors
- Manufacturers
- Consumers
- Industry/Strategic Consultants
Apart from the data validation the primary research also helps in performing the fill gap research, i.e. providing solutions for the unmet needs of the research which helps in enhancing the reports quality.
For more details about research methodology, kindly write to us at info@strategymrc.com
Frequently Asked Questions
In case of any queries regarding this report, you can contact the customer service by filing the “Inquiry Before Buy” form available on the right hand side. You may also contact us through email: info@strategymrc.com or phone: +1-301-202-5929
Yes, the samples are available for all the published reports. You can request them by filling the “Request Sample” option available in this page.
Yes, you can request a sample with your specific requirements. All the customized samples will be provided as per the requirement with the real data masked.
All our reports are available in Digital PDF format. In case if you require them in any other formats, such as PPT, Excel etc you can submit a request through “Inquiry Before Buy” form available on the right hand side. You may also contact us through email: info@strategymrc.com or phone: +1-301-202-5929
We offer a free 15% customization with every purchase. This requirement can be fulfilled for both pre and post sale. You may send your customization requirements through email at info@strategymrc.com or call us on +1-301-202-5929.
We have 3 different licensing options available in electronic format.
- Single User Licence: Allows one person, typically the buyer, to have access to the ordered product. The ordered product cannot be distributed to anyone else.
- 2-5 User Licence: Allows the ordered product to be shared among a maximum of 5 people within your organisation.
- Corporate License: Allows the product to be shared among all employees of your organisation regardless of their geographical location.
All our reports are typically be emailed to you as an attachment.
To order any available report you need to register on our website. The payment can be made either through CCAvenue or PayPal payments gateways which accept all international cards.
We extend our support to 6 months post sale. A post sale customization is also provided to cover your unmet needs in the report.
Request Customization
We offer complimentary customization of up to 15% with every purchase. To share your customization requirements, feel free to email us at info@strategymrc.com or call us on +1-301-202-5929. .
Please Note: Customization within the 15% threshold is entirely free of charge. If your request exceeds this limit, we will conduct a feasibility assessment. Following that, a detailed quote and timeline will be provided.
WHY CHOOSE US ?

Assured Quality
Best in class reports with high standard of research integrity

24X7 Research Support
Continuous support to ensure the best customer experience.

Free Customization
Adding more values to your product of interest.

Safe & Secure Access
Providing a secured environment for all online transactions.

Trusted by 600+ Brands
Serving the most reputed brands across the world.