
Acoustic Sensors Market
Acoustic Sensors Market Forecasts to 2028 - Global Analysis By Wave Type (Surface Wave Sensors (SWS), Bulk Wave Sensors (BWS)), Sensing Parameter (Chemical Vapour, Torque, Temperature, Viscosity, Pressure), and By Geography

|
Years Covered |
2020-2028 |
|
Estimated Year Value (2022) |
US $92.66 MN |
|
Projected Year Value (2028) |
US $135.20 MN |
|
CAGR (2022 - 2028) |
6.5% |
|
Regions Covered |
North America, Europe, Asia Pacific, South America, and Middle East & Africa |
|
Countries Covered |
US, Canada, Mexico, Germany, UK, Italy, France, Spain, Japan, China, India, Australia, New Zealand, South Korea, Rest of Asia Pacific, South America, Argentina, Brazil, Chile, Middle East & Africa, Saudi Arabia, UAE, Qatar, and South Africa |
|
Largest Market |
North America |
|
Fastest Growing Market |
Asia Pacific |
According to Stratistics MRC, the Global Acoustic Sensors Market is accounted for $92.66 million in 2022 and is expected to reach $135.20 million by 2028 growing at a CAGR of 6.5% during the forecast period. Acoustic sensors are known for their detection mechanism, which is an acoustic wave. These sensors are widely used in smart phones and base stations in the telecommunication industry. Under the process, the acoustic wave travels through the surface of the material used. Thus, any change in proliferation path would affect the velocity and amplitude of the acoustic wave. Velocity change can be monitored by checking the frequency and phase properties of the sensor used. Thus, it can be matched with the physical quantity being measured.
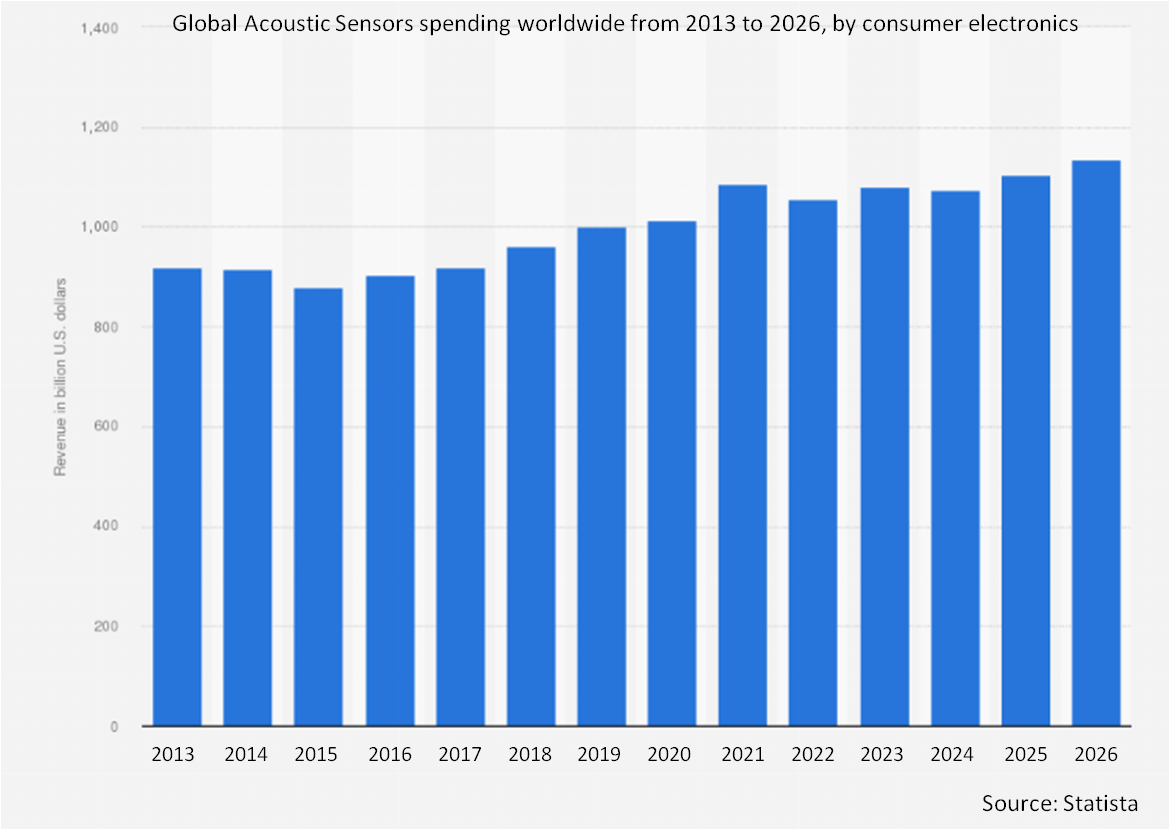
The revenues from the IoT sensors market amounted to over 11.9 billion U.S. dollars worldwide in 2019, with forecasts predicting that this number will increase to about 43 billion by 2025. Indeed, in 2019 almost 147?million units were sold globally and sales for 2020 are expected to be 10% higher still. Quite simply, smart speakers have reached an astonishing level of capability for recognizing what we say. Although speculation remains as to exactly how much they are listening to and what the collected data are used for, there is no doubt that the voice-recognition technology is amazing in its accuracy. This comes down to ultrasensitive acoustic sensors and sophisticated machine-learning algorithms interpreting speech.
Market Dynamics:
Driver:
Adoption of bulk acoustic sensors in automobile and commercial industries
Bulk acoustic wave devices are in commercial use since many long years. These consist of automotive applications, medical applications, industrial and commercial applications (vapor, humidity, temperature, and mass sensors). Bulk Acoustic resonators and filters are expansively used in radiofrequency, front-end filtering at UHF frequencies. Their small size, good quality power handling capabilities, and high-class factors make them ideal for applications. As automobile sectors started to acquire more digital capabilities, they are depending on a rising number of wireless technologies to communicate with the external world. Besides, many vehicles have implemented maintain of LTE data connections and function as small Wi-Fi hotspots. In the upcoming years, the long-planned goal of vehicle-to-vehicle and vehicle-to-infrastructure communications is finally expected to become a reality with the usage of higher-frequency bands.
Restraint:
Higher cost of bulk acoustic wave sensors in the market
With the broad explosion of 4G LTE and wireless networks around the globe, the innovative wave spectrum is required to handle the immense wireless traffic. Acoustic sensors usually distribute better-quality performance with lower insertion loss at higher frequency levels. However, the cost of acoustic sensors is superior compared to other acoustic sensors such as SAW (Surface Acoustic sensor). And the expensive nature of the acoustic sensors is hindering the market's growth to a certain extent.
Opportunity:
Rising demand for acoustic sensor technology in 5G infrastructure
Acoustic Sensors technology is used to construct an innovative generation of radio frequency filters due to the higher frequencies and broader bandwidths associated with 5G. These filters are piezoelectric-based acoustic resonators in which the characteristics of a slight film piezoelectric material control the frequency and bandwidth of the filter. The film's thickness, the piezoelectric element's geometry, and characteristics of the accompanying electrodes play a role in determining the band-pass frequency of the RF filter in BAW devices. Due to the band-pass frequency's reliance on film thickness, BAW devices can filter frequencies higher than conventional surface acoustic wave (SAW) RF filters. The global rollout of 5G and the rapid expansion of the Internet of Things is creating significant challenges in RF filtering technologies. Many market players have recently introduced BAW filters for 5G enabled front-end modules for better performance and higher reliability.
Threat:
Cumulative growth analysis
The acoustic wave sensor market is witnessing a stable stream of demand during the forecast period. The high requirement of acoustic wave sensor material in the surface acoustic wave market enables more growth. However, certain restraints will hamper the growth. The high cost, sensitivity and compact size of acoustic wave technology sensors are significant issues in this market. Therefore, the overall growth seems consistent with some restrictions.
Covid-19 Impact
The global Acoustic Sensors market cautiously examine the difference in the global outlook owed to COVID - 19 taking into account its contact on supply chain, economy, and consumer preferences by country and region. The report identifies competitive strategies being implemented and planned by key companies in the Acoustic Sensors market to counter adverse effects and take advantage of the new opportunities created by the pandemic situation. Different scenarios based on expected containment of the virus in the medium to long term are considered to provide Acoustic Sensors market forecasts. The recent COVID-19 outbreak first began in Wuhan (China) in December 2019, and since then, it has spread around the globe at a fast pace. China, Italy, Iran, Spain, the Republic of Korea, France, Germany, and the US are among the worst-affected countries in terms of positive cases and reported deaths, as of March 2020. The COVID-19 outbreak has affected economies and industries in various countries due to lockdowns, travel bans, and business shutdowns. The global food and beverage industry is one of the major industries facing serious disruptions such as supply chain breaks, technology events cancellations, and office shutdowns as a result of this outbreak.
The Surface Wave Sensors segment is expected to have the highest CAGR during the forecast period
Surface acoustic wave (SAW) sensors are used to sense the incidence of any alteration in frequency of a variety of parameters such as temperature, pressure, torque, chemical vapors, etc. When the acoustic wave produced due to these parameters are subjected to pass corresponding to the piezoelectric substrate of SAW sensor from one electrode to another electrode. The disparity in their frequency, velocity and attenuation of the SAW is sensed by the molecules present in the substrate coating. Therefore, SAW sensors are used to sense and specify the change in the concentration of a specific chemical in the environment.
The food type segment is expected to be the largest during the forecast period
Acoustic respiration sensors permit healthcare providers and clinicians to keep an eye on patient's breathing instantaneously. It is a non-insidious technology that aids in the early recognition of respiratory suffering in patients. This technology employs novel adhesive sensors with an acoustic transducer, allowing for continuous monitoring of breathing patterns. The product is helpful for identifying rising respiratory disorders and providing patients with prompt therapeutic responses to reduce the risk of dangerous respiratory events. Growing demand for non-invasive technology devices is likely to open various avenues of expansion in the market in the approaching period.
Region with highest share:
In acoustic sensor market, North America is anticipated to hold the largest market share in the during the forecast period. Technological advancements, low manufacturing cost, and wireless and passive nature of the products are the main drivers of the beneficial growth of acoustic wave sensors. The use of acoustic wave sensors in military segment is a key feature dependable for the growth of the region. The US military runs laboratories to provide superior technologies to its militants. The automotive industry is a most important development driver of the acoustic wave sensor in North American region.
Region with highest CAGR:
The Asia Pacific is expected to control the global acoustic market owing to the extensive adoption of acoustic sensor products in the automotive and consumer electronics industry. Developing countries are expected to hold the largest CAGR in the acoustic sensor market in the Asia Pacific region. In addition, the rising countries in the Asia Pacific are expected to generate lucrative growth opportunities for the manufacturers. This factor is proposed to drive the growth of the acoustic sensor market. Asia Pacific region is expected to be the fastest growing global acoustic sensor market and primarily due to an increase in the application of acoustic sensor in smart phones and smart watch in the consumer.

Key players in the market
Some of the key players in this Market are Pro-Micron GmbH & Co. Kg, Cognizant Corporation, Panasonic, Honeywell Sensing & Control, Boston Piezo-optics Inc., Kyocera, Campbell Scientific, Inc., Vectron International Inc., Siemens Process Instrumentation, Halliburton, IFM Efector, Inc., TDK Corporation, SENSeOR SAS, Raltron, Dytran Instruments, Inc., Hubbell Lighting, Murata Manufacturing Co. Ltd, Schlumberger.
Key Developments:
In April 2016,sensor consented to an organization arrangement with Clere Electronics Limited (UK) to circulate SENSeOR's remote aloof SAW sensors and observe answers for applications in energy and the modern area.
In April 2016, SENSeOR signed a partnership agreement with Clere Electronics Limited (UK), for distributing SENSeOR’s wireless passive SAW sensors and its monitoring solutions for applications in energy and the industrial sector.
Wave Types Covered:
• Surface Wave Sensors (SWS)
• Bulk Wave Sensors (BWS)
Sensing Parameter Covered:
• Chemical Vapour
• Torque
• Temperature
• Viscosity
• Pressure
• Humidity
• Mass
• Other Sensing Parameters
Application Covered:
• Industrial
• Consumer Electronics
• Automotive
• Healthcare
• Aerospace & Defense
• IT & Telecommunication
• Other Applications
Regions Covered:
• North America
o US
o Canada
o Mexico
• Europe
o Germany
o UK
o Italy
o France
o Spain
o Rest of Europe
• Asia Pacific
o Japan
o China
o India
o Australia
o New Zealand
o South Korea
o Rest of Asia Pacific
• South America
o Argentina
o Brazil
o Chile
o Rest of South America
• Middle East & Africa
o Saudi Arabia
o UAE
o Qatar
o South Africa
o Rest of Middle East & Africa
What our report offers:
- Market share assessments for the regional and country-level segments
- Strategic recommendations for the new entrants
- Covers Market data for the years 2020, 2021, 2022, 2025, and 2028
- Market Trends (Drivers, Constraints, Opportunities, Threats, Challenges, Investment Opportunities, and recommendations)
- Strategic recommendations in key business segments based on the market estimations
- Competitive landscaping mapping the key common trends
- Company profiling with detailed strategies, financials, and recent developments
- Supply chain trends mapping the latest technological advancements
Free Customization Offerings:
All the customers of this report will be entitled to receive one of the following free customization options:
• Company Profiling
o Comprehensive profiling of additional market players (up to 3)
o SWOT Analysis of key players (up to 3)
• Regional Segmentation
o Market estimations, Forecasts and CAGR of any prominent country as per the client's interest (Note: Depends on feasibility check)
• Competitive Benchmarking
o Benchmarking of key players based on product portfolio, geographical presence, and strategic alliances
Table of Contents
1 Executive Summary
2 Preface
2.1 Abstract
2.2 Stake Holders
2.3 Research Scope
2.4 Research Methodology
2.4.1 Data Mining
2.4.2 Data Analysis
2.4.3 Data Validation
2.4.4 Research Approach
2.5 Research Sources
2.5.1 Primary Research Sources
2.5.2 Secondary Research Sources
2.5.3 Assumptions
3 Market Trend Analysis
3.1 Introduction
3.2 Drivers
3.3 Restraints
3.4 Opportunities
3.5 Threats
3.6 Application Analysis
3.7 Emerging Markets
3.8 Impact of Covid-19
4 Porters Five Force Analysis
4.1 Bargaining power of suppliers
4.2 Bargaining power of buyers
4.3 Threat of substitutes
4.4 Threat of new entrants
4.5 Competitive rivalry
5 Global Acoustic Sensors Market, By Wave Type
5.1 Introduction
5.2 Surface Wave Sensors (SWS)
5.3 Bulk Wave Sensors (BWS)
6 Global Acoustic Sensors Market, By Type
6.1 Introduction
6.2 Wireless
6.3 Wired
7 Global Acoustic Sensors Market, By Sensing Parameter
7.1 Introduction
7.2 Chemical Vapour
7.3 Torque
7.4 Temperature
7.5 Viscosity
7.6 Pressure
7.7 Humidity
7.8 Mass
7.9 Other Sensing Parameters
8 Global Acoustic Sensors Market, By Application
8.1 Introduction
8.2 Industrial
8.3 Consumer Electronics
8.4 Automotive
8.5 Healthcare
8.6 Aerospace & Defense
8.7 IT & Telecommunication
8.8 Other Applications
9 Global Acoustic Sensors Market, By Geography
9.1 Introduction
9.2 North America
9.2.1 US
9.2.2 Canada
9.2.3 Mexico
9.3 Europe
9.3.1 Germany
9.3.2 UK
9.3.3 Italy
9.3.4 France
9.3.5 Spain
9.3.6 Rest of Europe
9.4 Asia Pacific
9.4.1 Japan
9.4.2 China
9.4.3 India
9.4.4 Australia
9.4.5 New Zealand
9.4.6 South Korea
9.4.7 Rest of Asia Pacific
9.5 South America
9.5.1 Argentina
9.5.2 Brazil
9.5.3 Chile
9.5.4 Rest of South America
9.6 Middle East & Africa
9.6.1 Saudi Arabia
9.6.2 UAE
9.6.3 Qatar
9.6.4 South Africa
9.6.5 Rest of Middle East & Africa
10 Key Developments
10.1 Agreements, Partnerships, Collaborations and Joint Ventures
10.2 Acquisitions & Mergers
10.3 New Product Launch
10.4 Expansions
10.5 Other Key Strategies
11 Company Profiling
11.1 Pro-Micron GmbH & Co. Kg
11.2 Cognizant Corporation
11.3 Panasonic
11.4 Honeywell Sensing & Control
11.5 Boston Piezo-optics Inc.
11.6 Kyocera
11.7 Campbell Scientific, Inc.
11.8 Vectron International Inc.
11.9 Siemens Process Instrumentation
11.10 Halliburton
11.11 IFM Efector, Inc.
11.12 TDK Corporation
11.13 SENSeOR SAS
11.14 Raltron
11.15 Dytran Instruments, Inc.
11.16 Hubbell Lighting
11.17 Murata Manufacturing Co. Ltd
11.18 Schlumberger
List of Tables
1 Global Acoustic Sensors Market Outlook, By Region (2020-2028) (US $MN)
2 Global Acoustic Sensors Market Outlook, By Wave Type (2020-2028) (US $MN)
3 Global Acoustic Sensors Market Outlook, By Surface Wave Sensors (SWS) (2020-2028) (US $MN)
4 Global Acoustic Sensors Market Outlook, By Bulk Wave Sensors (BWS) (2020-2028) (US $MN)
5 Global Acoustic Sensors Market Outlook, By Type (2020-2028) (US $MN)
6 Global Acoustic Sensors Market Outlook, By Wireless (2020-2028) (US $MN)
7 Global Acoustic Sensors Market Outlook, By Wired (2020-2028) (US $MN)
8 Global Acoustic Sensors Market Outlook, By Sensing Parameter (2020-2028) (US $MN)
9 Global Acoustic Sensors Market Outlook, By Chemical Vapour (2020-2028) (US $MN)
10 Global Acoustic Sensors Market Outlook, By Torque (2020-2028) (US $MN)
11 Global Acoustic Sensors Market Outlook, By Temperature (2020-2028) (US $MN)
12 Global Acoustic Sensors Market Outlook, By Viscosity (2020-2028) (US $MN)
13 Global Acoustic Sensors Market Outlook, By Pressure (2020-2028) (US $MN)
14 Global Acoustic Sensors Market Outlook, By Humidity (2020-2028) (US $MN)
15 Global Acoustic Sensors Market Outlook, By Mass (2020-2028) (US $MN)
16 Global Acoustic Sensors Market Outlook, By Other Sensing Parameters (2020-2028) (US $MN)
17 Global Acoustic Sensors Market Outlook, By Application (2020-2028) (US $MN)
18 Global Acoustic Sensors Market Outlook, By Industrial (2020-2028) (US $MN)
19 Global Acoustic Sensors Market Outlook, By Consumer Electronics (2020-2028) (US $MN)
20 Global Acoustic Sensors Market Outlook, By Automotive (2020-2028) (US $MN)
21 Global Acoustic Sensors Market Outlook, By Healthcare (2020-2028) (US $MN)
22 Global Acoustic Sensors Market Outlook, By Aerospace & Defense (2020-2028) (US $MN)
23 Global Acoustic Sensors Market Outlook, By IT & Telecommunication (2020-2028) (US $MN)
24 Global Acoustic Sensors Market Outlook, By Other Applications (2020-2028) (US $MN)
25 North America Acoustic Sensors Market Outlook, By Country (2020-2028) (US $MN)
26 North America Acoustic Sensors Market Outlook, By Wave Type (2020-2028) (US $MN)
27 North America Acoustic Sensors Market Outlook, By Surface Wave Sensors (SWS) (2020-2028) (US $MN)
28 North America Acoustic Sensors Market Outlook, By Bulk Wave Sensors (BWS) (2020-2028) (US $MN)
29 North America Acoustic Sensors Market Outlook, By Type (2020-2028) (US $MN)
30 North America Acoustic Sensors Market Outlook, By Wireless (2020-2028) (US $MN)
31 North America Acoustic Sensors Market Outlook, By Wired (2020-2028) (US $MN)
32 North America Acoustic Sensors Market Outlook, By Sensing Parameter (2020-2028) (US $MN)
33 North America Acoustic Sensors Market Outlook, By Chemical Vapour (2020-2028) (US $MN)
34 North America Acoustic Sensors Market Outlook, By Torque (2020-2028) (US $MN)
35 North America Acoustic Sensors Market Outlook, By Temperature (2020-2028) (US $MN)
36 North America Acoustic Sensors Market Outlook, By Viscosity (2020-2028) (US $MN)
37 North America Acoustic Sensors Market Outlook, By Pressure (2020-2028) (US $MN)
38 North America Acoustic Sensors Market Outlook, By Humidity (2020-2028) (US $MN)
39 North America Acoustic Sensors Market Outlook, By Mass (2020-2028) (US $MN)
40 North America Acoustic Sensors Market Outlook, By Other Sensing Parameters (2020-2028) (US $MN)
41 North America Acoustic Sensors Market Outlook, By Application (2020-2028) (US $MN)
42 North America Acoustic Sensors Market Outlook, By Industrial (2020-2028) (US $MN)
43 North America Acoustic Sensors Market Outlook, By Consumer Electronics (2020-2028) (US $MN)
44 North America Acoustic Sensors Market Outlook, By Automotive (2020-2028) (US $MN)
45 North America Acoustic Sensors Market Outlook, By Healthcare (2020-2028) (US $MN)
46 North America Acoustic Sensors Market Outlook, By Aerospace & Defense (2020-2028) (US $MN)
47 North America Acoustic Sensors Market Outlook, By IT & Telecommunication (2020-2028) (US $MN)
48 North America Acoustic Sensors Market Outlook, By Other Applications (2020-2028) (US $MN)
49 Europe Acoustic Sensors Market Outlook, By Country (2020-2028) (US $MN)
50 Europe Acoustic Sensors Market Outlook, By Wave Type (2020-2028) (US $MN)
51 Europe Acoustic Sensors Market Outlook, By Surface Wave Sensors (SWS) (2020-2028) (US $MN)
52 Europe Acoustic Sensors Market Outlook, By Bulk Wave Sensors (BWS) (2020-2028) (US $MN)
53 Europe Acoustic Sensors Market Outlook, By Type (2020-2028) (US $MN)
54 Europe Acoustic Sensors Market Outlook, By Wireless (2020-2028) (US $MN)
55 Europe Acoustic Sensors Market Outlook, By Wired (2020-2028) (US $MN)
56 Europe Acoustic Sensors Market Outlook, By Sensing Parameter (2020-2028) (US $MN)
57 Europe Acoustic Sensors Market Outlook, By Chemical Vapour (2020-2028) (US $MN)
58 Europe Acoustic Sensors Market Outlook, By Torque (2020-2028) (US $MN)
59 Europe Acoustic Sensors Market Outlook, By Temperature (2020-2028) (US $MN)
60 Europe Acoustic Sensors Market Outlook, By Viscosity (2020-2028) (US $MN)
61 Europe Acoustic Sensors Market Outlook, By Pressure (2020-2028) (US $MN)
62 Europe Acoustic Sensors Market Outlook, By Humidity (2020-2028) (US $MN)
63 Europe Acoustic Sensors Market Outlook, By Mass (2020-2028) (US $MN)
64 Europe Acoustic Sensors Market Outlook, By Other Sensing Parameters (2020-2028) (US $MN)
65 Europe Acoustic Sensors Market Outlook, By Application (2020-2028) (US $MN)
66 Europe Acoustic Sensors Market Outlook, By Industrial (2020-2028) (US $MN)
67 Europe Acoustic Sensors Market Outlook, By Consumer Electronics (2020-2028) (US $MN)
68 Europe Acoustic Sensors Market Outlook, By Automotive (2020-2028) (US $MN)
69 Europe Acoustic Sensors Market Outlook, By Healthcare (2020-2028) (US $MN)
70 Europe Acoustic Sensors Market Outlook, By Aerospace & Defense (2020-2028) (US $MN)
71 Europe Acoustic Sensors Market Outlook, By IT & Telecommunication (2020-2028) (US $MN)
72 Europe Acoustic Sensors Market Outlook, By Other Applications (2020-2028) (US $MN)
73 Asia Pacific Acoustic Sensors Market Outlook, By Country (2020-2028) (US $MN)
74 Asia Pacific Acoustic Sensors Market Outlook, By Wave Type (2020-2028) (US $MN)
75 Asia Pacific Acoustic Sensors Market Outlook, By Surface Wave Sensors (SWS) (2020-2028) (US $MN)
76 Asia Pacific Acoustic Sensors Market Outlook, By Bulk Wave Sensors (BWS) (2020-2028) (US $MN)
77 Asia Pacific Acoustic Sensors Market Outlook, By Type (2020-2028) (US $MN)
78 Asia Pacific Acoustic Sensors Market Outlook, By Wireless (2020-2028) (US $MN)
79 Asia Pacific Acoustic Sensors Market Outlook, By Wired (2020-2028) (US $MN)
80 Asia Pacific Acoustic Sensors Market Outlook, By Sensing Parameter (2020-2028) (US $MN)
81 Asia Pacific Acoustic Sensors Market Outlook, By Chemical Vapour (2020-2028) (US $MN)
82 Asia Pacific Acoustic Sensors Market Outlook, By Torque (2020-2028) (US $MN)
83 Asia Pacific Acoustic Sensors Market Outlook, By Temperature (2020-2028) (US $MN)
84 Asia Pacific Acoustic Sensors Market Outlook, By Viscosity (2020-2028) (US $MN)
85 Asia Pacific Acoustic Sensors Market Outlook, By Pressure (2020-2028) (US $MN)
86 Asia Pacific Acoustic Sensors Market Outlook, By Humidity (2020-2028) (US $MN)
87 Asia Pacific Acoustic Sensors Market Outlook, By Mass (2020-2028) (US $MN)
88 Asia Pacific Acoustic Sensors Market Outlook, By Other Sensing Parameters (2020-2028) (US $MN)
89 Asia Pacific Acoustic Sensors Market Outlook, By Application (2020-2028) (US $MN)
90 Asia Pacific Acoustic Sensors Market Outlook, By Industrial (2020-2028) (US $MN)
91 Asia Pacific Acoustic Sensors Market Outlook, By Consumer Electronics (2020-2028) (US $MN)
92 Asia Pacific Acoustic Sensors Market Outlook, By Automotive (2020-2028) (US $MN)
93 Asia Pacific Acoustic Sensors Market Outlook, By Healthcare (2020-2028) (US $MN)
94 Asia Pacific Acoustic Sensors Market Outlook, By Aerospace & Defense (2020-2028) (US $MN)
95 Asia Pacific Acoustic Sensors Market Outlook, By IT & Telecommunication (2020-2028) (US $MN)
96 Asia Pacific Acoustic Sensors Market Outlook, By Other Applications (2020-2028) (US $MN)
97 South America Acoustic Sensors Market Outlook, By Country (2020-2028) (US $MN)
98 South America Acoustic Sensors Market Outlook, By Wave Type (2020-2028) (US $MN)
99 South America Acoustic Sensors Market Outlook, By Surface Wave Sensors (SWS) (2020-2028) (US $MN)
100 South America Acoustic Sensors Market Outlook, By Bulk Wave Sensors (BWS) (2020-2028) (US $MN)
101 South America Acoustic Sensors Market Outlook, By Type (2020-2028) (US $MN)
102 South America Acoustic Sensors Market Outlook, By Wireless (2020-2028) (US $MN)
103 South America Acoustic Sensors Market Outlook, By Wired (2020-2028) (US $MN)
104 South America Acoustic Sensors Market Outlook, By Sensing Parameter (2020-2028) (US $MN)
105 South America Acoustic Sensors Market Outlook, By Chemical Vapour (2020-2028) (US $MN)
106 South America Acoustic Sensors Market Outlook, By Torque (2020-2028) (US $MN)
107 South America Acoustic Sensors Market Outlook, By Temperature (2020-2028) (US $MN)
108 South America Acoustic Sensors Market Outlook, By Viscosity (2020-2028) (US $MN)
109 South America Acoustic Sensors Market Outlook, By Pressure (2020-2028) (US $MN)
110 South America Acoustic Sensors Market Outlook, By Humidity (2020-2028) (US $MN)
111 South America Acoustic Sensors Market Outlook, By Mass (2020-2028) (US $MN)
112 South America Acoustic Sensors Market Outlook, By Other Sensing Parameters (2020-2028) (US $MN)
113 South America Acoustic Sensors Market Outlook, By Application (2020-2028) (US $MN)
114 South America Acoustic Sensors Market Outlook, By Industrial (2020-2028) (US $MN)
115 South America Acoustic Sensors Market Outlook, By Consumer Electronics (2020-2028) (US $MN)
116 South America Acoustic Sensors Market Outlook, By Automotive (2020-2028) (US $MN)
117 South America Acoustic Sensors Market Outlook, By Healthcare (2020-2028) (US $MN)
118 South America Acoustic Sensors Market Outlook, By Aerospace & Defense (2020-2028) (US $MN)
119 South America Acoustic Sensors Market Outlook, By IT & Telecommunication (2020-2028) (US $MN)
120 South America Acoustic Sensors Market Outlook, By Other Applications (2020-2028) (US $MN)
121 Middle East & Africa Acoustic Sensors Market Outlook, By Country (2020-2028) (US $MN)
122 Middle East & Africa Acoustic Sensors Market Outlook, By Wave Type (2020-2028) (US $MN)
123 Middle East & Africa Acoustic Sensors Market Outlook, By Surface Wave Sensors (SWS) (2020-2028) (US $MN)
124 Middle East & Africa Acoustic Sensors Market Outlook, By Bulk Wave Sensors (BWS) (2020-2028) (US $MN)
125 Middle East & Africa Acoustic Sensors Market Outlook, By Type (2020-2028) (US $MN)
126 Middle East & Africa Acoustic Sensors Market Outlook, By Wireless (2020-2028) (US $MN)
127 Middle East & Africa Acoustic Sensors Market Outlook, By Wired (2020-2028) (US $MN)
128 Middle East & Africa Acoustic Sensors Market Outlook, By Sensing Parameter (2020-2028) (US $MN)
129 Middle East & Africa Acoustic Sensors Market Outlook, By Chemical Vapour (2020-2028) (US $MN)
130 Middle East & Africa Acoustic Sensors Market Outlook, By Torque (2020-2028) (US $MN)
131 Middle East & Africa Acoustic Sensors Market Outlook, By Temperature (2020-2028) (US $MN)
132 Middle East & Africa Acoustic Sensors Market Outlook, By Viscosity (2020-2028) (US $MN)
133 Middle East & Africa Acoustic Sensors Market Outlook, By Pressure (2020-2028) (US $MN)
134 Middle East & Africa Acoustic Sensors Market Outlook, By Humidity (2020-2028) (US $MN)
135 Middle East & Africa Acoustic Sensors Market Outlook, By Mass (2020-2028) (US $MN)
136 Middle East & Africa Acoustic Sensors Market Outlook, By Other Sensing Parameters (2020-2028) (US $MN)
137 Middle East & Africa Acoustic Sensors Market Outlook, By Application (2020-2028) (US $MN)
138 Middle East & Africa Acoustic Sensors Market Outlook, By Industrial (2020-2028) (US $MN)
139 Middle East & Africa Acoustic Sensors Market Outlook, By Consumer Electronics (2020-2028) (US $MN)
140 Middle East & Africa Acoustic Sensors Market Outlook, By Automotive (2020-2028) (US $MN)
141 Middle East & Africa Acoustic Sensors Market Outlook, By Healthcare (2020-2028) (US $MN)
142 Middle East & Africa Acoustic Sensors Market Outlook, By Aerospace & Defense (2020-2028) (US $MN)
143 Middle East & Africa Acoustic Sensors Market Outlook, By IT & Telecommunication (2020-2028) (US $MN)
144 Middle East & Africa Acoustic Sensors Market Outlook, By Other Applications (2020-2028) (US $MN)
List of Figures
RESEARCH METHODOLOGY

We at ‘Stratistics’ opt for an extensive research approach which involves data mining, data validation, and data analysis. The various research sources include in-house repository, secondary research, competitor’s sources, social media research, client internal data, and primary research.
Our team of analysts prefers the most reliable and authenticated data sources in order to perform the comprehensive literature search. With access to most of the authenticated data bases our team highly considers the best mix of information through various sources to obtain extensive and accurate analysis.
Each report takes an average time of a month and a team of 4 industry analysts. The time may vary depending on the scope and data availability of the desired market report. The various parameters used in the market assessment are standardized in order to enhance the data accuracy.
Data Mining
The data is collected from several authenticated, reliable, paid and unpaid sources and is filtered depending on the scope & objective of the research. Our reports repository acts as an added advantage in this procedure. Data gathering from the raw material suppliers, distributors and the manufacturers is performed on a regular basis, this helps in the comprehensive understanding of the products value chain. Apart from the above mentioned sources the data is also collected from the industry consultants to ensure the objective of the study is in the right direction.
Market trends such as technological advancements, regulatory affairs, market dynamics (Drivers, Restraints, Opportunities and Challenges) are obtained from scientific journals, market related national & international associations and organizations.
Data Analysis
From the data that is collected depending on the scope & objective of the research the data is subjected for the analysis. The critical steps that we follow for the data analysis include:
- Product Lifecycle Analysis
- Competitor analysis
- Risk analysis
- Porters Analysis
- PESTEL Analysis
- SWOT Analysis
The data engineering is performed by the core industry experts considering both the Marketing Mix Modeling and the Demand Forecasting. The marketing mix modeling makes use of multiple-regression techniques to predict the optimal mix of marketing variables. Regression factor is based on a number of variables and how they relate to an outcome such as sales or profits.
Data Validation
The data validation is performed by the exhaustive primary research from the expert interviews. This includes telephonic interviews, focus groups, face to face interviews, and questionnaires to validate our research from all aspects. The industry experts we approach come from the leading firms, involved in the supply chain ranging from the suppliers, distributors to the manufacturers and consumers so as to ensure an unbiased analysis.
We are in touch with more than 15,000 industry experts with the right mix of consultants, CEO's, presidents, vice presidents, managers, experts from both supply side and demand side, executives and so on.
The data validation involves the primary research from the industry experts belonging to:
- Leading Companies
- Suppliers & Distributors
- Manufacturers
- Consumers
- Industry/Strategic Consultants
Apart from the data validation the primary research also helps in performing the fill gap research, i.e. providing solutions for the unmet needs of the research which helps in enhancing the reports quality.
For more details about research methodology, kindly write to us at info@strategymrc.com
Frequently Asked Questions
In case of any queries regarding this report, you can contact the customer service by filing the “Inquiry Before Buy” form available on the right hand side. You may also contact us through email: info@strategymrc.com or phone: +1-301-202-5929
Yes, the samples are available for all the published reports. You can request them by filling the “Request Sample” option available in this page.
Yes, you can request a sample with your specific requirements. All the customized samples will be provided as per the requirement with the real data masked.
All our reports are available in Digital PDF format. In case if you require them in any other formats, such as PPT, Excel etc you can submit a request through “Inquiry Before Buy” form available on the right hand side. You may also contact us through email: info@strategymrc.com or phone: +1-301-202-5929
We offer a free 15% customization with every purchase. This requirement can be fulfilled for both pre and post sale. You may send your customization requirements through email at info@strategymrc.com or call us on +1-301-202-5929.
We have 3 different licensing options available in electronic format.
- Single User Licence: Allows one person, typically the buyer, to have access to the ordered product. The ordered product cannot be distributed to anyone else.
- 2-5 User Licence: Allows the ordered product to be shared among a maximum of 5 people within your organisation.
- Corporate License: Allows the product to be shared among all employees of your organisation regardless of their geographical location.
All our reports are typically be emailed to you as an attachment.
To order any available report you need to register on our website. The payment can be made either through CCAvenue or PayPal payments gateways which accept all international cards.
We extend our support to 6 months post sale. A post sale customization is also provided to cover your unmet needs in the report.
Request Customization
We offer complimentary customization of up to 15% with every purchase. To share your customization requirements, feel free to email us at info@strategymrc.com or call us on +1-301-202-5929. .
Please Note: Customization within the 15% threshold is entirely free of charge. If your request exceeds this limit, we will conduct a feasibility assessment. Following that, a detailed quote and timeline will be provided.
WHY CHOOSE US ?

Assured Quality
Best in class reports with high standard of research integrity

24X7 Research Support
Continuous support to ensure the best customer experience.

Free Customization
Adding more values to your product of interest.

Safe & Secure Access
Providing a secured environment for all online transactions.

Trusted by 600+ Brands
Serving the most reputed brands across the world.