
Aerotropolis Market
Aerotropolis Market Forecasts to 2028 – Global Analysis By Type (Greenfield Airport Aerotropolis, Brownfield Airport Aerotropolis), Application (Passenger Flow, Logistics), and By Geography

|
Years Covered |
2020-2028 |
|
Estimated Year Value (2021) |
US $413.64 MN |
|
Projected Year Value (2028) |
US $858.77 MN |
|
CAGR (2021 - 2028) |
11.0% |
|
Regions Covered |
North America, Europe, Asia Pacific, South America, and Middle East & Africa |
|
Countries Covered |
US, Canada, Mexico, Germany, UK, Italy, France, Spain, Japan, China, India, Australia, New Zealand, South Korea, Rest of Asia Pacific, South America, Argentina, Brazil, Chile, Middle East & Africa, Saudi Arabia, UAE, Qatar, and South Africa |
|
Largest Market |
Asia Pacific |
|
Highest Growing Market |
Middle East & Africa |
According to Stratistics MRC, the Global Aerotropolis Market is accounted for $413.64 million in 2021 and is expected to reach $858.77 million by 2028 growing at a CAGR of 11.0% during the forecast period. An aerotropolis is a metropolitan area in which the layout, economy, and infrastructure are centered on an airport, which serves as the airport city. Aerotropolis is like metro cities, which contain a core commercial city and transport linked suburbs. An aerotropolis has all the major facilities of a metropolis, such as medical facility, offices and hotels, IT sectors, retail and wholesale merchandize marts along with an airport.
Market Dynamics:
Driver:
Passenger experience enhancement
The major driving factor of the aerotropolis market is passenger experience enhancement. Airport authorities are constantly focusing on enhancing passenger experience with reliable operations at airport terminals. The aerotropolis offers passengers various options to engage in during their travel wait time such as attending official meetings, hospital facilities, and shopping among others. These features of an aerotropolis that help passengers to meet their requirements during their travel wait time, will lead to rapid adoption of the aerotropolis across the globe. The significant evolution of airports during the last few years, from passenger transport hubs to sophisticated commercial operations, and the considerable increase in air travel and air freight are the main reasons behind the rising focus on aerotropolis.
Restraint:
High cost of infrastructure
The growth of the aerotropolis market is limited by the infrastructure cost. An aerotropolis is similar to a metropolitan city which has infrastructure such as airport, residential areas, hospitals, offices, and hotels. The cost involved in building this infrastructure is exorbitant, which is limiting construction companies as well as different airport authorities from opting for the new aerotropolis infrastructure. This in turn is inhibiting the aerotropolis market from expanding over the years.
Opportunity:
Development of smart cities
The development of smart cities around an airport is poised to bolster the aerotropolis market in the coming years. It has been noted that the development of airport centered smart cities which have increased connectivity with large, efficient, and well networked airports have gained interest among construction companies. This is leading to adoption of new technologies at a rapid rate in order to provide passengers with enhanced experiences as well as help business hubs to grow. Rapid adoption of aerotropolis systems is anticipated to expand the aerotropolis market in the coming years.
Threat:
Challenges with airport construction
An airport city is going to be major attractions to kick start an economy that would further expand opportunities for new & existing employment, tourism and infrastructure. Developing aerotropolis city has lot of challenges to face. High scale design and development is highly risky, as the plan could go wrong at some point. Airport construction also has major challenges such as the growth of hazards to keep pace with developments, noise pollution, height restriction & efficient connectivity. Nevertheless, today, the new technologies are focused on these issues that will help solve these problems in the coming future.
The greenfield airport aerotropolis segment is expected to be the largest during the forecast period
The greenfield airport aerotropolis segment is estimated to have a lucrative growth. The greenfield airport aerotropolis market accounted for maximum share due to the rapid increase in air traffic across the globe and surging demand for air travel. Owing to this, airport authorities are constantly focusing on enhancing non-aeronautical revenues by offering passengers with better value added services even during their wait. Owing to the fact that, the construction companies along with airport authorities opt to build their own airport infrastructure rather than purchasing or leasing an existing area, and construct it as per their requirements, the greenfield airport aerotropolis are the most demanding types in the recent years and is anticipated to witness substantial growth in the coming years.
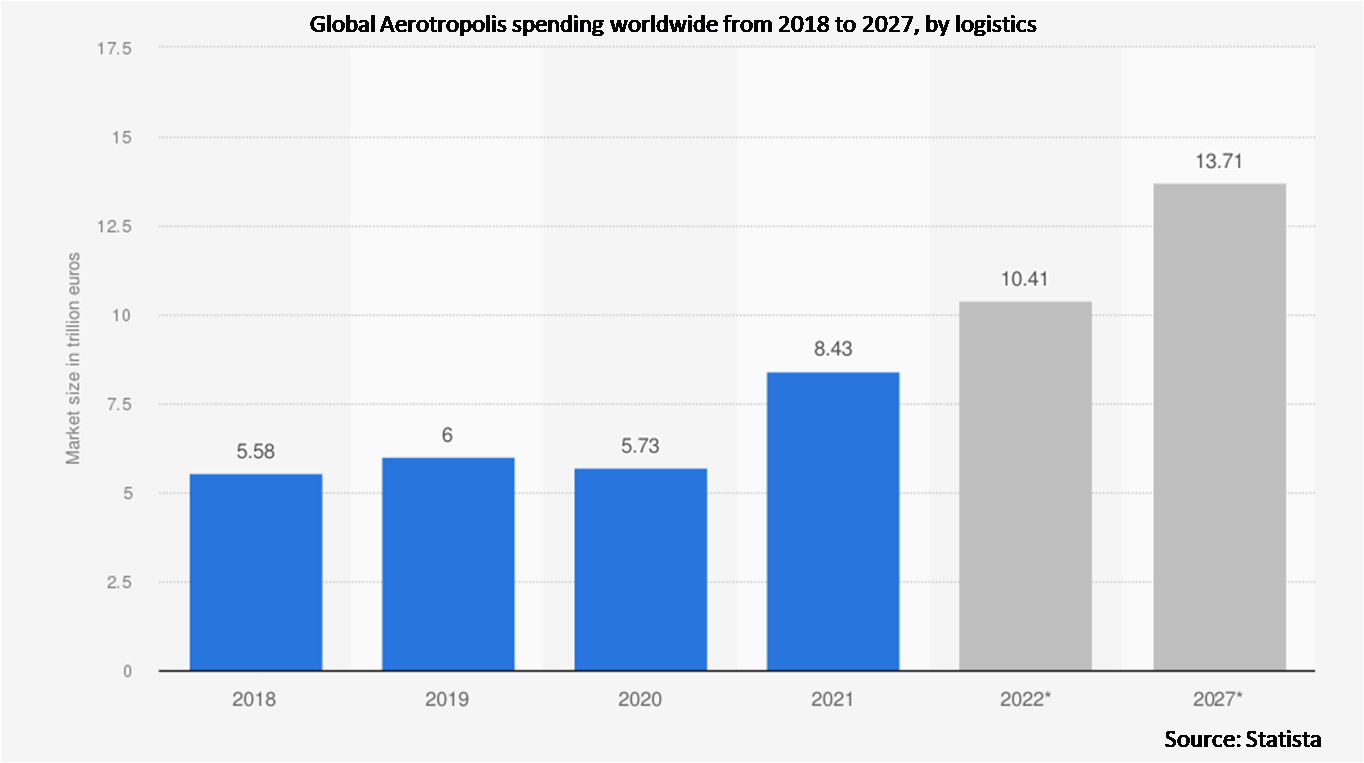
The logistics segment is expected to have the highest CAGR during the forecast period
The logistics segment is anticipated to witness the fastest CAGR growth during the forecast period. An aerotropolis usually has a core airport area, which provides logistics and transportation services. The aerotropolis model has emphasized how a range of logistics-and aviation-related companies and businesses with high propensities to ship by air have increasingly tended to cluster around airports and airport corridors, presumably to take advantage of the elevated accessibility to these airport facilities and related cargo traffic. For instance, the ZAEZ is the first pilot of the comprehensive aviation hub, high-speed railway, inter-city railway, subway, and highway to realize the seamless connection of railway, road, and aviation in China. From the beginning, the mission of the ZAEZ has been to cultivate an aerotropolis and promote the integration of industries.
Region with highest share:
Asia Pacific is projected to hold the largest market share during the forecast period. The growth can be credited to aggressive efforts by various countries, most notably China, to promote airport cities and aerotropolis. The region is witnessing ongoing work on several projects along with announcement of ambitious plans across countries. The decision of increasing number of airports to join the aerotropolis momentum is poised to further cement the position of Asia-Pacific region in airport-linked industrial and commercial development projects. China remains the frontrunner in the aerotropolis race in Asia-Pacific region and globally, with over 100 airports in the country embracing the aerotropolis model and principles.
Region with highest CAGR:
Middle East & Africa is projected to have the highest CAGR over the forecast period. Owing to the growing passenger traffic, airport operators in this region are focusing on the development of aerotropolis around airports to generate significant non-aeronautical revenue. Additionally, the governments in this region are also focusing on the development of channelized free zones and industrial and economic zones to enhance the value-added services provided to people of various demographics and generate higher revenue.

Key players in the market
Some of the key players profiled in the Aerotropolis Market include Austin Industries Inc, Balfour Beatty PLC, Clark Construction Group, LLC, HENSEL PHELPS, Manhattan Construction Company, McCarthy Building Companies, Inc., Skanska AB, The Walsh Group Ltd., Turner Construction Company, and The Whiting-Turner Contracting Company.
Key Developments:
In September 2021, Turner Construction Company announced that the company has signed a multi-year enterprise agreement with San Francisco-based construction technology provider Versatile to expand the use of its AI-powered CraneView® solution on Turner projects.
In October 2021, Austin Industrial announced the acquisition of the company’s headquarters campus in La Porte, TX, which includes a 47,000 square foot office building and an adjacent 15,000 square foot fabrication shop. The facility has served as the company’s base of operations since 2011.
Types Covered:
• Greenfield Airport Aerotropolis
• Brownfield Airport Aerotropolis
Applications Covered:
• Passenger Flow
• Logistics
Regions Covered:
• North America
o US
o Canada
o Mexico
• Europe
o Germany
o UK
o Italy
o France
o Spain
o Rest of Europe
• Asia Pacific
o Japan
o China
o India
o Australia
o New Zealand
o South Korea
o Rest of Asia Pacific
• South America
o Argentina
o Brazil
o Chile
o Rest of South America
• Middle East & Africa
o Saudi Arabia
o UAE
o Qatar
o South Africa
o Rest of Middle East & Africa
What our report offers:
- Market share assessments for the regional and country-level segments
- Strategic recommendations for the new entrants
- Covers Market data for the years 2020, 2021, 2022, 2025, and 2028
- Market Trends (Drivers, Constraints, Opportunities, Threats, Challenges, Investment Opportunities, and recommendations)
- Strategic recommendations in key business segments based on the market estimations
- Competitive landscaping mapping the key common trends
- Company profiling with detailed strategies, financials, and recent developments
- Supply chain trends mapping the latest technological advancements
Free Customization Offerings:
All the customers of this report will be entitled to receive one of the following free customization options:
• Company Profiling
o Comprehensive profiling of additional market players (up to 3)
o SWOT Analysis of key players (up to 3)
• Regional Segmentation
o Market estimations, Forecasts and CAGR of any prominent country as per the client's interest (Note: Depends on feasibility check)
• Competitive Benchmarking
o Benchmarking of key players based on product portfolio, geographical presence, and strategic alliances
Table of Contents
1 Executive Summary
2 Preface
2.1 Abstract
2.2 Stake Holders
2.3 Research Scope
2.4 Research Methodology
2.4.1 Data Mining
2.4.2 Data Analysis
2.4.3 Data Validation
2.4.4 Research Approach
2.5 Research Sources
2.5.1 Primary Research Sources
2.5.2 Secondary Research Sources
2.5.3 Assumptions
3 Market Trend Analysis
3.1 Introduction
3.2 Drivers
3.3 Restraints
3.4 Opportunities
3.5 Threats
3.6 Application Analysis
3.7 Emerging Markets
3.8 Impact of Covid-19
4 Porters Five Force Analysis
4.1 Bargaining power of suppliers
4.2 Bargaining power of buyers
4.3 Threat of substitutes
4.4 Threat of new entrants
4.5 Competitive rivalry
5 Global Aerotropolis Market, By Type
5.1 Introduction
5.2 Greenfield Airport Aerotropolis
5.3 Brownfield Airport Aerotropolis
6 Global Aerotropolis Market, By Application
6.1 Introduction
6.2 Passenger Flow
6.3 Logistics
7 Global Aerotropolis Market, By Geography
7.1 Introduction
7.2 North America
7.2.1 US
7.2.2 Canada
7.2.3 Mexico
7.3 Europe
7.3.1 Germany
7.3.2 UK
7.3.3 Italy
7.3.4 France
7.3.5 Spain
7.3.6 Rest of Europe
7.4 Asia Pacific
7.4.1 Japan
7.4.2 China
7.4.3 India
7.4.4 Australia
7.4.5 New Zealand
7.4.6 South Korea
7.4.7 Rest of Asia Pacific
7.5 South America
7.5.1 Argentina
7.5.2 Brazil
7.5.3 Chile
7.5.4 Rest of South America
7.6 Middle East & Africa
7.6.1 Saudi Arabia
7.6.2 UAE
7.6.3 Qatar
7.6.4 South Africa
7.6.5 Rest of Middle East & Africa
8 Key Developments
8.1 Agreements, Partnerships, Collaborations and Joint Ventures
8.2 Acquisitions & Mergers
8.3 New Product Launch
8.4 Expansions
8.5 Other Key Strategies
9 Company Profiling
9.1 Austin Industries Inc.
9.2 Balfour Beatty PLC
9.3 Clark Construction Group, LLC
9.4 HENSEL PHELPS
9.5 Manhattan Construction Company
9.6 McCarthy Building Companies, Inc.
9.7 Skanska AB
9.8 The Walsh Group Ltd.
9.9 Turner Construction Company
9.10 The Whiting-Turner Contracting Company
List of Tables
1 Global Aerotropolis Market Outlook, By Region (2020-2028) ($MN)
2 Global Aerotropolis Market Outlook, By Type (2020-2028) ($MN)
3 Global Aerotropolis Market Outlook, By Greenfield Airport Aerotropolis (2020-2028) ($MN)
4 Global Aerotropolis Market Outlook, By Brownfield Airport Aerotropolis (2020-2028) ($MN)
5 Global Aerotropolis Market Outlook, By Application (2020-2028) ($MN)
6 Global Aerotropolis Market Outlook, By Passenger Flow (2020-2028) ($MN)
7 Global Aerotropolis Market Outlook, By Logistics (2020-2028) ($MN)
8 North America Aerotropolis Market Outlook, By Country (2020-2028) ($MN)
9 North America Aerotropolis Market Outlook, By Type (2020-2028) ($MN)
10 North America Aerotropolis Market Outlook, By Greenfield Airport Aerotropolis (2020-2028) ($MN)
11 North America Aerotropolis Market Outlook, By Brownfield Airport Aerotropolis (2020-2028) ($MN)
12 North America Aerotropolis Market Outlook, By Application (2020-2028) ($MN)
13 North America Aerotropolis Market Outlook, By Passenger Flow (2020-2028) ($MN)
14 North America Aerotropolis Market Outlook, By Logistics (2020-2028) ($MN)
15 Europe Aerotropolis Market Outlook, By Country (2020-2028) ($MN)
16 Europe Aerotropolis Market Outlook, By Type (2020-2028) ($MN)
17 Europe Aerotropolis Market Outlook, By Greenfield Airport Aerotropolis (2020-2028) ($MN)
18 Europe Aerotropolis Market Outlook, By Brownfield Airport Aerotropolis (2020-2028) ($MN)
19 Europe Aerotropolis Market Outlook, By Application (2020-2028) ($MN)
20 Europe Aerotropolis Market Outlook, By Passenger Flow (2020-2028) ($MN)
21 Europe Aerotropolis Market Outlook, By Logistics (2020-2028) ($MN)
22 Asia Pacific Aerotropolis Market Outlook, By Country (2020-2028) ($MN)
23 Asia Pacific Aerotropolis Market Outlook, By Type (2020-2028) ($MN)
24 Asia Pacific Aerotropolis Market Outlook, By Greenfield Airport Aerotropolis (2020-2028) ($MN)
25 Asia Pacific Aerotropolis Market Outlook, By Brownfield Airport Aerotropolis (2020-2028) ($MN)
26 Asia Pacific Aerotropolis Market Outlook, By Application (2020-2028) ($MN)
27 Asia Pacific Aerotropolis Market Outlook, By Passenger Flow (2020-2028) ($MN)
28 Asia Pacific Aerotropolis Market Outlook, By Logistics (2020-2028) ($MN)
29 South America Aerotropolis Market Outlook, By Country (2020-2028) ($MN)
30 South America Aerotropolis Market Outlook, By Type (2020-2028) ($MN)
31 South America Aerotropolis Market Outlook, By Greenfield Airport Aerotropolis (2020-2028) ($MN)
32 South America Aerotropolis Market Outlook, By Brownfield Airport Aerotropolis (2020-2028) ($MN)
33 South America Aerotropolis Market Outlook, By Application (2020-2028) ($MN)
34 South America Aerotropolis Market Outlook, By Passenger Flow (2020-2028) ($MN)
35 South America Aerotropolis Market Outlook, By Logistics (2020-2028) ($MN)
36 Middle East & Africa Aerotropolis Market Outlook, By Country (2020-2028) ($MN)
37 Middle East & Africa Aerotropolis Market Outlook, By Type (2020-2028) ($MN)
38 Middle East & Africa Aerotropolis Market Outlook, By Greenfield Airport Aerotropolis (2020-2028) ($MN)
39 Middle East & Africa Aerotropolis Market Outlook, By Brownfield Airport Aerotropolis (2020-2028) ($MN)
40 Middle East & Africa Aerotropolis Market Outlook, By Application (2020-2028) ($MN)
41 Middle East & Africa Aerotropolis Market Outlook, By Passenger Flow (2020-2028) ($MN)
42 Middle East & Africa Aerotropolis Market Outlook, By Logistics (2020-2028) ($MN)
List of Figures
RESEARCH METHODOLOGY

We at ‘Stratistics’ opt for an extensive research approach which involves data mining, data validation, and data analysis. The various research sources include in-house repository, secondary research, competitor’s sources, social media research, client internal data, and primary research.
Our team of analysts prefers the most reliable and authenticated data sources in order to perform the comprehensive literature search. With access to most of the authenticated data bases our team highly considers the best mix of information through various sources to obtain extensive and accurate analysis.
Each report takes an average time of a month and a team of 4 industry analysts. The time may vary depending on the scope and data availability of the desired market report. The various parameters used in the market assessment are standardized in order to enhance the data accuracy.
Data Mining
The data is collected from several authenticated, reliable, paid and unpaid sources and is filtered depending on the scope & objective of the research. Our reports repository acts as an added advantage in this procedure. Data gathering from the raw material suppliers, distributors and the manufacturers is performed on a regular basis, this helps in the comprehensive understanding of the products value chain. Apart from the above mentioned sources the data is also collected from the industry consultants to ensure the objective of the study is in the right direction.
Market trends such as technological advancements, regulatory affairs, market dynamics (Drivers, Restraints, Opportunities and Challenges) are obtained from scientific journals, market related national & international associations and organizations.
Data Analysis
From the data that is collected depending on the scope & objective of the research the data is subjected for the analysis. The critical steps that we follow for the data analysis include:
- Product Lifecycle Analysis
- Competitor analysis
- Risk analysis
- Porters Analysis
- PESTEL Analysis
- SWOT Analysis
The data engineering is performed by the core industry experts considering both the Marketing Mix Modeling and the Demand Forecasting. The marketing mix modeling makes use of multiple-regression techniques to predict the optimal mix of marketing variables. Regression factor is based on a number of variables and how they relate to an outcome such as sales or profits.
Data Validation
The data validation is performed by the exhaustive primary research from the expert interviews. This includes telephonic interviews, focus groups, face to face interviews, and questionnaires to validate our research from all aspects. The industry experts we approach come from the leading firms, involved in the supply chain ranging from the suppliers, distributors to the manufacturers and consumers so as to ensure an unbiased analysis.
We are in touch with more than 15,000 industry experts with the right mix of consultants, CEO's, presidents, vice presidents, managers, experts from both supply side and demand side, executives and so on.
The data validation involves the primary research from the industry experts belonging to:
- Leading Companies
- Suppliers & Distributors
- Manufacturers
- Consumers
- Industry/Strategic Consultants
Apart from the data validation the primary research also helps in performing the fill gap research, i.e. providing solutions for the unmet needs of the research which helps in enhancing the reports quality.
For more details about research methodology, kindly write to us at info@strategymrc.com
Frequently Asked Questions
In case of any queries regarding this report, you can contact the customer service by filing the “Inquiry Before Buy” form available on the right hand side. You may also contact us through email: info@strategymrc.com or phone: +1-301-202-5929
Yes, the samples are available for all the published reports. You can request them by filling the “Request Sample” option available in this page.
Yes, you can request a sample with your specific requirements. All the customized samples will be provided as per the requirement with the real data masked.
All our reports are available in Digital PDF format. In case if you require them in any other formats, such as PPT, Excel etc you can submit a request through “Inquiry Before Buy” form available on the right hand side. You may also contact us through email: info@strategymrc.com or phone: +1-301-202-5929
We offer a free 15% customization with every purchase. This requirement can be fulfilled for both pre and post sale. You may send your customization requirements through email at info@strategymrc.com or call us on +1-301-202-5929.
We have 3 different licensing options available in electronic format.
- Single User Licence: Allows one person, typically the buyer, to have access to the ordered product. The ordered product cannot be distributed to anyone else.
- 2-5 User Licence: Allows the ordered product to be shared among a maximum of 5 people within your organisation.
- Corporate License: Allows the product to be shared among all employees of your organisation regardless of their geographical location.
All our reports are typically be emailed to you as an attachment.
To order any available report you need to register on our website. The payment can be made either through CCAvenue or PayPal payments gateways which accept all international cards.
We extend our support to 6 months post sale. A post sale customization is also provided to cover your unmet needs in the report.
Request Customization
We offer complimentary customization of up to 15% with every purchase. To share your customization requirements, feel free to email us at info@strategymrc.com or call us on +1-301-202-5929. .
Please Note: Customization within the 15% threshold is entirely free of charge. If your request exceeds this limit, we will conduct a feasibility assessment. Following that, a detailed quote and timeline will be provided.
WHY CHOOSE US ?

Assured Quality
Best in class reports with high standard of research integrity

24X7 Research Support
Continuous support to ensure the best customer experience.

Free Customization
Adding more values to your product of interest.

Safe & Secure Access
Providing a secured environment for all online transactions.

Trusted by 600+ Brands
Serving the most reputed brands across the world.