
Agricultural Products Chain Conveyors Market
Agricultural Products Chain Conveyors Market Forecasts to 2030 - Global Analysis By Type (Vertical, Horizontal and Other Types), Application (Eggs , Fruit, Canned and Other Applications), End User and By Geography

|
Years Covered |
2021-2030 |
|
Estimated Year Value (2023) |
US $36.79 BN |
|
Projected Year Value (2030) |
US $88.17 BN |
|
CAGR (2023 - 2030) |
13.3% |
|
Regions Covered |
North America, Europe, Asia Pacific, South America, and Middle East & Africa |
|
Countries Covered |
US, Canada, Mexico, Germany, UK, Italy, France, Spain, Japan, China, India, Australia, New Zealand, South Korea, Rest of Asia Pacific, South America, Argentina, Brazil, Chile, Middle East & Africa, Saudi Arabia, UAE, Qatar, and South Africa |
|
Largest Market |
North America |
|
Highest Growing Market |
Asia Pacific |
According to Stratistics MRC, the Global Agricultural Products Chain Conveyors Market is accounted for $36.79 billion in 2023 and is expected to reach $88.17 billion by 2030 growing at a CAGR of 13.3% during the forecast period. Agricultural Products Chain Conveyors are sophisticated mechanical systems designed to facilitate the seamless movement of a wide variety of agricultural goods throughout the various stages of the agricultural supply chain. These conveyors transfer commodities in a horizontal, vertical, or inclined manner, including grains, fruits, vegetables, and other agricultural products. They work by using a continuous chain mechanism with linked links or paddles that move along a fixed path. These conveyor systems help to lessen product damage, boost overall operational effectiveness, and enhance the quality and safety of agricultural products in addition to reducing the need for physical labour.
Market Dynamics:
Driver:
Increased agricultural production
The market for agricultural products and chain conveyors is significantly driven by increased agricultural production. The reason for activity is basically anchored in the rising demand for food and agricultural goods on a worldwide scale as a result of a continually growing population. In order to meet the growing demand for food as more people become dependent on it, agricultural output must be increased. The agricultural supply chain needs effective conveyors in order to address this difficulty. These conveyors can speed up the transportation of crops, lessen the need for manual labour, prevent product damage, and increase overall efficiency. As a result, they can help increase agricultural production and the market growth for agricultural products through chain conveyors as a whole.
Restraint:
High initial costs
An important restraint for the market for agricultural product chain conveyors is their high initial costs. The equipment, installation, and required infrastructure must all be purchased in advance in order to execute chain conveyor systems. These upfront expenses can be a significant barrier to entrance and adoption for many agricultural businesses, especially smaller and medium-sized operations with constrained capital resources. Furthermore, businesses may be discouraged from considering chain conveyor systems as feasible solutions for optimising their operations due to their high starting costs, which might hinder the market's expansion.
Opportunity:
Environmental regulations
By encouraging the use of conveyor systems that are more energy-efficient and environmentally friendly, environmental limitations may change the industry. In response to this need, conveyor systems have incorporated technologies and layouts that are more environmentally and energy-conscious. Additionally, conveyor systems may feature improved waste reduction or recycling capabilities, lower emissions, and energy-efficient motors. Agricultural operations now have a way to reduce their carbon footprint and follow tight environmental regulations due to these technological innovations.
Threat:
Economic downturns
Economic downturns pose a serious threat to the chain conveyors market for agricultural products. Economic downturns and unstable financial conditions frequently result in tighter budgets and lower profit margins for agricultural firms. These companies typically reduce expenses and minimise capital expenditures in reaction to economic hardships, which may affect their desire to invest in innovative technology like chain conveyor systems. Furthermore, the entire agricultural supply chain may be affected by economic downturns. Reduced consumer spending, stricter credit standards, and less export prospects can all result in lower agricultural product quantities and production levels. These factors hinder market expansion.
Covid-19 Impact
The market for agricultural products and chain conveyors was significantly impacted by the COVID-19 outbreak. Global supply chains were disrupted, which was one of the most noticeable and immediate repercussions. Agriculture enterprises with an export focus faced difficulties as a result of interruptions in global trade and shifting demand trends. Conveyor system utilisation for export has been hampered by fluctuations in trade quantities and difficulties with global logistics. The pandemic's financial effects were also significant. As sales fell and economic instability increased, many agricultural firms experienced financial instability.
The horizontal segment is expected to be the largest during the forecast period
The horizontal segment is estimated to hold the largest share. Agricultural products are typically transported using horizontal chain conveyors along a level or nearly level course. They are appropriate for situations where transporting items from one place to another on the same plane with minimal elevation variations is the main requirement. Horizontal conveyors are frequently utilised for in-field transportation in agricultural applications. For instance, they can be used in harvesting machinery to carry recently picked crops, like grains, fruits, or vegetables, from the point of harvest to ready containers or trailers without the need for manual labour.
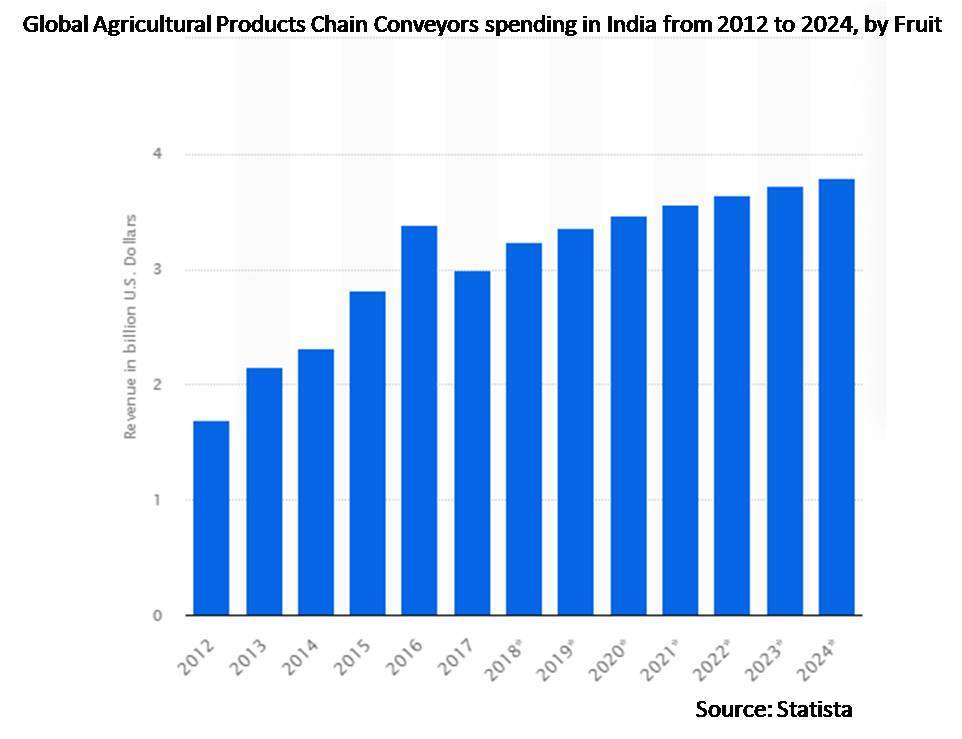
The fruit segment is expected to have the highest CAGR during the forecast period
The fruit segment is anticipated to have lucrative growth during the forecast period. The handling, transportation, and processing of many kinds of fruits, including apples, oranges, berries, grapes, and more, is the focus of the market sector for agricultural products chain conveyors that is devoted to fruits. To separate fruits according to size, quality, and ripeness, many fruit conveyor systems use sorting and grading machinery. This is essential for ensuring that only the best fruits are sold, lowering waste, and raising the calibre of the final product as a whole.
Region with largest share:
North America commanded the largest market share during the extrapolated period presence of modern and highly mechanized agriculture. Environmental issues and regulatory requirements also have an influence on the conveyor technology used. As one of the world's top agricultural producers, the United States significantly increases demand for chain conveyor systems. In the United States, conveyor technology is commonly used to carry a variety of agricultural goods, such as grains, fruits, vegetables, and meat products. Conveyor systems are crucial to maximising the flow of goods from farms to processing facilities and distribution centres because the agricultural landscape is largely mechanised.
Region with highest CAGR:
Asia Pacific is expected to witness profitable growth over the projection period. Asia Pacific emerging economies with substantial agricultural sectors include China and India. Conveyor system adoption in this area may differ depending on elements including the size of the agriculture sector and government funding for modernization. With a focus on crops like rice, wheat, and lentils, India has a diverse agricultural environment. Grain and other agricultural products are handled and transported via conveyor systems. The requirement to lower post-harvest losses and boost supply chain effectiveness has an impact on the deployment of conveyor technology in India.

Key players in the market
Some of the key players in the Agricultural Products Chain Conveyors Market include Apollo VTS B.V, Dorner, FlexLink, Maschinenbau Kitz GmbH, Gebo cermex, Tetra Pak, Flexicon, Productive Systems, Facet Engineering, SpanTech, Rapat Corporation, Mysilo, Schrage Conveying Systems and Hapman.
Key Developments:
In March 2023, FlexLink will unveil a new solution, Launch of BRIXX especially developed for co-packers and E-commerce. FlexLink is revolutionizing automated material handling solutions with BRIXX, enabling companies to respond flexibly to changing consumer trends. Co-packing and e-commerce companies need to respond to the increasing demand for higher differentiation and personalization options.
In April 2022, Tetra Pak partners with leading beverage brands to launch the world have first tethered caps on carton packages. Marking a significant milestone in the company’s long-term work on design for recycling, five new tethered cap solutions are currently being introduced across Ireland, the Baltics, Spain and Germany in different product categories – a market first for these geographies.
In November 2022, Tetra Pak announces first collaboration with food processing technology incubator. This initiative will combine the company’s industry expertise with Fresh Start’s innovative approach to drive solutions that will contribute to improving food systems resilience.
Types Covered:
• Vertical
• Horizontal
• Other Types
Applications Covered:
• Eggs
• Fruit
• Canned
• Other Applications
End Users Covered:
• Grain Elevators and Silos
• Fertilizer and Seed Manufacturers
• Food Processing Plants
• Feed Mills
• Agricultural Cooperatives
Regions Covered:
• North America
o US
o Canada
o Mexico
• Europe
o Germany
o UK
o Italy
o France
o Spain
o Rest of Europe
• Asia Pacific
o Japan
o China
o India
o Australia
o New Zealand
o South Korea
o Rest of Asia Pacific
• South America
o Argentina
o Brazil
o Chile
o Rest of South America
• Middle East & Africa
o Saudi Arabia
o UAE
o Qatar
o South Africa
o Rest of Middle East & Africa
What our report offers:
- Market share assessments for the regional and country-level segments
- Strategic recommendations for the new entrants
- Covers Market data for the years 2021, 2022, 2023, 2026, and 2030
- Market Trends (Drivers, Constraints, Opportunities, Threats, Challenges, Investment Opportunities, and recommendations)
- Strategic recommendations in key business segments based on the market estimations
- Competitive landscaping mapping the key common trends
- Company profiling with detailed strategies, financials, and recent developments
- Supply chain trends mapping the latest technological advancements
Free Customization Offerings:
All the customers of this report will be entitled to receive one of the following free customization options:
• Company Profiling
o Comprehensive profiling of additional market players (up to 3)
o SWOT Analysis of key players (up to 3)
• Regional Segmentation
o Market estimations, Forecasts and CAGR of any prominent country as per the client's interest (Note: Depends on feasibility check)
• Competitive Benchmarking
o Benchmarking of key players based on product portfolio, geographical presence, and strategic alliances
Table of Contents
1 Executive Summary
2 Preface
2.1 Abstract
2.2 Stake Holders
2.3 Research Scope
2.4 Research Methodology
2.4.1 Data Mining
2.4.2 Data Analysis
2.4.3 Data Validation
2.4.4 Research Approach
2.5 Research Sources
2.5.1 Primary Research Sources
2.5.2 Secondary Research Sources
2.5.3 Assumptions
3 Market Trend Analysis
3.1 Introduction
3.2 Drivers
3.3 Restraints
3.4 Opportunities
3.5 Threats
3.6 Application Analysis
3.7 End User Analysis
3.8 Emerging Markets
3.9 Impact of Covid-19
4 Porters Five Force Analysis
4.1 Bargaining power of suppliers
4.2 Bargaining power of buyers
4.3 Threat of substitutes
4.4 Threat of new entrants
4.5 Competitive rivalry
5 Global Agricultural Products Chain Conveyors Market, By Type
5.1 Introduction
5.2 Vertical
5.3 Horizontal
5.4 Other Types
6 Global Agricultural Products Chain Conveyors Market, By Application
6.1 Introduction
6.2 Eggs
6.3 Fruit
6.4 Canned
6.5 Other Applications
7 Global Agricultural Products Chain Conveyors Market, By End User
7.1 Introduction
7.2 Grain Elevators and Silos
7.3 Fertilizer and Seed Manufacturers
7.4 Food Processing Plants
7.5 Feed Mills
7.6 Agricultural Cooperatives
8 Global Agricultural Products Chain Conveyors Market, By Geography
8.1 Introduction
8.2 North America
8.2.1 US
8.2.2 Canada
8.2.3 Mexico
8.3 Europe
8.3.1 Germany
8.3.2 UK
8.3.3 Italy
8.3.4 France
8.3.5 Spain
8.3.6 Rest of Europe
8.4 Asia Pacific
8.4.1 Japan
8.4.2 China
8.4.3 India
8.4.4 Australia
8.4.5 New Zealand
8.4.6 South Korea
8.4.7 Rest of Asia Pacific
8.5 South America
8.5.1 Argentina
8.5.2 Brazil
8.5.3 Chile
8.5.4 Rest of South America
8.6 Middle East & Africa
8.6.1 Saudi Arabia
8.6.2 UAE
8.6.3 Qatar
8.6.4 South Africa
8.6.5 Rest of Middle East & Africa
9 Key Developments
9.1 Agreements, Partnerships, Collaborations and Joint Ventures
9.2 Acquisitions & Mergers
9.3 New Product Launch
9.4 Expansions
9.5 Other Key Strategies
10 Company Profiling
10.1 Apollo VTS B.V
10.2 Dorner
10.3 FlexLink
10.4 Maschinenbau Kitz GmbH
10.5 Gebo cermex
10.6 Tetra Pak
10.7 Flexicon
10.8 Productive Systems
10.9 Facet Engineering
10.10 SpanTech
10.11 Rapat Corporation
10.12 Mysilo
10.13 Schrage Conveying Systems
10.14 Hapman
List of Tables
1 Global Agricultural Products Chain Conveyors Market Outlook, By Region (2021-2030) ($MN)
2 Global Agricultural Products Chain Conveyors Market Outlook, By Type (2021-2030) ($MN)
3 Global Agricultural Products Chain Conveyors Market Outlook, By Vertical (2021-2030) ($MN)
4 Global Agricultural Products Chain Conveyors Market Outlook, By Horizontal (2021-2030) ($MN)
5 Global Agricultural Products Chain Conveyors Market Outlook, By Other Types (2021-2030) ($MN)
6 Global Agricultural Products Chain Conveyors Market Outlook, By Application (2021-2030) ($MN)
7 Global Agricultural Products Chain Conveyors Market Outlook, By Eggs (2021-2030) ($MN)
8 Global Agricultural Products Chain Conveyors Market Outlook, By Fruit (2021-2030) ($MN)
9 Global Agricultural Products Chain Conveyors Market Outlook, By Canned (2021-2030) ($MN)
10 Global Agricultural Products Chain Conveyors Market Outlook, By Other Applications (2021-2030) ($MN)
11 Global Agricultural Products Chain Conveyors Market Outlook, By End User (2021-2030) ($MN)
12 Global Agricultural Products Chain Conveyors Market Outlook, By Grain Elevators and Silos (2021-2030) ($MN)
13 Global Agricultural Products Chain Conveyors Market Outlook, By Fertilizer and Seed Manufacturers (2021-2030) ($MN)
14 Global Agricultural Products Chain Conveyors Market Outlook, By Food Processing Plants (2021-2030) ($MN)
15 Global Agricultural Products Chain Conveyors Market Outlook, By Feed Mills (2021-2030) ($MN)
16 Global Agricultural Products Chain Conveyors Market Outlook, By Agricultural Cooperatives (2021-2030) ($MN)
17 North America Agricultural Products Chain Conveyors Market Outlook, By Country (2021-2030) ($MN)
18 North America Agricultural Products Chain Conveyors Market Outlook, By Type (2021-2030) ($MN)
19 North America Agricultural Products Chain Conveyors Market Outlook, By Vertical (2021-2030) ($MN)
20 North America Agricultural Products Chain Conveyors Market Outlook, By Horizontal (2021-2030) ($MN)
21 North America Agricultural Products Chain Conveyors Market Outlook, By Other Types (2021-2030) ($MN)
22 North America Agricultural Products Chain Conveyors Market Outlook, By Application (2021-2030) ($MN)
23 North America Agricultural Products Chain Conveyors Market Outlook, By Eggs (2021-2030) ($MN)
24 North America Agricultural Products Chain Conveyors Market Outlook, By Fruit (2021-2030) ($MN)
25 North America Agricultural Products Chain Conveyors Market Outlook, By Canned (2021-2030) ($MN)
26 North America Agricultural Products Chain Conveyors Market Outlook, By Other Applications (2021-2030) ($MN)
27 North America Agricultural Products Chain Conveyors Market Outlook, By End User (2021-2030) ($MN)
28 North America Agricultural Products Chain Conveyors Market Outlook, By Grain Elevators and Silos (2021-2030) ($MN)
29 North America Agricultural Products Chain Conveyors Market Outlook, By Fertilizer and Seed Manufacturers (2021-2030) ($MN)
30 North America Agricultural Products Chain Conveyors Market Outlook, By Food Processing Plants (2021-2030) ($MN)
31 North America Agricultural Products Chain Conveyors Market Outlook, By Feed Mills (2021-2030) ($MN)
32 North America Agricultural Products Chain Conveyors Market Outlook, By Agricultural Cooperatives (2021-2030) ($MN)
33 Europe Agricultural Products Chain Conveyors Market Outlook, By Country (2021-2030) ($MN)
34 Europe Agricultural Products Chain Conveyors Market Outlook, By Type (2021-2030) ($MN)
35 Europe Agricultural Products Chain Conveyors Market Outlook, By Vertical (2021-2030) ($MN)
36 Europe Agricultural Products Chain Conveyors Market Outlook, By Horizontal (2021-2030) ($MN)
37 Europe Agricultural Products Chain Conveyors Market Outlook, By Other Types (2021-2030) ($MN)
38 Europe Agricultural Products Chain Conveyors Market Outlook, By Application (2021-2030) ($MN)
39 Europe Agricultural Products Chain Conveyors Market Outlook, By Eggs (2021-2030) ($MN)
40 Europe Agricultural Products Chain Conveyors Market Outlook, By Fruit (2021-2030) ($MN)
41 Europe Agricultural Products Chain Conveyors Market Outlook, By Canned (2021-2030) ($MN)
42 Europe Agricultural Products Chain Conveyors Market Outlook, By Other Applications (2021-2030) ($MN)
43 Europe Agricultural Products Chain Conveyors Market Outlook, By End User (2021-2030) ($MN)
44 Europe Agricultural Products Chain Conveyors Market Outlook, By Grain Elevators and Silos (2021-2030) ($MN)
45 Europe Agricultural Products Chain Conveyors Market Outlook, By Fertilizer and Seed Manufacturers (2021-2030) ($MN)
46 Europe Agricultural Products Chain Conveyors Market Outlook, By Food Processing Plants (2021-2030) ($MN)
47 Europe Agricultural Products Chain Conveyors Market Outlook, By Feed Mills (2021-2030) ($MN)
48 Europe Agricultural Products Chain Conveyors Market Outlook, By Agricultural Cooperatives (2021-2030) ($MN)
49 Asia Pacific Agricultural Products Chain Conveyors Market Outlook, By Country (2021-2030) ($MN)
50 Asia Pacific Agricultural Products Chain Conveyors Market Outlook, By Type (2021-2030) ($MN)
51 Asia Pacific Agricultural Products Chain Conveyors Market Outlook, By Vertical (2021-2030) ($MN)
52 Asia Pacific Agricultural Products Chain Conveyors Market Outlook, By Horizontal (2021-2030) ($MN)
53 Asia Pacific Agricultural Products Chain Conveyors Market Outlook, By Other Types (2021-2030) ($MN)
54 Asia Pacific Agricultural Products Chain Conveyors Market Outlook, By Application (2021-2030) ($MN)
55 Asia Pacific Agricultural Products Chain Conveyors Market Outlook, By Eggs (2021-2030) ($MN)
56 Asia Pacific Agricultural Products Chain Conveyors Market Outlook, By Fruit (2021-2030) ($MN)
57 Asia Pacific Agricultural Products Chain Conveyors Market Outlook, By Canned (2021-2030) ($MN)
58 Asia Pacific Agricultural Products Chain Conveyors Market Outlook, By Other Applications (2021-2030) ($MN)
59 Asia Pacific Agricultural Products Chain Conveyors Market Outlook, By End User (2021-2030) ($MN)
60 Asia Pacific Agricultural Products Chain Conveyors Market Outlook, By Grain Elevators and Silos (2021-2030) ($MN)
61 Asia Pacific Agricultural Products Chain Conveyors Market Outlook, By Fertilizer and Seed Manufacturers (2021-2030) ($MN)
62 Asia Pacific Agricultural Products Chain Conveyors Market Outlook, By Food Processing Plants (2021-2030) ($MN)
63 Asia Pacific Agricultural Products Chain Conveyors Market Outlook, By Feed Mills (2021-2030) ($MN)
64 Asia Pacific Agricultural Products Chain Conveyors Market Outlook, By Agricultural Cooperatives (2021-2030) ($MN)
65 South America Agricultural Products Chain Conveyors Market Outlook, By Country (2021-2030) ($MN)
66 South America Agricultural Products Chain Conveyors Market Outlook, By Type (2021-2030) ($MN)
67 South America Agricultural Products Chain Conveyors Market Outlook, By Vertical (2021-2030) ($MN)
68 South America Agricultural Products Chain Conveyors Market Outlook, By Horizontal (2021-2030) ($MN)
69 South America Agricultural Products Chain Conveyors Market Outlook, By Other Types (2021-2030) ($MN)
70 South America Agricultural Products Chain Conveyors Market Outlook, By Application (2021-2030) ($MN)
71 South America Agricultural Products Chain Conveyors Market Outlook, By Eggs (2021-2030) ($MN)
72 South America Agricultural Products Chain Conveyors Market Outlook, By Fruit (2021-2030) ($MN)
73 South America Agricultural Products Chain Conveyors Market Outlook, By Canned (2021-2030) ($MN)
74 South America Agricultural Products Chain Conveyors Market Outlook, By Other Applications (2021-2030) ($MN)
75 South America Agricultural Products Chain Conveyors Market Outlook, By End User (2021-2030) ($MN)
76 South America Agricultural Products Chain Conveyors Market Outlook, By Grain Elevators and Silos (2021-2030) ($MN)
77 South America Agricultural Products Chain Conveyors Market Outlook, By Fertilizer and Seed Manufacturers (2021-2030) ($MN)
78 South America Agricultural Products Chain Conveyors Market Outlook, By Food Processing Plants (2021-2030) ($MN)
79 South America Agricultural Products Chain Conveyors Market Outlook, By Feed Mills (2021-2030) ($MN)
80 South America Agricultural Products Chain Conveyors Market Outlook, By Agricultural Cooperatives (2021-2030) ($MN) Agricultural Cooperatives (2021-2030) ($MN)
81 Middle East & Africa Agricultural Products Chain Conveyors Market Outlook, By Country (2021-2030) ($MN)
82 Middle East & Africa Agricultural Products Chain Conveyors Market Outlook, By Type (2021-2030) ($MN)
83 Middle East & Africa Agricultural Products Chain Conveyors Market Outlook, By Vertical (2021-2030) ($MN)
84 Middle East & Africa Agricultural Products Chain Conveyors Market Outlook, By Horizontal (2021-2030) ($MN)
85 Middle East & Africa Agricultural Products Chain Conveyors Market Outlook, By Other Types (2021-2030) ($MN)
86 Middle East & Africa Agricultural Products Chain Conveyors Market Outlook, By Application (2021-2030) ($MN)
87 Middle East & Africa Agricultural Products Chain Conveyors Market Outlook, By Eggs (2021-2030) ($MN)
88 Middle East & Africa Agricultural Products Chain Conveyors Market Outlook, By Fruit (2021-2030) ($MN)
89 Middle East & Africa Agricultural Products Chain Conveyors Market Outlook, By Canned (2021-2030) ($MN)
90 Middle East & Africa Agricultural Products Chain Conveyors Market Outlook, By Other Applications (2021-2030) ($MN)
91 Middle East & Africa Agricultural Products Chain Conveyors Market Outlook, By End User (2021-2030) ($MN)
92 Middle East & Africa Agricultural Products Chain Conveyors Market Outlook, By Grain Elevators and Silos (2021-2030) ($MN)
93 Middle East & Africa Agricultural Products Chain Conveyors Market Outlook, By Fertilizer and Seed Manufacturers (2021-2030) ($MN)
94 Middle East & Africa Agricultural Products Chain Conveyors Market Outlook, By Food Processing Plants (2021-2030) ($MN)
95 Middle East & Africa Agricultural Products Chain Conveyors Market Outlook, By Feed Mills (2021-2030) ($MN)
List of Figures
List of Figures
Figure 1 Global Agricultural Products Chain Conveyors Market Outlook (2021-2030) ($MN)
Figure 2 North America Agricultural Products Chain Conveyors Market Outlook (2021-2030) ($MN)
Figure 3 US Agricultural Products Chain Conveyors Market Outlook (2021-2030) ($MN)
Figure 4 Canada Agricultural Products Chain Conveyors Market Outlook (2021-2030) ($MN)
Figure 5 Mexico Agricultural Products Chain Conveyors Market Outlook (2021-2030) ($MN)
Figure 6 Europe Agricultural Products Chain Conveyors Market Outlook (2021-2030) ($MN)
Figure 7 Germany Agricultural Products Chain Conveyors Market Outlook (2021-2030) ($MN)
Figure 8 UK Agricultural Products Chain Conveyors Market Outlook (2021-2030) ($MN)
Figure 9 Italy Agricultural Products Chain Conveyors Market Outlook (2021-2030) ($MN)
Figure 10 France Agricultural Products Chain Conveyors Market Outlook (2021-2030) ($MN)
Figure 11 Spain Agricultural Products Chain Conveyors Market Outlook (2021-2030) ($MN)
Figure 12 Rest of Europe Agricultural Products Chain Conveyors Market Outlook (2021-2030) ($MN)
Figure 13 Asia Pacific Agricultural Products Chain Conveyors Market Outlook (2021-2030) ($MN)
Figure 14 Japan Agricultural Products Chain Conveyors Market Outlook (2021-2030) ($MN)
Figure 15 China Agricultural Products Chain Conveyors Market Outlook (2021-2030) ($MN)
Figure 16 India Agricultural Products Chain Conveyors Market Outlook (2021-2030) ($MN)
Figure 17 Australia Agricultural Products Chain Conveyors Market Outlook (2021-2030) ($MN)
Figure 18 New Zealand Agricultural Products Chain Conveyors Market Outlook (2021-2030) ($MN)
Figure 19 South Korea Agricultural Products Chain Conveyors Market Outlook (2021-2030) ($MN)
Figure 20 Rest of Asia Pacific Agricultural Products Chain Conveyors Market Outlook (2021-2030) ($MN)
Figure 21 South America Agricultural Products Chain Conveyors Market Outlook (2021-2030) ($MN)
Figure 22 Argentina Agricultural Products Chain Conveyors Market Outlook (2021-2030) ($MN)
Figure 23 Brazil Agricultural Products Chain Conveyors Market Outlook (2021-2030) ($MN)
Figure 24 Chile Agricultural Products Chain Conveyors Market Outlook (2021-2030) ($MN)
Figure 25 Rest of South America Agricultural Products Chain Conveyors Market Outlook (2021-2030) ($MN)
Figure 26 Middle East & Africa Agricultural Products Chain Conveyors Market Outlook (2021-2030) ($MN)
Figure 27 Saudi Arabia Agricultural Products Chain Conveyors Market Outlook (2021-2030) ($MN)
Figure 28 UAE Agricultural Products Chain Conveyors Market Outlook (2021-2030) ($MN)
Figure 29 Qatar Agricultural Products Chain Conveyors Market Outlook (2021-2030) ($MN)
Figure 30 South Africa Agricultural Products Chain Conveyors Market Outlook (2021-2030) ($MN)
Figure 31 Rest of Middle East & Africa Agricultural Products Chain Conveyors Market Outlook (2021-2030) ($MN)
RESEARCH METHODOLOGY

We at ‘Stratistics’ opt for an extensive research approach which involves data mining, data validation, and data analysis. The various research sources include in-house repository, secondary research, competitor’s sources, social media research, client internal data, and primary research.
Our team of analysts prefers the most reliable and authenticated data sources in order to perform the comprehensive literature search. With access to most of the authenticated data bases our team highly considers the best mix of information through various sources to obtain extensive and accurate analysis.
Each report takes an average time of a month and a team of 4 industry analysts. The time may vary depending on the scope and data availability of the desired market report. The various parameters used in the market assessment are standardized in order to enhance the data accuracy.
Data Mining
The data is collected from several authenticated, reliable, paid and unpaid sources and is filtered depending on the scope & objective of the research. Our reports repository acts as an added advantage in this procedure. Data gathering from the raw material suppliers, distributors and the manufacturers is performed on a regular basis, this helps in the comprehensive understanding of the products value chain. Apart from the above mentioned sources the data is also collected from the industry consultants to ensure the objective of the study is in the right direction.
Market trends such as technological advancements, regulatory affairs, market dynamics (Drivers, Restraints, Opportunities and Challenges) are obtained from scientific journals, market related national & international associations and organizations.
Data Analysis
From the data that is collected depending on the scope & objective of the research the data is subjected for the analysis. The critical steps that we follow for the data analysis include:
- Product Lifecycle Analysis
- Competitor analysis
- Risk analysis
- Porters Analysis
- PESTEL Analysis
- SWOT Analysis
The data engineering is performed by the core industry experts considering both the Marketing Mix Modeling and the Demand Forecasting. The marketing mix modeling makes use of multiple-regression techniques to predict the optimal mix of marketing variables. Regression factor is based on a number of variables and how they relate to an outcome such as sales or profits.
Data Validation
The data validation is performed by the exhaustive primary research from the expert interviews. This includes telephonic interviews, focus groups, face to face interviews, and questionnaires to validate our research from all aspects. The industry experts we approach come from the leading firms, involved in the supply chain ranging from the suppliers, distributors to the manufacturers and consumers so as to ensure an unbiased analysis.
We are in touch with more than 15,000 industry experts with the right mix of consultants, CEO's, presidents, vice presidents, managers, experts from both supply side and demand side, executives and so on.
The data validation involves the primary research from the industry experts belonging to:
- Leading Companies
- Suppliers & Distributors
- Manufacturers
- Consumers
- Industry/Strategic Consultants
Apart from the data validation the primary research also helps in performing the fill gap research, i.e. providing solutions for the unmet needs of the research which helps in enhancing the reports quality.
For more details about research methodology, kindly write to us at info@strategymrc.com
Frequently Asked Questions
In case of any queries regarding this report, you can contact the customer service by filing the “Inquiry Before Buy” form available on the right hand side. You may also contact us through email: info@strategymrc.com or phone: +1-301-202-5929
Yes, the samples are available for all the published reports. You can request them by filling the “Request Sample” option available in this page.
Yes, you can request a sample with your specific requirements. All the customized samples will be provided as per the requirement with the real data masked.
All our reports are available in Digital PDF format. In case if you require them in any other formats, such as PPT, Excel etc you can submit a request through “Inquiry Before Buy” form available on the right hand side. You may also contact us through email: info@strategymrc.com or phone: +1-301-202-5929
We offer a free 15% customization with every purchase. This requirement can be fulfilled for both pre and post sale. You may send your customization requirements through email at info@strategymrc.com or call us on +1-301-202-5929.
We have 3 different licensing options available in electronic format.
- Single User Licence: Allows one person, typically the buyer, to have access to the ordered product. The ordered product cannot be distributed to anyone else.
- 2-5 User Licence: Allows the ordered product to be shared among a maximum of 5 people within your organisation.
- Corporate License: Allows the product to be shared among all employees of your organisation regardless of their geographical location.
All our reports are typically be emailed to you as an attachment.
To order any available report you need to register on our website. The payment can be made either through CCAvenue or PayPal payments gateways which accept all international cards.
We extend our support to 6 months post sale. A post sale customization is also provided to cover your unmet needs in the report.
Request Customization
We offer complimentary customization of up to 15% with every purchase. To share your customization requirements, feel free to email us at info@strategymrc.com or call us on +1-301-202-5929. .
Please Note: Customization within the 15% threshold is entirely free of charge. If your request exceeds this limit, we will conduct a feasibility assessment. Following that, a detailed quote and timeline will be provided.
WHY CHOOSE US ?

Assured Quality
Best in class reports with high standard of research integrity

24X7 Research Support
Continuous support to ensure the best customer experience.

Free Customization
Adding more values to your product of interest.

Safe & Secure Access
Providing a secured environment for all online transactions.

Trusted by 600+ Brands
Serving the most reputed brands across the world.