
Agricultural Tires Market
Agricultural Tires Market Forecasts to 2030 - Global Analysis By Tire Type (Bias Tires and Radial Tires), Equipment Horsepower (0-80 HP and 81-200 HP), Sales Channel Type (OEM and Replacement/Aftermarket) Application and By Geography

|
Years Covered |
2021-2030 |
|
Estimated Year Value (2023) |
US $9.94 BN |
|
Projected Year Value (2030) |
US $17.26 BN |
|
CAGR (2023 - 2030) |
8.2% |
|
Regions Covered |
North America, Europe, Asia Pacific, South America, and Middle East & Africa |
|
Countries Covered |
US, Canada, Mexico, Germany, UK, Italy, France, Spain, Japan, China, India, Australia, New Zealand, South Korea, Rest of Asia Pacific, South America, Argentina, Brazil, Chile, Middle East & Africa, Saudi Arabia, UAE, Qatar, and South Africa |
|
Largest Market |
Asia Pacific |
|
Highest Growing Market |
North America |
According to Stratistics MRC, the Global Agricultural Tires Market is accounted for $9.94 billion in 2023 and is expected to reach $17.26 billion by 2030 growing at a CAGR of 8.2% during the forecast period. Agriculture tires are intended only for use in farms or other agricultural settings, as their name suggests. These tires have a 45-degree slant on the diagonal thread. The tractor can move fast in mud and soil because the treads have the most traction possible. Agriculture tractors, combine harvesters, sprayers, trailers, and skid steer loaders are just a few examples of the many various types of machinery that are available in a range of sizes and diameters. For a lifetime of better performance and to be durable both on and off the field, these are manufactured of rubber of the highest grade. In order to provide traction on slick terrain, they are highly ribbed and voided. Both the stability and fuel efficiency of these tires have improved.
According to the Association of Equipment Manufacturers (AEM), the sales of farm tractors decreased in March 2020% by 15.6% in the U.S. as compared to 2019, and the self-propelled combined sales declined in March by 11.9%.
Market Dynamics:
Driver:
The increasing demand for tractors
Tractor sales are fuelled by population shifts from rural to urban areas, increased labor costs, and a shortage of competent personnel in the majority of emerging nations. One of the primary causes of the growing demand in the farming sector is a lack of farm labor and rising costs. The lack of available manpower will drive the market for agricultural tractors. Farm labor expenses are directly correlated with the proportion of a nation's total population that is employed in agriculture when simple demand-supply economics and the shift of labor from urban to rural areas are taken into account. As a result, farm owners spend money on farm equipment to lessen their reliance on manual labor and cut down on the time and effort needed for farming.
Restraint:
Tire disposal and waste management
Regulations governing tire disposal and waste management can pose challenges for agricultural tire manufacturers. Environmental regulations often require proper disposal and recycling of end-of-life tires to minimize environmental impact. Compliance with these regulations can involve additional costs and complexities for manufacturers, including the establishment of tire collection and recycling programs. Meeting these regulatory requirements can impact the overall cost structure and competitiveness of agricultural tires.
Opportunity:
Increasing focus on new technologies
The agricultural sector is embracing new technologies to improve productivity, efficiency, and sustainability. These advancements include precision agriculture, automation, data analytics, and IoT integration. Agricultural tires can leverage these technologies to enhance their performance, durability, and overall value proposition. Additionally, integration of smart tire technologies such as tire pressure monitoring systems (TPMS), tire condition monitoring, and embedded sensors can provide real-time data on tire health, performance, and maintenance requirements. This data enables farmers to optimize tire usage, prevent potential failures, and improve overall operational efficiency.
Threat:
Price volatility of raw materials
Price volatility in raw materials can create challenges in maintaining price competitiveness in the agricultural tire market. If the prices of raw materials increase significantly, manufacturers may be compelled to pass on the additional costs to customers, potentially leading to higher prices for agricultural tires. This can make agricultural tires less attractive to price-sensitive customers or create opportunities for alternative solutions, such as retreaded tires, which are typically more affordable.
Covid-19 Impact:
The COVID-19 epidemic has had a global influence on society and the economy. With the closure of all the large industries, there is no demand for agricultural products or vehicles, which is anticipated to hinder market growth. Producers are working on methods to decrease stockpiling, such as output reduction, employment losses, and others. The tire industry is directly connected with the original equipment manufacturers (OEM) hence, it will face huge losses until the lockdown is over. The producers are also working on strategies, such as production cuts, to reduce stockpiling, as the tire manufacturers are also experiencing a shortage of storage space due to lockdown.
The bias tire segment is expected to be the largest during the forecast period
The bias tire segment held the largest share in the market owing to the increasing demand. Bias tires are widely used in India and China because they are made of natural rubber, which is primarily produced in those two nations. Additionally, the bias tire's crosshatch structure and inexpensive price are likely to increase demand. Low raw material costs translate into lower production costs for the final product. However, the segment's expansion is probably going to be constrained by the declining supply of natural rubber. Natural rubber also makes tires more rigid, which reduces their uniformity after usage, jeopardizing the farm tire's round shape and shortening their shelf lives.
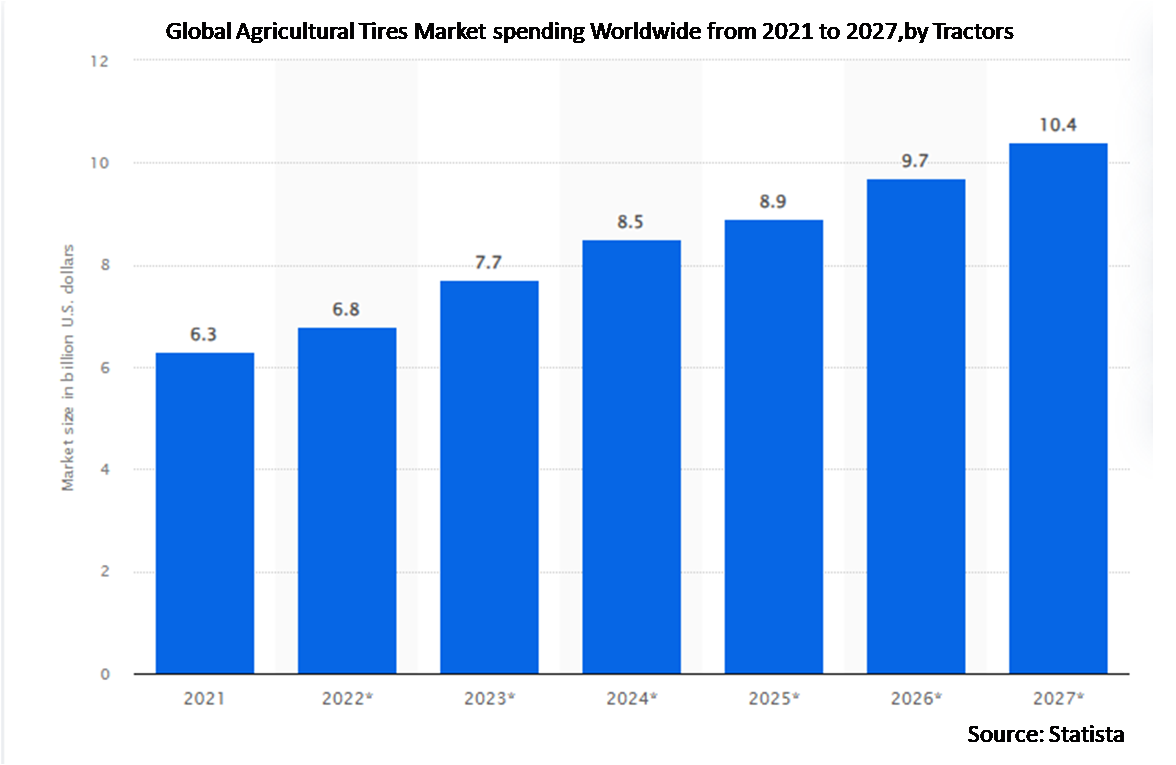
The tractors segment is expected to have the highest CAGR during the forecast period
During the projection period, the tractors segment is expected to have the greatest CAGR. High horsepower tractors are popular because they may be utilized for a variety of farming tasks. As a result of tractors becoming more well known and used in the business, tire demand is also rising. Due to the introduction of various harvester types to meet farming needs, the demand for farm tires in the harvesters segment is anticipated to increase. For instance, John Deere has developed crop-specific harvesters to fit farmer needs, making it simpler to harvest crops like maize and sugarcane. Long agricultural expanses now have a greater need for harvesters as a result.
Region with largest share:
The Asia Pacific region market is estimated to witness the highest share of the global Agricultural Tires market during the forecast period, due to the expanding population, rising middle-class discretionary income, and the quick industrialization and urbanization. The expansion of the farm tire sector may also be aided by the region's presence of both small and large-scale manufacturers. Bias farm tires are produced using manufacturing techniques and materials that provide good load capabilities at reasonable prices. Natural rubber is the primary raw material needed to make bias tires. As a result, it is anticipated that the Asia Pacific region's plentiful supply of natural rubber in countries like Thailand, India, Vietnam, Indonesia, China, and Malaysia will increase demand of the market in the region.
Region with highest CAGR:
The North America region is expected to have the highest growth rate over the forecast period. This growth can be attributed high demand for agricultural goods owing to rising living standards, foreign investments and increased consumption. Moreover, growing agricultural industry of countries such as the U.S. and Canada in the region is leading to growing demand for agricultural tires. Along with this, the mechanization in agriculture is also growing in the region, which is also driving the market growth of the North America region.

Key players in the market
Some of the key players in Agricultural Tires market include Alliance Tire Group (ATG), Apollo Tyres Ltd., Balakrishna Industries Limited, Bridgestone Corp., CEAT, Compagnie Générale des Établissements Michelin (CGEM), Continental AG, Hankook Tire, JK Tyre & Industries Ltd., Magna Tyres, Michelin, Mitas, MRF Limited, Nokian Tyres PLC, Pirelli & C SpA (Prometeon Tyre Group), Specialty Tires of America, Inc., Sumitomo Rubber Industries, Ltd., TBC Corporation, The Carlstar Group, LLC, Titan International Inc. and Trelleborg AB.
Key Developments:
In January 2022, Magna Tyres acquired Industra Ltd in a step toward global expansion. Industra Ltd has a robust presence in the Polish market, with three tire segments, including Agricultural Tires. Earthmoving, and Industrial Tires, which will aid Magna to mark its presence in the Polish market.
In December 2021, Trelleborg AB announced its plan to increase its production output from North American agriculture tire facilities to cater to the growing demand, as the company generates 18% of the total global wheels sales from the North American market.
In April 2021, Michelin launched its Agribib Row Crop IF (improved flexion) agriculture tires, specially crafted for self-propelled and trailed sprayers, which allow higher load capacity, improved traction, and reduced soil contraction.
Tire Types Covered:
• Bias Tires
• Radial Tires
Equipment Horsepowers Covered:
• 0-80 HP
• 81-200 HP
Sales Channels Covered:
• OEM
• Replacement/Aftermarket
Applications Covered:
• Tractors
• Combine Harvesters
• Sprayers
• Trailers
• Loaders
• Other Applications
Regions Covered:
• North America
o US
o Canada
o Mexico
• Europe
o Germany
o UK
o Italy
o France
o Spain
o Rest of Europe
• Asia Pacific
o Japan
o China
o India
o Australia
o New Zealand
o South Korea
o Rest of Asia Pacific
• South America
o Argentina
o Brazil
o Chile
o Rest of South America
• Middle East & Africa
o Saudi Arabia
o UAE
o Qatar
o South Africa
o Rest of Middle East & Africa
What our report offers:
- Market share assessments for the regional and country-level segments
- Strategic recommendations for the new entrants
- Covers Market data for the years 2021, 2022, 2023, 2026 and 2030
- Market Trends (Drivers, Constraints, Opportunities, Threats, Challenges, Investment Opportunities, and recommendations)
- Strategic recommendations in key business segments based on the market estimations
- Competitive landscaping mapping the key common trends
- Company profiling with detailed strategies, financials, and recent developments
- Supply chain trends mapping the latest technological advancements
Free Customization Offerings:
All the customers of this report will be entitled to receive one of the following free customization options:
• Company Profiling
o Comprehensive profiling of additional market players (up to 3)
o SWOT Analysis of key players (up to 3)
• Regional Segmentation
o Market estimations, Forecasts and CAGR of any prominent country as per the client's interest (Note: Depends on feasibility check)
• Competitive Benchmarking
Benchmarking of key players based on product portfolio, geographical presence, and strategic alliances
Table of Contents
1 Executive Summary
2 Preface
2.1 Abstract
2.2 Stake Holders
2.3 Research Scope
2.4 Research Methodology
2.4.1 Data Mining
2.4.2 Data Analysis
2.4.3 Data Validation
2.4.4 Research Approach
2.5 Research Sources
2.5.1 Primary Research Sources
2.5.2 Secondary Research Sources
2.5.3 Assumptions
3 Market Trend Analysis
3.1 Introduction
3.2 Drivers
3.3 Restraints
3.4 Opportunities
3.5 Threats
3.6 Application Analysis
3.7 Emerging Markets
3.8 Impact of Covid-19
4 Porters Five Force Analysis
4.1 Bargaining power of suppliers
4.2 Bargaining power of buyers
4.3 Threat of substitutes
4.4 Threat of new entrants
4.5 Competitive rivalry
5 Global Agricultural Tires Market, By Tire Type
5.1 Introduction
5.2 Bias Tires
5.3 Radial Tires
6 Global Agricultural Tires Market, By Equipment Horsepower
6.1 Introduction
6.2 0-80 HP
6.3 81-200 HP
7 Global Agricultural Tires Market, By Sales Channel
7.1 Introduction
7.2 OEM
7.3 Replacement/Aftermarket
8 Global Agricultural Tires Market, By Application
8.1 Introduction
8.2 Tractors
8.3 Combine Harvesters
8.4 Sprayers
8.5 Trailers
8.6 Loaders
8.7 Other Applications
9 Global Agricultural Tires Market, By Geography
9.1 Introduction
9.2 North America
9.2.1 US
9.2.2 Canada
9.2.3 Mexico
9.3 Europe
9.3.1 Germany
9.3.2 UK
9.3.3 Italy
9.3.4 France
9.3.5 Spain
9.3.6 Rest of Europe
9.4 Asia Pacific
9.4.1 Japan
9.4.2 China
9.4.3 India
9.4.4 Australia
9.4.5 New Zealand
9.4.6 South Korea
9.4.7 Rest of Asia Pacific
9.5 South America
9.5.1 Argentina
9.5.2 Brazil
9.5.3 Chile
9.5.4 Rest of South America
9.6 Middle East & Africa
9.6.1 Saudi Arabia
9.6.2 UAE
9.6.3 Qatar
9.6.4 South Africa
9.6.5 Rest of Middle East & Africa
10 Key Developments
10.1 Agreements, Partnerships, Collaborations and Joint Ventures
10.2 Acquisitions & Mergers
10.3 New Product Launch
10.4 Expansions
10.5 Other Key Strategies
11 Company Profiling
11.1 Alliance Tire Group (ATG)
11.2 Apollo Tyres Ltd.
11.3 Balakrishna Industries Limited
11.4 Bridgestone Corp.
11.5 CEAT
11.6 Compagnie Générale des Établissements Michelin (CGEM)
11.7 Continental AG
11.8 Hankook Tire
11.9 JK Tyre & Industries Ltd.
11.10 Magna Tyres
11.11 Michelin
11.12 Mitas
11.13 MRF Limited
11.14 Nokian Tyres PLC
11.15 Pirelli & C SpA (Prometeon Tyre Group)
11.16 Specialty Tires of America, Inc.
11.17 Sumitomo Rubber Industries, Ltd.
11.18 TBC Corporation
11.19 The Carlstar Group, LLC
11.20 Titan International Inc.
11.21 Trelleborg AB
List of Tables
1 Global Agricultural Tires Market Outlook, By Region (2021-2030) ($MN)
2 Global Agricultural Tires Market Outlook, By Tire Type (2021-2030) ($MN)
3 Global Agricultural Tires Market Outlook, By Bias Tires (2021-2030) ($MN)
4 Global Agricultural Tires Market Outlook, By Radial Tires (2021-2030) ($MN)
5 Global Agricultural Tires Market Outlook, By Equipment Horsepower (2021-2030) ($MN)
6 Global Agricultural Tires Market Outlook, By 0-80 HP (2021-2030) ($MN)
7 Global Agricultural Tires Market Outlook, By 81-200 HP (2021-2030) ($MN)
8 Global Agricultural Tires Market Outlook, By Sale Channel (2021-2030) ($MN)
9 Global Agricultural Tires Market Outlook, By OEM (2021-2030) ($MN)
10 Global Agricultural Tires Market Outlook, By Replacement/Aftermarket (2021-2030) ($MN)
11 Global Agricultural Tires Market Outlook, By Application (2021-2030) ($MN)
12 Global Agricultural Tires Market Outlook, By Tractors (2021-2030) ($MN)
13 Global Agricultural Tires Market Outlook, By Combine Harvesters (2021-2030) ($MN)
14 Global Agricultural Tires Market Outlook, By Sprayers (2021-2030) ($MN)
15 Global Agricultural Tires Market Outlook, By Trailers (2021-2030) ($MN)
16 Global Agricultural Tires Market Outlook, By Loaders (2021-2030) ($MN)
17 Global Agricultural Tires Market Outlook, By Other Applications (2021-2030) ($MN)
18 North America Agricultural Tires Market Outlook, By Country (2021-2030) ($MN)
19 North America Agricultural Tires Market Outlook, By Tire Type (2021-2030) ($MN)
20 North America Agricultural Tires Market Outlook, By Bias Tires (2021-2030) ($MN)
21 North America Agricultural Tires Market Outlook, By Radial Tires (2021-2030) ($MN)
22 North America Agricultural Tires Market Outlook, By Equipment Horsepower (2021-2030) ($MN)
23 North America Agricultural Tires Market Outlook, By 0-80 HP (2021-2030) ($MN)
24 North America Agricultural Tires Market Outlook, By 81-200 HP (2021-2030) ($MN)
25 North America Agricultural Tires Market Outlook, By Sale Channel (2021-2030) ($MN)
26 North America Agricultural Tires Market Outlook, By OEM (2021-2030) ($MN)
27 North America Agricultural Tires Market Outlook, By Replacement/Aftermarket (2021-2030) ($MN)
28 North America Agricultural Tires Market Outlook, By Application (2021-2030) ($MN)
29 North America Agricultural Tires Market Outlook, By Tractors (2021-2030) ($MN)
30 North America Agricultural Tires Market Outlook, By Combine Harvesters (2021-2030) ($MN)
31 North America Agricultural Tires Market Outlook, By Sprayers (2021-2030) ($MN)
32 North America Agricultural Tires Market Outlook, By Trailers (2021-2030) ($MN)
33 North America Agricultural Tires Market Outlook, By Loaders (2021-2030) ($MN)
34 North America Agricultural Tires Market Outlook, By Other Applications (2021-2030) ($MN)
35 Europe Agricultural Tires Market Outlook, By Country (2021-2030) ($MN)
36 Europe Agricultural Tires Market Outlook, By Tire Type (2021-2030) ($MN)
37 Europe Agricultural Tires Market Outlook, By Bias Tires (2021-2030) ($MN)
38 Europe Agricultural Tires Market Outlook, By Radial Tires (2021-2030) ($MN)
39 Europe Agricultural Tires Market Outlook, By Equipment Horsepower (2021-2030) ($MN)
40 Europe Agricultural Tires Market Outlook, By 0-80 HP (2021-2030) ($MN)
41 Europe Agricultural Tires Market Outlook, By 81-200 HP (2021-2030) ($MN)
42 Europe Agricultural Tires Market Outlook, By Sale Channel (2021-2030) ($MN)
43 Europe Agricultural Tires Market Outlook, By OEM (2021-2030) ($MN)
44 Europe Agricultural Tires Market Outlook, By Replacement/Aftermarket (2021-2030) ($MN)
45 Europe Agricultural Tires Market Outlook, By Application (2021-2030) ($MN)
46 Europe Agricultural Tires Market Outlook, By Tractors (2021-2030) ($MN)
47 Europe Agricultural Tires Market Outlook, By Combine Harvesters (2021-2030) ($MN)
48 Europe Agricultural Tires Market Outlook, By Sprayers (2021-2030) ($MN)
49 Europe Agricultural Tires Market Outlook, By Trailers (2021-2030) ($MN)
50 Europe Agricultural Tires Market Outlook, By Loaders (2021-2030) ($MN)
51 Europe Agricultural Tires Market Outlook, By Other Applications (2021-2030) ($MN)
52 Asia Pacific Agricultural Tires Market Outlook, By Country (2021-2030) ($MN)
53 Asia Pacific Agricultural Tires Market Outlook, By Tire Type (2021-2030) ($MN)
54 Asia Pacific Agricultural Tires Market Outlook, By Bias Tires (2021-2030) ($MN)
55 Asia Pacific Agricultural Tires Market Outlook, By Radial Tires (2021-2030) ($MN)
56 Asia Pacific Agricultural Tires Market Outlook, By Equipment Horsepower (2021-2030) ($MN)
57 Asia Pacific Agricultural Tires Market Outlook, By 0-80 HP (2021-2030) ($MN)
58 Asia Pacific Agricultural Tires Market Outlook, By 81-200 HP (2021-2030) ($MN)
59 Asia Pacific Agricultural Tires Market Outlook, By Sale Channel (2021-2030) ($MN)
60 Asia Pacific Agricultural Tires Market Outlook, By OEM (2021-2030) ($MN)
61 Asia Pacific Agricultural Tires Market Outlook, By Replacement/Aftermarket (2021-2030) ($MN)
62 Asia Pacific Agricultural Tires Market Outlook, By Application (2021-2030) ($MN)
63 Asia Pacific Agricultural Tires Market Outlook, By Tractors (2021-2030) ($MN)
64 Asia Pacific Agricultural Tires Market Outlook, By Combine Harvesters (2021-2030) ($MN)
65 Asia Pacific Agricultural Tires Market Outlook, By Sprayers (2021-2030) ($MN)
66 Asia Pacific Agricultural Tires Market Outlook, By Trailers (2021-2030) ($MN)
67 Asia Pacific Agricultural Tires Market Outlook, By Loaders (2021-2030) ($MN)
68 Asia Pacific Agricultural Tires Market Outlook, By Other Applications (2021-2030) ($MN)
69 South America Agricultural Tires Market Outlook, By Country (2021-2030) ($MN)
70 South America Agricultural Tires Market Outlook, By Tire Type (2021-2030) ($MN)
71 South America Agricultural Tires Market Outlook, By Bias Tires (2021-2030) ($MN)
72 South America Agricultural Tires Market Outlook, By Radial Tires (2021-2030) ($MN)
73 South America Agricultural Tires Market Outlook, By Equipment Horsepower (2021-2030) ($MN)
74 South America Agricultural Tires Market Outlook, By 0-80 HP (2021-2030) ($MN)
75 South America Agricultural Tires Market Outlook, By 81-200 HP (2021-2030) ($MN)
76 South America Agricultural Tires Market Outlook, By Sale Channel (2021-2030) ($MN)
77 South America Agricultural Tires Market Outlook, By OEM (2021-2030) ($MN)
78 South America Agricultural Tires Market Outlook, By Replacement/Aftermarket (2021-2030) ($MN)
79 South America Agricultural Tires Market Outlook, By Application (2021-2030) ($MN)
80 South America Agricultural Tires Market Outlook, By Tractors (2021-2030) ($MN)
81 South America Agricultural Tires Market Outlook, By Combine Harvesters (2021-2030) ($MN)
82 South America Agricultural Tires Market Outlook, By Sprayers (2021-2030) ($MN)
83 South America Agricultural Tires Market Outlook, By Trailers (2021-2030) ($MN)
84 South America Agricultural Tires Market Outlook, By Loaders (2021-2030) ($MN)
85 South America Agricultural Tires Market Outlook, By Other Applications (2021-2030) ($MN)
86 Middle East & Africa Agricultural Tires Market Outlook, By Country (2021-2030) ($MN)
87 Middle East & Africa Agricultural Tires Market Outlook, By Tire Type (2021-2030) ($MN)
88 Middle East & Africa Agricultural Tires Market Outlook, By Bias Tires (2021-2030) ($MN)
89 Middle East & Africa Agricultural Tires Market Outlook, By Radial Tires (2021-2030) ($MN)
90 Middle East & Africa Agricultural Tires Market Outlook, By Equipment Horsepower (2021-2030) ($MN)
91 Middle East & Africa Agricultural Tires Market Outlook, By 0-80 HP (2021-2030) ($MN)
92 Middle East & Africa Agricultural Tires Market Outlook, By 81-200 HP (2021-2030) ($MN)
93 Middle East & Africa Agricultural Tires Market Outlook, By Sale Channel (2021-2030) ($MN)
94 Middle East & Africa Agricultural Tires Market Outlook, By OEM (2021-2030) ($MN)
95 Middle East & Africa Agricultural Tires Market Outlook, By Replacement/Aftermarket (2021-2030) ($MN)
96 Middle East & Africa Agricultural Tires Market Outlook, By Application (2021-2030) ($MN)
97 Middle East & Africa Agricultural Tires Market Outlook, By Tractors (2021-2030) ($MN)
98 Middle East & Africa Agricultural Tires Market Outlook, By Combine Harvesters (2021-2030) ($MN)
99 Middle East & Africa Agricultural Tires Market Outlook, By Sprayers (2021-2030) ($MN)
100 Middle East & Africa Agricultural Tires Market Outlook, By Trailers (2021-2030) ($MN)
101 Middle East & Africa Agricultural Tires Market Outlook, By Loaders (2021-2030) ($MN)
102 Middle East & Africa Agricultural Tires Market Outlook, By Other Applications (2021-2030) ($MN)
List of Figures
RESEARCH METHODOLOGY

We at ‘Stratistics’ opt for an extensive research approach which involves data mining, data validation, and data analysis. The various research sources include in-house repository, secondary research, competitor’s sources, social media research, client internal data, and primary research.
Our team of analysts prefers the most reliable and authenticated data sources in order to perform the comprehensive literature search. With access to most of the authenticated data bases our team highly considers the best mix of information through various sources to obtain extensive and accurate analysis.
Each report takes an average time of a month and a team of 4 industry analysts. The time may vary depending on the scope and data availability of the desired market report. The various parameters used in the market assessment are standardized in order to enhance the data accuracy.
Data Mining
The data is collected from several authenticated, reliable, paid and unpaid sources and is filtered depending on the scope & objective of the research. Our reports repository acts as an added advantage in this procedure. Data gathering from the raw material suppliers, distributors and the manufacturers is performed on a regular basis, this helps in the comprehensive understanding of the products value chain. Apart from the above mentioned sources the data is also collected from the industry consultants to ensure the objective of the study is in the right direction.
Market trends such as technological advancements, regulatory affairs, market dynamics (Drivers, Restraints, Opportunities and Challenges) are obtained from scientific journals, market related national & international associations and organizations.
Data Analysis
From the data that is collected depending on the scope & objective of the research the data is subjected for the analysis. The critical steps that we follow for the data analysis include:
- Product Lifecycle Analysis
- Competitor analysis
- Risk analysis
- Porters Analysis
- PESTEL Analysis
- SWOT Analysis
The data engineering is performed by the core industry experts considering both the Marketing Mix Modeling and the Demand Forecasting. The marketing mix modeling makes use of multiple-regression techniques to predict the optimal mix of marketing variables. Regression factor is based on a number of variables and how they relate to an outcome such as sales or profits.
Data Validation
The data validation is performed by the exhaustive primary research from the expert interviews. This includes telephonic interviews, focus groups, face to face interviews, and questionnaires to validate our research from all aspects. The industry experts we approach come from the leading firms, involved in the supply chain ranging from the suppliers, distributors to the manufacturers and consumers so as to ensure an unbiased analysis.
We are in touch with more than 15,000 industry experts with the right mix of consultants, CEO's, presidents, vice presidents, managers, experts from both supply side and demand side, executives and so on.
The data validation involves the primary research from the industry experts belonging to:
- Leading Companies
- Suppliers & Distributors
- Manufacturers
- Consumers
- Industry/Strategic Consultants
Apart from the data validation the primary research also helps in performing the fill gap research, i.e. providing solutions for the unmet needs of the research which helps in enhancing the reports quality.
For more details about research methodology, kindly write to us at info@strategymrc.com
Frequently Asked Questions
In case of any queries regarding this report, you can contact the customer service by filing the “Inquiry Before Buy” form available on the right hand side. You may also contact us through email: info@strategymrc.com or phone: +1-301-202-5929
Yes, the samples are available for all the published reports. You can request them by filling the “Request Sample” option available in this page.
Yes, you can request a sample with your specific requirements. All the customized samples will be provided as per the requirement with the real data masked.
All our reports are available in Digital PDF format. In case if you require them in any other formats, such as PPT, Excel etc you can submit a request through “Inquiry Before Buy” form available on the right hand side. You may also contact us through email: info@strategymrc.com or phone: +1-301-202-5929
We offer a free 15% customization with every purchase. This requirement can be fulfilled for both pre and post sale. You may send your customization requirements through email at info@strategymrc.com or call us on +1-301-202-5929.
We have 3 different licensing options available in electronic format.
- Single User Licence: Allows one person, typically the buyer, to have access to the ordered product. The ordered product cannot be distributed to anyone else.
- 2-5 User Licence: Allows the ordered product to be shared among a maximum of 5 people within your organisation.
- Corporate License: Allows the product to be shared among all employees of your organisation regardless of their geographical location.
All our reports are typically be emailed to you as an attachment.
To order any available report you need to register on our website. The payment can be made either through CCAvenue or PayPal payments gateways which accept all international cards.
We extend our support to 6 months post sale. A post sale customization is also provided to cover your unmet needs in the report.
Request Customization
We offer complimentary customization of up to 15% with every purchase. To share your customization requirements, feel free to email us at info@strategymrc.com or call us on +1-301-202-5929. .
Please Note: Customization within the 15% threshold is entirely free of charge. If your request exceeds this limit, we will conduct a feasibility assessment. Following that, a detailed quote and timeline will be provided.
WHY CHOOSE US ?

Assured Quality
Best in class reports with high standard of research integrity

24X7 Research Support
Continuous support to ensure the best customer experience.

Free Customization
Adding more values to your product of interest.

Safe & Secure Access
Providing a secured environment for all online transactions.

Trusted by 600+ Brands
Serving the most reputed brands across the world.