
Ai In Power Grid Management Market
AI in Power Grid Management Market Forecasts to 2034 - Global Analysis By Solution Type (Software & Platforms, and Services), Technology (Machine Learning (ML) & Deep Learning (DL), Natural Language Processing (NLP), Computer Vision, and Predictive Analytics & Prescriptive Analytics), Application, End User, and By Geography

|
Years Covered |
2023-2034 |
|
Estimated Year Value (2026) |
US $5.7 BN |
|
Projected Year Value (2032) |
US $28.9 BN |
|
CAGR (2026-2032) |
22.5% |
|
Regions Covered |
North America, Europe, Asia Pacific, South America, and Middle East & Africa |
|
Countries Covered |
US, Canada, Mexico, Germany, UK, Italy, France, Spain, Japan, China, India, Australia, New Zealand, South Korea, Rest of Asia Pacific, South America, Argentina, Brazil, Chile, Middle East & Africa, Saudi Arabia, UAE, Qatar, and South Africa |
|
Largest Market |
North America |
|
Highest Growing Market |
Asia Pacific |
According to Stratistics MRC, the Global AI in Power Grid Management Market is accounted for $5.7 billion in 2026 and is expected to reach $28.9 billion by 2034 growing at a CAGR of 22.5% during the forecast period. The AI in power grid management focuses on applying artificial intelligence and advanced analytics to optimize generation, transmission, and distribution operations. It includes software platforms for demand forecasting, fault detection, predictive maintenance, energy balancing, and asset optimization. Growth is driven by increasing grid complexity, rising renewable integration, the need for real-time decision-making, pressure to improve reliability and resilience, and utilities’ efforts to reduce operating costs through automation and data-driven grid intelligence.
Market Dynamics:
Driver:
Aging grid infrastructure and the need for predictive maintenance to prevent outages
Utility providers are increasingly turning to AI-driven predictive maintenance to transition from reactive repairs to proactive asset management. By analyzing real-time data from IoT sensors, AI algorithms can identify subtle thermal anomalies or mechanical stresses in transformers and transmission lines before they lead to catastrophic failures. This technological shift significantly reduces downtime and extends the operational lifespan of critical equipment, ensuring grid stability in an era where power reliability is the backbone of the digital economy.
Restraint:
High initial investment and integration complexity with legacy grid systems
Modernizing a grid involves more than just software; it requires extensive hardware upgrades, including specialized sensors and edge computing nodes, which can be cost-prohibitive for smaller utilities. Furthermore, integrating advanced AI platforms with antiquated legacy systems often reveals deep-seated interoperability issues. The lack of standardized data protocols across diverse regional grids complicates the scaling of AI solutions, leading to prolonged implementation timelines and increased technical debt for organizations attempting to bridge the analog-to-digital divide.
Opportunity:
AI-powered energy trading and real-time pricing optimization for utilities and prosumers
Agentic AI systems are now capable of executing semi-autonomous trades by forecasting localized demand and supply fluctuations with hyper-accuracy. These platforms optimize real-time pricing, allowing utilities to balance the grid dynamically while enabling prosumers to sell excess energy at peak value. By leveraging foundation models that integrate weather patterns and geopolitical shifts, AI-powered trading desks are maximizing the efficiency of decentralized energy markets, turning grid flexibility into a high-margin financial asset for all stakeholders involved.
Threat:
Cybersecurity attacks targeting AI-driven grid control systems
As power grids become increasingly software-defined, they present a more expansive and attractive target for sophisticated cyber adversaries. The primary threat stems from AI-powered malware that can autonomously scan for vulnerabilities and adapt its code to bypass traditional signature-based defenses. These attacks specifically target the intersection of IT and Operational Technology (OT), aiming to manipulate sensors or trigger cascading outages through automated exploits. The convergence of grid controls and cloud-based AI platforms creates new entry points, forcing utilities to invest heavily in "defensive AI" to counter the speed and scale of industrialized, automated cyber campaigns.
Covid-19 Impact:
The COVID-19 pandemic served as a pivotal catalyst for digital acceleration within the power sector. Initially, lockdowns caused a 20% slump in industrial energy demand, yet the sudden shift to remote work surged residential loads, highlighting the need for flexible grid management. This volatility exposed the limitations of manual forecasting, driving utilities to adopt AI-based remote monitoring and virtual maintenance tools. Post-pandemic, the emphasis on "building back greener" significantly increased investment in AI to manage the rapid, large-scale integration of renewable energy sources.
The software & platforms segment is expected to be the largest during the forecast period
The software & platforms segment is expected to account for the largest market share during the forecast period. This dominance is driven by the essential role that end-to-end AI platforms play in processing the massive volumes of data generated by smart meters and grid sensors. The market is shifting toward user-friendly, low-code solutions that allow non-data scientists to train and deploy models for load forecasting and anomaly detection. As utilities prioritize digital orchestration over physical hardware upgrades to achieve efficiency, the high-margin software segment continues to attract the majority of sector investment.
The renewable energy generators segment is expected to have the highest CAGR during the forecast period
Over the forecast period, the renewable energy generators segment is predicted to witness the highest growth rate. The inherent intermittency of solar and wind power necessitates the use of advanced AI to ensure grid stability and efficient storage management. As global mandates for decarbonization intensify, renewable generators are rapidly adopting AI-driven forecasting tools to predict energy output with sub-hourly precision. This rapid adoption is fueled by the need to minimize "curtailment," where excess green energy is wasted, thereby ensuring that the expanding fleet of renewable assets remains economically viable and operationally reliable.
Region with largest share:
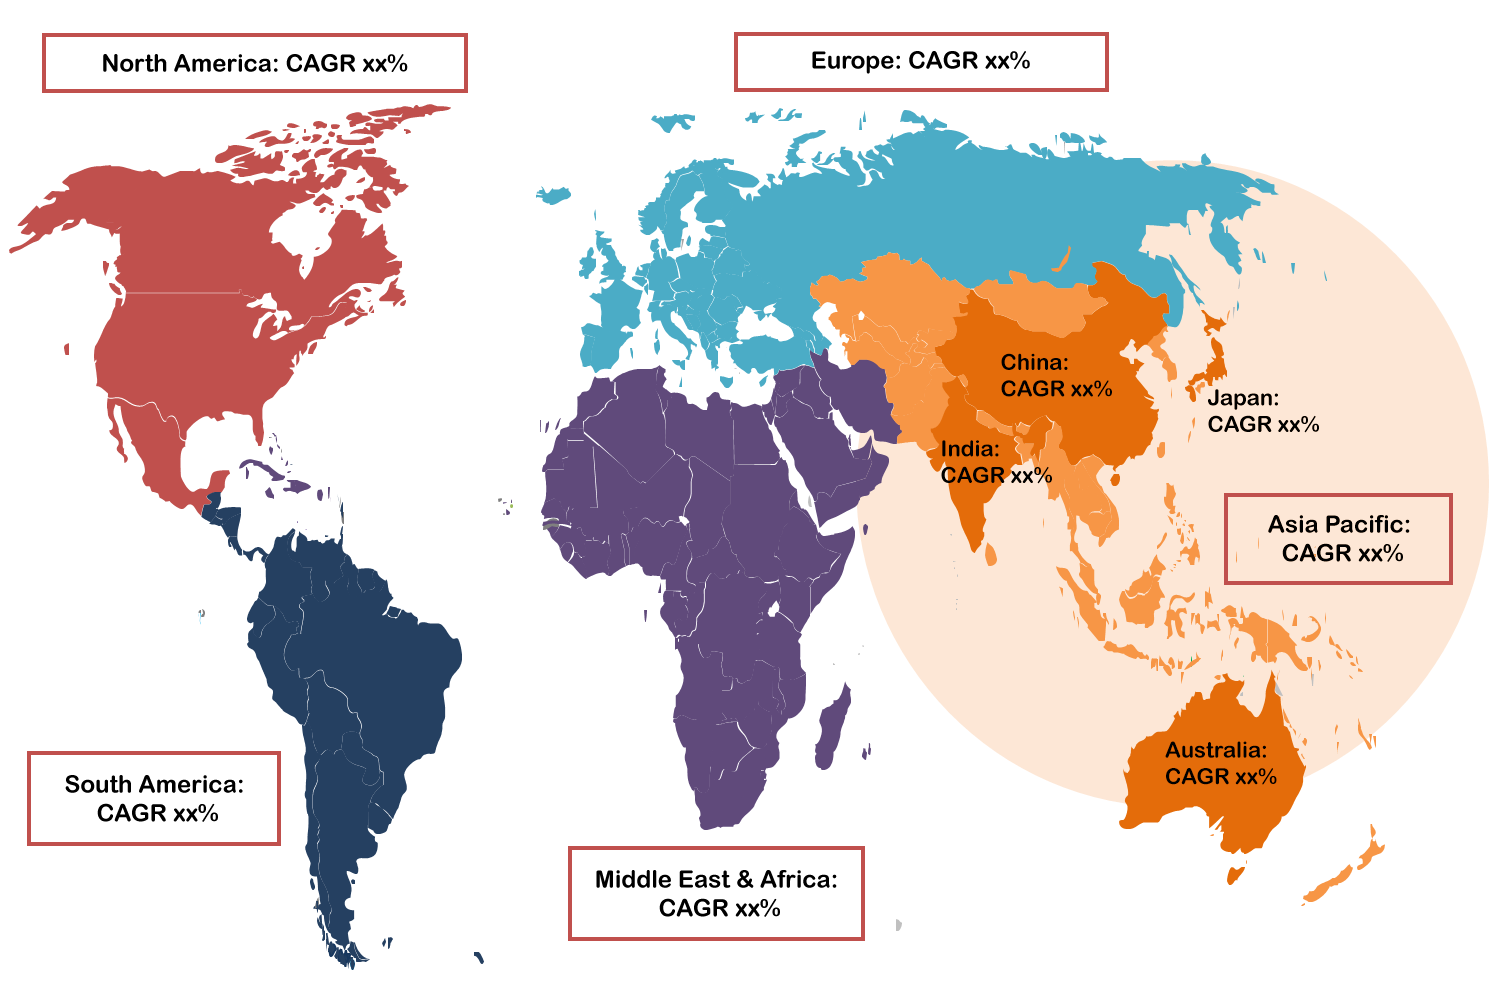
During the forecast period, the North America region is expected to hold the largest market share. This leadership is underpinned by the region's concentrated cluster of hyperscale data centers and a robust ecosystem of AI technology providers. The U.S., in particular, is witnessing a monumental surge in grid investment to support the "power wall" created by large-scale AI model training. With Virginia and Texas leading in gigawatt-scale projects, the regional focus is on deploying AI to optimize existing transmission capacity and manage the intense, near-continuous loads required by the next generation of computational infrastructure.
Region with highest CAGR:
Over the forecast period, the Asia Pacific region is anticipated to exhibit the highest CAGR. This accelerated growth is primarily attributed to the massive digital transformation occurring across China, India, and Southeast Asia. These nations are leapfrogging traditional infrastructure by building "smart from the start," integrating AI directly into new distribution networks. Government mandates for grid digitization, combined with the world’s largest deployments of advanced metering infrastructure, are creating a data-rich environment. This enables the rapid scaling of AI applications for energy theft detection and rural electrification, positioning the region as the most dynamic growth hub.
Key players in the market
Some of the key players in AI in Power Grid Management Market include Siemens, General Electric (GE Vernova), Schneider Electric, ABB Ltd., Hitachi Energy, Oracle, IBM, Cisco Systems, AutoGrid Systems, Opus One Solutions, GridBeyond, Enel X, Wärtsilä, Eaton Corporation, and S&C Electric Company.
Key Developments:
In December 2025, Siemens Energy announced deployment of AI-driven grid monitoring systems in Germany, enhancing predictive maintenance.
In October 2025, GE Vernova partnered with National Grid UK to implement AI-based demand forecasting tools.
In July 2025, Schneider Electric launched its EcoStruxure Grid AI suite, enabling utilities to optimize distributed energy resources.
In May 2025, Atomic Canyon secured $7 million in funding to develop AI solutions specifically for nuclear documentation and grid workflow optimization.
Solution Types Covered:
• Software & Platforms
• Services
Technologies Covered:
• Machine Learning (ML) & Deep Learning (DL)
• Natural Language Processing (NLP)
• Computer Vision
• Predictive Analytics & Prescriptive Analytics
Applications Covered:
• Grid Asset Management
• Grid Analytics
• Power Flow & Optimization
• Grid Security
• Autonomous Operations & Control
• Other Applications
End Users Covered:
• Grid Operators
• Utility Companies
• Energy Traders & Retailers
• Renewable Energy Generators
• Industrial & Commercial Consumers
Regions Covered:
• North America
o US
o Canada
o Mexico
• Europe
o Germany
o UK
o Italy
o France
o Spain
o Rest of Europe
• Asia Pacific
o Japan
o China
o India
o Australia
o New Zealand
o South Korea
o Rest of Asia Pacific
• South America
o Argentina
o Brazil
o Chile
o Rest of South America
• Middle East & Africa
o Saudi Arabia
o UAE
o Qatar
o South Africa
o Rest of Middle East & Africa
What our report offers:
- Market share assessments for the regional and country-level segments
- Strategic recommendations for the new entrants
- Covers Market data for the years 2023, 2024, 2025, 2026, 2027, 2028, 2030, 2032 and 2034
- Market Trends (Drivers, Constraints, Opportunities, Threats, Challenges, Investment Opportunities, and recommendations)
- Strategic recommendations in key business segments based on the market estimations
- Competitive landscaping mapping the key common trends
- Company profiling with detailed strategies, financials, and recent developments
- Supply chain trends mapping the latest technological advancements
Free Customization Offerings:
All the customers of this report will be entitled to receive one of the following free customization options:
• Company Profiling
o Comprehensive profiling of additional market players (up to 3)
o SWOT Analysis of key players (up to 3)
• Regional Segmentation
o Market estimations, Forecasts and CAGR of any prominent country as per the client's interest (Note: Depends on feasibility check)
• Competitive Benchmarking
o Benchmarking of key players based on product portfolio, geographical presence, and strategic alliances
Table of Contents
1 Executive Summary
2 Preface
2.1 Abstract
2.2 Stake Holders
2.3 Research Scope
2.4 Research Methodology
2.4.1 Data Mining
2.4.2 Data Analysis
2.4.3 Data Validation
2.4.4 Research Approach
2.5 Research Sources
2.5.1 Primary Research Sources
2.5.2 Secondary Research Sources
2.5.3 Assumptions
3 Market Trend Analysis
3.1 Introduction
3.2 Drivers
3.3 Restraints
3.4 Opportunities
3.5 Threats
3.6 Technology Analysis
3.7 Application Analysis
3.8 End User Analysis
3.9 Emerging Markets
3.10 Impact of Covid-19
4 Porters Five Force Analysis
4.1 Bargaining power of suppliers
4.2 Bargaining power of buyers
4.3 Threat of substitutes
4.4 Threat of new entrants
4.5 Competitive rivalry
5 Global AI in Power Grid Management Market, By Solution Type
5.1 Introduction
5.2 Software & Platforms
5.3 Services
5.3.1 Integration & Deployment
5.3.2 Support & Maintenance
5.3.3 Consulting & Training
6 Global AI in Power Grid Management Market, By Technology
6.1 Introduction
6.2 Machine Learning (ML) & Deep Learning (DL)
6.3 Natural Language Processing (NLP)
6.4 Computer Vision
6.5 Predictive Analytics & Prescriptive Analytics
7 Global AI in Power Grid Management Market, By Application
7.1 Introduction
7.2 Grid Asset Management
7.2.1 Predictive Maintenance
7.2.2 Fault Detection & Diagnosis
7.2.3 Asset Performance Optimization
7.3 Grid Analytics
7.3.1 Load Forecasting
7.3.2 Renewable Energy Forecasting
7.3.3 Demand Response Management
7.4 Power Flow & Optimization
7.4.1 Dynamic Line Rating
7.4.2 Topology Optimization
7.4.3 Volt/VAR Optimization
7.5 Grid Security
7.5.1 Anomaly & Intrusion Detection
7.5.2 Cybersecurity Threat Intelligence
7.6 Autonomous Operations & Control
7.6.1 Self-healing Grids
7.6.2 Automated Dispatch & Control
7.7 Other Applications
8 Global AI in Power Grid Management Market, By End User
8.1 Introduction
8.2 Grid Operators
8.3 Utility Companies
8.4 Energy Traders & Retailers
8.5 Renewable Energy Generators
8.6 Industrial & Commercial Consumers
9 Global AI in Power Grid Management Market, By Geography
9.1 Introduction
9.2 North America
9.2.1 US
9.2.2 Canada
9.2.3 Mexico
9.3 Europe
9.3.1 Germany
9.3.2 UK
9.3.3 Italy
9.3.4 France
9.3.5 Spain
9.3.6 Rest of Europe
9.4 Asia Pacific
9.4.1 Japan
9.4.2 China
9.4.3 India
9.4.4 Australia
9.4.5 New Zealand
9.4.6 South Korea
9.4.7 Rest of Asia Pacific
9.5 South America
9.5.1 Argentina
9.5.2 Brazil
9.5.3 Chile
9.5.4 Rest of South America
9.6 Middle East & Africa
9.6.1 Saudi Arabia
9.6.2 UAE
9.6.3 Qatar
9.6.4 South Africa
9.6.5 Rest of Middle East & Africa
10 Key Developments
10.1 Agreements, Partnerships, Collaborations and Joint Ventures
10.2 Acquisitions & Mergers
10.3 New Product Launch
10.4 Expansions
10.5 Other Key Strategies
11 Company Profiling
11.1 Siemens
11.2 General Electric (GE Vernova)
11.3 Schneider Electric
11.4 ABB Ltd.
11.5 Hitachi Energy
11.6 Oracle
11.7 IBM
11.8 Cisco Systems
11.9 AutoGrid Systems
11.10 Opus One Solutions
11.11 GridBeyond
11.12 Enel X
11.13 Wärtsilä
11.14 Eaton Corporation
11.15 S&C Electric Company
List of Tables
1 Global AI in Power Grid Management Market Outlook, By Region (2023–2034) ($MN)
2 Global AI in Power Grid Management Market Outlook, By Solution Type (2023–2034) ($MN)
3 Global AI in Power Grid Management Market Outlook, By Software & Platforms (2023–2034) ($MN)
4 Global AI in Power Grid Management Market Outlook, By Services (2023–2034) ($MN)
5 Global AI in Power Grid Management Market Outlook, By Integration & Deployment (2023–2034) ($MN)
6 Global AI in Power Grid Management Market Outlook, By Support & Maintenance (2023–2034) ($MN)
7 Global AI in Power Grid Management Market Outlook, By Consulting & Training (2023–2034) ($MN)
8 Global AI in Power Grid Management Market Outlook, By Technology (2023–2034) ($MN)
9 Global AI in Power Grid Management Market Outlook, By Machine Learning & Deep Learning (2023–2034) ($MN)
10 Global AI in Power Grid Management Market Outlook, By Natural Language Processing (2023–2034) ($MN)
11 Global AI in Power Grid Management Market Outlook, By Computer Vision (2023–2034) ($MN)
12 Global AI in Power Grid Management Market Outlook, By Predictive & Prescriptive Analytics (2023–2034) ($MN)
13 Global AI in Power Grid Management Market Outlook, By Application (2023–2034) ($MN)
14 Global AI in Power Grid Management Market Outlook, By Predictive Maintenance (2023–2034) ($MN)
15 Global AI in Power Grid Management Market Outlook, By Fault Detection & Diagnosis (2023–2034) ($MN)
16 Global AI in Power Grid Management Market Outlook, By Asset Performance Optimization (2023–2034) ($MN)
17 Global AI in Power Grid Management Market Outlook, By Load Forecasting (2023–2034) ($MN)
18 Global AI in Power Grid Management Market Outlook, By Renewable Energy Forecasting (2023–2034) ($MN)
19 Global AI in Power Grid Management Market Outlook, By Demand Response Management (2023–2034) ($MN)
20 Global AI in Power Grid Management Market Outlook, By Dynamic Line Rating (2023–2034) ($MN)
21 Global AI in Power Grid Management Market Outlook, By Topology Optimization (2023–2034) ($MN)
22 Global AI in Power Grid Management Market Outlook, By Volt / VAR Optimization (2023–2034) ($MN)
23 Global AI in Power Grid Management Market Outlook, By Anomaly & Intrusion Detection (2023–2034) ($MN)
24 Global AI in Power Grid Management Market Outlook, By Cybersecurity Threat Intelligence (2023–2034) ($MN)
25 Global AI in Power Grid Management Market Outlook, By Self-healing Grids (2023–2034) ($MN)
26 Global AI in Power Grid Management Market Outlook, By Automated Dispatch & Control (2023–2034) ($MN)
27 Global AI in Power Grid Management Market Outlook, By Other Applications (2023–2034) ($MN)
28 Global AI in Power Grid Management Market Outlook, By End User (2023–2034) ($MN)
29 Global AI in Power Grid Management Market Outlook, By Grid Operators (2023–2034) ($MN)
30 Global AI in Power Grid Management Market Outlook, By Utility Companies (2023–2034) ($MN)
31 Global AI in Power Grid Management Market Outlook, By Energy Traders & Retailers (2023–2034) ($MN)
32 Global AI in Power Grid Management Market Outlook, By Renewable Energy Generators (2023–2034) ($MN)
33 Global AI in Power Grid Management Market Outlook, By Industrial & Commercial Consumers (2023–2034) ($MN)
Note: Tables for North America, Europe, APAC, South America, and Middle East & Africa Regions are also represented in the same manner as above.
List of Figures
RESEARCH METHODOLOGY

We at ‘Stratistics’ opt for an extensive research approach which involves data mining, data validation, and data analysis. The various research sources include in-house repository, secondary research, competitor’s sources, social media research, client internal data, and primary research.
Our team of analysts prefers the most reliable and authenticated data sources in order to perform the comprehensive literature search. With access to most of the authenticated data bases our team highly considers the best mix of information through various sources to obtain extensive and accurate analysis.
Each report takes an average time of a month and a team of 4 industry analysts. The time may vary depending on the scope and data availability of the desired market report. The various parameters used in the market assessment are standardized in order to enhance the data accuracy.
Data Mining
The data is collected from several authenticated, reliable, paid and unpaid sources and is filtered depending on the scope & objective of the research. Our reports repository acts as an added advantage in this procedure. Data gathering from the raw material suppliers, distributors and the manufacturers is performed on a regular basis, this helps in the comprehensive understanding of the products value chain. Apart from the above mentioned sources the data is also collected from the industry consultants to ensure the objective of the study is in the right direction.
Market trends such as technological advancements, regulatory affairs, market dynamics (Drivers, Restraints, Opportunities and Challenges) are obtained from scientific journals, market related national & international associations and organizations.
Data Analysis
From the data that is collected depending on the scope & objective of the research the data is subjected for the analysis. The critical steps that we follow for the data analysis include:
- Product Lifecycle Analysis
- Competitor analysis
- Risk analysis
- Porters Analysis
- PESTEL Analysis
- SWOT Analysis
The data engineering is performed by the core industry experts considering both the Marketing Mix Modeling and the Demand Forecasting. The marketing mix modeling makes use of multiple-regression techniques to predict the optimal mix of marketing variables. Regression factor is based on a number of variables and how they relate to an outcome such as sales or profits.
Data Validation
The data validation is performed by the exhaustive primary research from the expert interviews. This includes telephonic interviews, focus groups, face to face interviews, and questionnaires to validate our research from all aspects. The industry experts we approach come from the leading firms, involved in the supply chain ranging from the suppliers, distributors to the manufacturers and consumers so as to ensure an unbiased analysis.
We are in touch with more than 15,000 industry experts with the right mix of consultants, CEO's, presidents, vice presidents, managers, experts from both supply side and demand side, executives and so on.
The data validation involves the primary research from the industry experts belonging to:
- Leading Companies
- Suppliers & Distributors
- Manufacturers
- Consumers
- Industry/Strategic Consultants
Apart from the data validation the primary research also helps in performing the fill gap research, i.e. providing solutions for the unmet needs of the research which helps in enhancing the reports quality.
For more details about research methodology, kindly write to us at info@strategymrc.com
Frequently Asked Questions
In case of any queries regarding this report, you can contact the customer service by filing the “Inquiry Before Buy” form available on the right hand side. You may also contact us through email: info@strategymrc.com or phone: +1-301-202-5929
Yes, the samples are available for all the published reports. You can request them by filling the “Request Sample” option available in this page.
Yes, you can request a sample with your specific requirements. All the customized samples will be provided as per the requirement with the real data masked.
All our reports are available in Digital PDF format. In case if you require them in any other formats, such as PPT, Excel etc you can submit a request through “Inquiry Before Buy” form available on the right hand side. You may also contact us through email: info@strategymrc.com or phone: +1-301-202-5929
We offer a free 15% customization with every purchase. This requirement can be fulfilled for both pre and post sale. You may send your customization requirements through email at info@strategymrc.com or call us on +1-301-202-5929.
We have 3 different licensing options available in electronic format.
- Single User Licence: Allows one person, typically the buyer, to have access to the ordered product. The ordered product cannot be distributed to anyone else.
- 2-5 User Licence: Allows the ordered product to be shared among a maximum of 5 people within your organisation.
- Corporate License: Allows the product to be shared among all employees of your organisation regardless of their geographical location.
All our reports are typically be emailed to you as an attachment.
To order any available report you need to register on our website. The payment can be made either through CCAvenue or PayPal payments gateways which accept all international cards.
We extend our support to 6 months post sale. A post sale customization is also provided to cover your unmet needs in the report.
Request Customization
We offer complimentary customization of up to 15% with every purchase. To share your customization requirements, feel free to email us at info@strategymrc.com or call us on +1-301-202-5929. .
Please Note: Customization within the 15% threshold is entirely free of charge. If your request exceeds this limit, we will conduct a feasibility assessment. Following that, a detailed quote and timeline will be provided.
WHY CHOOSE US ?

Assured Quality
Best in class reports with high standard of research integrity

24X7 Research Support
Continuous support to ensure the best customer experience.

Free Customization
Adding more values to your product of interest.

Safe & Secure Access
Providing a secured environment for all online transactions.

Trusted by 600+ Brands
Serving the most reputed brands across the world.
