
Aviation Lubricants Market
Aviation Lubricants Market Forecasts to 2028 - Global Analysis By Type (Hydraulic Fluid, Special Lubricants, Engine Oil, Additives, Grease, Rubber, Foam, Pneumatic, Timber and Other Types), Platform, Product, Technology, Application, Sales Channel and By Geography

|
Years Covered |
2020-2028 |
|
Estimated Year Value (2022) |
US $2.68 BN |
|
Projected Year Value (2028) |
US $3.84 BN |
|
CAGR (2022 - 2028) |
6.17% |
|
Regions Covered |
North America, Europe, Asia Pacific, South America, and Middle East & Africa |
|
Countries Covered |
US, Canada, Mexico, Germany, UK, Italy, France, Spain, Japan, China, India, Australia, New Zealand, South Korea, Rest of Asia Pacific, South America, Argentina, Brazil, Chile, Middle East & Africa, Saudi Arabia, UAE, Qatar, and South Africa |
|
Largest Market |
North America |
|
Highest Growing Market |
Asia Pacific |
According to Stratistics MRC, the Global Aviation Lubricants Market is accounted for $2.68 billion in 2022 and is expected to reach $3.84 billion by 2028 growing at a CAGR of 6.17% during the forecast period. Lubricants are utilized in order to prevent wear and friction between two moving surfaces or sections of aircrafts. Aviation lubricant is used to lower the friction in an aviation engine. Any type of aircraft must regularly have their lubrication replenished as part of routine maintenance since it is essential to the safe running of the aircraft. Lubricants are substances that enable airplanes to run as effectively and efficiently as possible. An aviation lubricant increases the efficiency and consumes less oil. Major function of lubrication is to clean, cool, and seal to prevent corrosion and overheating.
According to International Civil Aviation Organization (ICAO), 4.3 billion passengers were carried by airlines in the year 2018 which is expected to cross 10.0 billion by the year 2040.
Market Dynamics:
Driver:
Increase in consumption of synthetic lubricants
Synthetic lubricants also offer improved lubricant service life and increased resistance to frictional wear of pricey aviation components. It contains fewer impurities compared to conventional lubricants. The worldwide aviation lubricants market is propelling as a result of the assurance of thermal stability, improved energy economy, higher performances under harsh situations, and resistance to oxidation.
Restraint:
Stringent regulations
The performance requirements for lubricants used in aviation are far greater than those for common lubricants used in other sectors. So, aviation lubricant makers and users must refer to the relevant technical standards for the grade of oil that is advised for use in an engine if they want to market their products to a larger consumer base. The existing product line-up of market participants is anticipated to be impacted by strict emission standards, causing them to expend significant financial and technological efforts.
Opportunity:
Rise in number of airports
Air transportation is considered as the safest mode, when compared with other modes of transportation. The desire for more airports to alleviate the convenience of air travel is also predicted to be fuelled by the projected increase in global population, which fuels the market expansion.
Threat:
High sensitivity to lubricant contamination
Lubricants can get contaminated as a result of poor maintenance procedures and incorrect storage. An aircraft's usage of contaminated lubricant may be fatal, especially for the engine. Some of the common poor maintenance procedures that might cause lubricating fluid contamination include improper oil mixing and service. These elements are hindering the market demand.
Covid-19 Impact
Due to travel bans and government-ordered lockdowns, the COVID-19 pandemic has had an impact on the aviation lubricants business as well as the aviation industry as a whole, which is already one of the worst-hit sectors globally. Also, the expansion of the industry has been impacted by domestic and international flight cancellations. The sector is gradually growing in the post pandemic.
The commercial aviation segment is expected to be the largest during the forecast period
The commercial aviation segment is estimated to have a lucrative growth, due to its boosted productivity. It fosters employment creation, economic expansion, and eases travel and commerce abroad. Higher win rates and improved client retention are the results. It decreases the danger of infringement on intellectual property and speeds up strategic translations. The segment's growth is fuelled by elements including employee retention, efficiency, and safety.
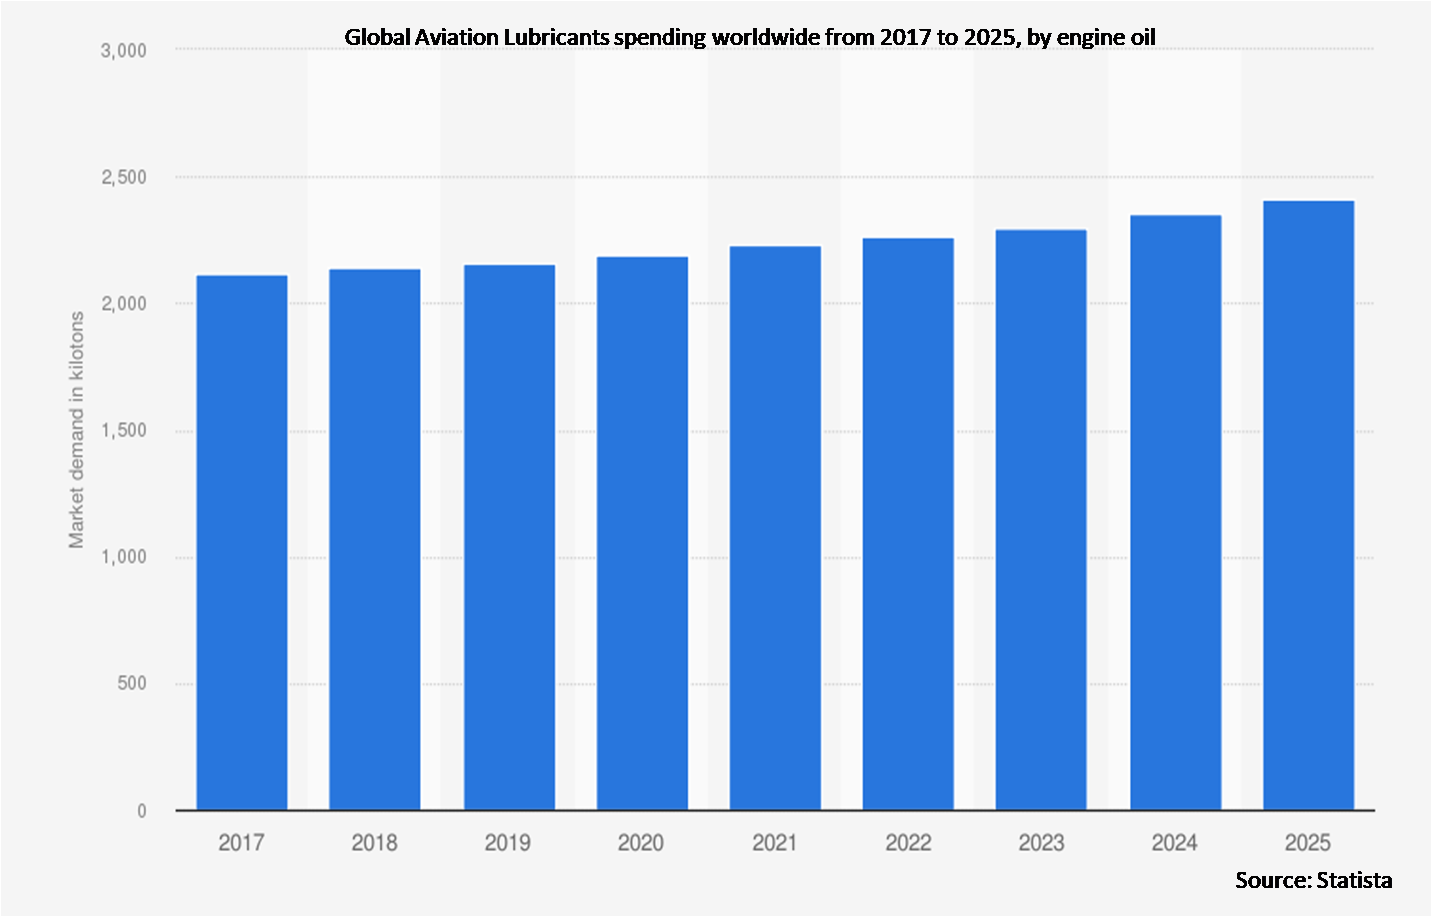
The engine oil segment is expected to have the highest CAGR during the forecast period
The engine oil segment is anticipated to witness the fastest CAGR growth during the forecast period, due to its numerous benefits. Due to its use in engines to keep them lubricated, cool, and free from external pollutants, engine oil is predicted to dominate the industry. Moreover, because engine oils must carefully function within defined parameters to prevent catastrophic failure, their demand is increased by the regular replenishing of engine oils as and when necessary following a flight.
Region with largest share:
North America is projected to hold the largest market share during the forecast period owing to
huge number of airline operators. Low oil costs and increased aircraft operation efficiency in this area are causing the aviation sector to expand. Also, a number of airline operators in this region are concentrating on boosting their profitability through effective utilization of their fleets of aircraft. Rise in the number of flight hours and an expansion of the aircraft fleet is fuelling the market demand in this region.
Region with highest CAGR:
Asia Pacific is projected to have the highest CAGR over the forecast period, owing abundance of aircraft producers. The region is home to some of the leading manufacturers of air deflectors such as 3M and Continental. These market players are hugely investing for the expansion of the market. Throughout the anticipated period, the demand for aviation lubricants for usage in the commercial and general aviation sectors is anticipated to rise in Asia Pacific.

Key players in the market
Some of the key players profiled in the Aviation Lubricants Market include Aerospace Lubricants Inc, Illinois Tool Works Inc, Whitmore Manufacturing LLC, Lanxess AG, Nye Lubricants Inc, Royal Dutch Shell plc, Eastman Chemical Company, Exxon Mobil Corporation, Tecsia Lubricants Pte Ltd, The Chemours Company, Lukoil, Nyco, Crane Aerospace Inc, Zodiac Aerospace, Park Electrochemical Corporation, Phillips 66 Company and Total Group.
Key Developments:
In September 2022, NYCO announced that their ranges of aerospace lubricants have been approved for use on the following Embraer commercial platforms: E-Jets, E-Jets E2 and ERJ145. NYCO and Embraer have collaborated for many years now to offer both higher performance and more affordable lubricants available for use at the São Paulo plant and in-service.
In June 2021, Eastman announced the launch of Eastman Cristal™ One, a portfolio of Resin Identification Code 1 (RIC1) resins engineered to meet the exacting demands of thick-walled packaging for luxury cosmetics. These innovative products are the first RIC1 materials that enable production of transparent jars up to 12 mm in thickness.
Types Covered:
• Hydraulic Fluid
• Special Lubricants
• Engine Oil
• Additives
• Grease
• Rubber
• Foam
• Pneumatic
• Timber
• Other Types
Platforms Covered:
• Commercial Aviation
• Military Aviation
• Business & General Aviation
Products Covered:
• Public
• Private
Technologies Covered:
• Synthetic
• Mineral Based
Applications Covered:
• Engine
• Landing Gear
• Hydraulic Systems
• Airframe
• Other Applications
Sales Channels Covered:
• Aftermarket
• OEM
Regions Covered:
• North America
o US
o Canada
o Mexico
• Europe
o Germany
o UK
o Italy
o France
o Spain
o Rest of Europe
• Asia Pacific
o Japan
o China
o India
o Australia
o New Zealand
o South Korea
o Rest of Asia Pacific
• South America
o Argentina
o Brazil
o Chile
o Rest of South America
• Middle East & Africa
o Saudi Arabia
o UAE
o Qatar
o South Africa
o Rest of Middle East & Africa
What our report offers:
- Market share assessments for the regional and country-level segments
- Strategic recommendations for the new entrants
- Covers Market data for the years 2020, 2021, 2022, 2025, and 2028
- Market Trends (Drivers, Constraints, Opportunities, Threats, Challenges, Investment Opportunities, and recommendations)
- Strategic recommendations in key business segments based on the market estimations
- Competitive landscaping mapping the key common trends
- Company profiling with detailed strategies, financials, and recent developments
- Supply chain trends mapping the latest technological advancements
Free Customization Offerings:
All the customers of this report will be entitled to receive one of the following free customization options:
• Company Profiling
o Comprehensive profiling of additional market players (up to 3)
o SWOT Analysis of key players (up to 3)
• Regional Segmentation
o Market estimations, Forecasts and CAGR of any prominent country as per the client's interest (Note: Depends on feasibility check)
• Competitive Benchmarking
o Benchmarking of key players based on product portfolio, geographical presence, and strategic alliances
Table of Contents
1 Executive Summary
2 Preface
2.1 Abstract
2.2 Stake Holders
2.3 Research Scope
2.4 Research Methodology
2.4.1 Data Mining
2.4.2 Data Analysis
2.4.3 Data Validation
2.4.4 Research Approach
2.5 Research Sources
2.5.1 Primary Research Sources
2.5.2 Secondary Research Sources
2.5.3 Assumptions
3 Market Trend Analysis
3.1 Introduction
3.2 Drivers
3.3 Restraints
3.4 Opportunities
3.5 Threats
3.6 Product Analysis
3.7 Technology Analysis
3.8 Application Analysis
3.9 Emerging Markets
3.10 Impact of Covid-19
4 Porters Five Force Analysis
4.1 Bargaining power of suppliers
4.2 Bargaining power of buyers
4.3 Threat of substitutes
4.4 Threat of new entrants
4.5 Competitive rivalry
5 Global Aviation Lubricants Market, By Type
5.1 Introduction
5.2 Hydraulic Fluid
5.3 Special Lubricants
5.4 Engine Oil
5.5 Additives
5.6 Grease
5.7 Rubber
5.8 Foam
5.9 Pneumatic
5.10 Timber
5.11 Other Types
6 Global Aviation Lubricants Market, By Platform
6.1 Introduction
6.2 Commercial Aviation
6.3 Military Aviation
6.4 Business & General Aviation
7 Global Aviation Lubricants Market, By Product
7.1 Introduction
7.2 Public
7.3 Private
8 Global Aviation Lubricants Market, By Technology
8.1 Introduction
8.2 Synthetic
8.3 Mineral Based
9 Global Aviation Lubricants Market, By Application
9.1 Introduction
9.2 Engine
9.3 Landing Gear
9.4 Hydraulic Systems
9.5 Airframe
9.6 Other Applications
10 Global Aviation Lubricants Market, By Sales Channel
10.1 Introduction
10.2 Aftermarket
10.3 OEM
11 Global Aviation Lubricants Market, By Geography
11.1 Introduction
11.2 North America
11.2.1 US
11.2.2 Canada
11.2.3 Mexico
11.3 Europe
11.3.1 Germany
11.3.2 UK
11.3.3 Italy
11.3.4 France
11.3.5 Spain
11.3.6 Rest of Europe
11.4 Asia Pacific
11.4.1 Japan
11.4.2 China
11.4.3 India
11.4.4 Australia
11.4.5 New Zealand
11.4.6 South Korea
11.4.7 Rest of Asia Pacific
11.5 South America
11.5.1 Argentina
11.5.2 Brazil
11.5.3 Chile
11.5.4 Rest of South America
11.6 Middle East & Africa
11.6.1 Saudi Arabia
11.6.2 UAE
11.6.3 Qatar
11.6.4 South Africa
11.6.5 Rest of Middle East & Africa
12 Key Developments
12.1 Agreements, Partnerships, Collaborations and Joint Ventures
12.2 Acquisitions & Mergers
12.3 New Product Launch
12.4 Expansions
12.5 Other Key Strategies
13 Company Profiling
13.1 Aerospace Lubricants Inc
13.2 Illinois Tool Works Inc
13.3 Whitmore Manufacturing LLC
13.4 Lanxess AG
13.5 Nye Lubricants Inc
13.6 Royal Dutch Shell plc
13.7 Eastman Chemical Company
13.8 Exxon Mobil Corporation
13.9 Tecsia Lubricants Pte Ltd
13.10 The Chemours Company
13.11 Lukoil
13.12 Nyco
13.13 Crane Aerospace Inc
13.14 Zodiac Aerospace
13.15 Park Electrochemical Corporation
13.16 Phillips 66 Company
13.17 Total Group
List of Tables
1 Global Aviation Lubricants Market Outlook, By Region (2020-2028) ($MN)
2 Global Aviation Lubricants Market Outlook, By Type (2020-2028) ($MN)
3 Global Aviation Lubricants Market Outlook, By Hydraulic Fluid (2020-2028) ($MN)
4 Global Aviation Lubricants Market Outlook, By Special Lubricants (2020-2028) ($MN)
5 Global Aviation Lubricants Market Outlook, By Engine Oil (2020-2028) ($MN)
6 Global Aviation Lubricants Market Outlook, By Additives (2020-2028) ($MN)
7 Global Aviation Lubricants Market Outlook, By Grease (2020-2028) ($MN)
8 Global Aviation Lubricants Market Outlook, By Rubber (2020-2028) ($MN)
9 Global Aviation Lubricants Market Outlook, By Foam (2020-2028) ($MN)
10 Global Aviation Lubricants Market Outlook, By Pneumatic (2020-2028) ($MN)
11 Global Aviation Lubricants Market Outlook, By Timber (2020-2028) ($MN)
12 Global Aviation Lubricants Market Outlook, By Other Types (2020-2028) ($MN)
13 Global Aviation Lubricants Market Outlook, By Platform (2020-2028) ($MN)
14 Global Aviation Lubricants Market Outlook, By Commercial Aviation (2020-2028) ($MN)
15 Global Aviation Lubricants Market Outlook, By Military Aviation (2020-2028) ($MN)
16 Global Aviation Lubricants Market Outlook, By Business & General Aviation (2020-2028) ($MN)
17 Global Aviation Lubricants Market Outlook, By Product (2020-2028) ($MN)
18 Global Aviation Lubricants Market Outlook, By Public (2020-2028) ($MN)
19 Global Aviation Lubricants Market Outlook, By Private (2020-2028) ($MN)
20 Global Aviation Lubricants Market Outlook, By Technology (2020-2028) ($MN)
21 Global Aviation Lubricants Market Outlook, By Synthetic (2020-2028) ($MN)
22 Global Aviation Lubricants Market Outlook, By Mineral Based (2020-2028) ($MN)
23 Global Aviation Lubricants Market Outlook, By Application (2020-2028) ($MN)
24 Global Aviation Lubricants Market Outlook, By Engine (2020-2028) ($MN)
25 Global Aviation Lubricants Market Outlook, By Landing Gear (2020-2028) ($MN)
26 Global Aviation Lubricants Market Outlook, By Hydraulic Systems (2020-2028) ($MN)
27 Global Aviation Lubricants Market Outlook, By Airframe (2020-2028) ($MN)
28 Global Aviation Lubricants Market Outlook, By Other Applications (2020-2028) ($MN)
29 Global Aviation Lubricants Market Outlook, By Sales Channel (2020-2028) ($MN)
30 Global Aviation Lubricants Market Outlook, By Aftermarket (2020-2028) ($MN)
31 Global Aviation Lubricants Market Outlook, By OEM (2020-2028) ($MN)
Note: Tables for North America, Europe, APAC, South America, and Middle East & Africa Regions are also represented in the same manner as above.
List of Figures
RESEARCH METHODOLOGY

We at ‘Stratistics’ opt for an extensive research approach which involves data mining, data validation, and data analysis. The various research sources include in-house repository, secondary research, competitor’s sources, social media research, client internal data, and primary research.
Our team of analysts prefers the most reliable and authenticated data sources in order to perform the comprehensive literature search. With access to most of the authenticated data bases our team highly considers the best mix of information through various sources to obtain extensive and accurate analysis.
Each report takes an average time of a month and a team of 4 industry analysts. The time may vary depending on the scope and data availability of the desired market report. The various parameters used in the market assessment are standardized in order to enhance the data accuracy.
Data Mining
The data is collected from several authenticated, reliable, paid and unpaid sources and is filtered depending on the scope & objective of the research. Our reports repository acts as an added advantage in this procedure. Data gathering from the raw material suppliers, distributors and the manufacturers is performed on a regular basis, this helps in the comprehensive understanding of the products value chain. Apart from the above mentioned sources the data is also collected from the industry consultants to ensure the objective of the study is in the right direction.
Market trends such as technological advancements, regulatory affairs, market dynamics (Drivers, Restraints, Opportunities and Challenges) are obtained from scientific journals, market related national & international associations and organizations.
Data Analysis
From the data that is collected depending on the scope & objective of the research the data is subjected for the analysis. The critical steps that we follow for the data analysis include:
- Product Lifecycle Analysis
- Competitor analysis
- Risk analysis
- Porters Analysis
- PESTEL Analysis
- SWOT Analysis
The data engineering is performed by the core industry experts considering both the Marketing Mix Modeling and the Demand Forecasting. The marketing mix modeling makes use of multiple-regression techniques to predict the optimal mix of marketing variables. Regression factor is based on a number of variables and how they relate to an outcome such as sales or profits.
Data Validation
The data validation is performed by the exhaustive primary research from the expert interviews. This includes telephonic interviews, focus groups, face to face interviews, and questionnaires to validate our research from all aspects. The industry experts we approach come from the leading firms, involved in the supply chain ranging from the suppliers, distributors to the manufacturers and consumers so as to ensure an unbiased analysis.
We are in touch with more than 15,000 industry experts with the right mix of consultants, CEO's, presidents, vice presidents, managers, experts from both supply side and demand side, executives and so on.
The data validation involves the primary research from the industry experts belonging to:
- Leading Companies
- Suppliers & Distributors
- Manufacturers
- Consumers
- Industry/Strategic Consultants
Apart from the data validation the primary research also helps in performing the fill gap research, i.e. providing solutions for the unmet needs of the research which helps in enhancing the reports quality.
For more details about research methodology, kindly write to us at info@strategymrc.com
Frequently Asked Questions
In case of any queries regarding this report, you can contact the customer service by filing the “Inquiry Before Buy” form available on the right hand side. You may also contact us through email: info@strategymrc.com or phone: +1-301-202-5929
Yes, the samples are available for all the published reports. You can request them by filling the “Request Sample” option available in this page.
Yes, you can request a sample with your specific requirements. All the customized samples will be provided as per the requirement with the real data masked.
All our reports are available in Digital PDF format. In case if you require them in any other formats, such as PPT, Excel etc you can submit a request through “Inquiry Before Buy” form available on the right hand side. You may also contact us through email: info@strategymrc.com or phone: +1-301-202-5929
We offer a free 15% customization with every purchase. This requirement can be fulfilled for both pre and post sale. You may send your customization requirements through email at info@strategymrc.com or call us on +1-301-202-5929.
We have 3 different licensing options available in electronic format.
- Single User Licence: Allows one person, typically the buyer, to have access to the ordered product. The ordered product cannot be distributed to anyone else.
- 2-5 User Licence: Allows the ordered product to be shared among a maximum of 5 people within your organisation.
- Corporate License: Allows the product to be shared among all employees of your organisation regardless of their geographical location.
All our reports are typically be emailed to you as an attachment.
To order any available report you need to register on our website. The payment can be made either through CCAvenue or PayPal payments gateways which accept all international cards.
We extend our support to 6 months post sale. A post sale customization is also provided to cover your unmet needs in the report.
Request Customization
We offer complimentary customization of up to 15% with every purchase. To share your customization requirements, feel free to email us at info@strategymrc.com or call us on +1-301-202-5929. .
Please Note: Customization within the 15% threshold is entirely free of charge. If your request exceeds this limit, we will conduct a feasibility assessment. Following that, a detailed quote and timeline will be provided.
WHY CHOOSE US ?

Assured Quality
Best in class reports with high standard of research integrity

24X7 Research Support
Continuous support to ensure the best customer experience.

Free Customization
Adding more values to your product of interest.

Safe & Secure Access
Providing a secured environment for all online transactions.

Trusted by 600+ Brands
Serving the most reputed brands across the world.