
Behavioral Phenotyping Ai Market
Behavioral Phenotyping AI Market Forecasts to 2034 - Global Analysis By Solution Type (Mental Health Monitoring, Chronic Disease Monitoring, Cognitive Assessment, Sleep Analysis, Social Behavior Tracking, and Workforce Behavior Analytics), Component, Deployment, Technology, Application, End User, and By Geography

|
Years Covered |
2023-2034 |
|
Estimated Year Value (2026) |
US $9.3 BN |
|
Projected Year Value (2034) |
US $28.1 BN |
|
CAGR (2026 - 2034) |
14.8% |
|
Regions Covered |
North America, Europe, Asia Pacific, South America, and Rest of the World (RoW) |
|
Countries Covered |
United States, Canada, Mexico, United Kingdom, Germany, France, Italy, Spain, Netherlands, Belgium, Sweden, Switzerland, Poland, Rest of Europe, China, Japan, India, South Korea, Australia, Indonesia, Thailand, Malaysia, Singapore, Vietnam, Rest of Asia Pacific, Brazil, Argentina, Colombia, Chile, Peru, Rest of South America, Saudi Arabia, United Arab Emirates, Qatar, Israel, Rest of Middle East, South Africa, Egypt, Morocco, and Rest of Africa. |
|
Largest Market |
North America |
|
Highest Growing Market |
Asia Pacific |
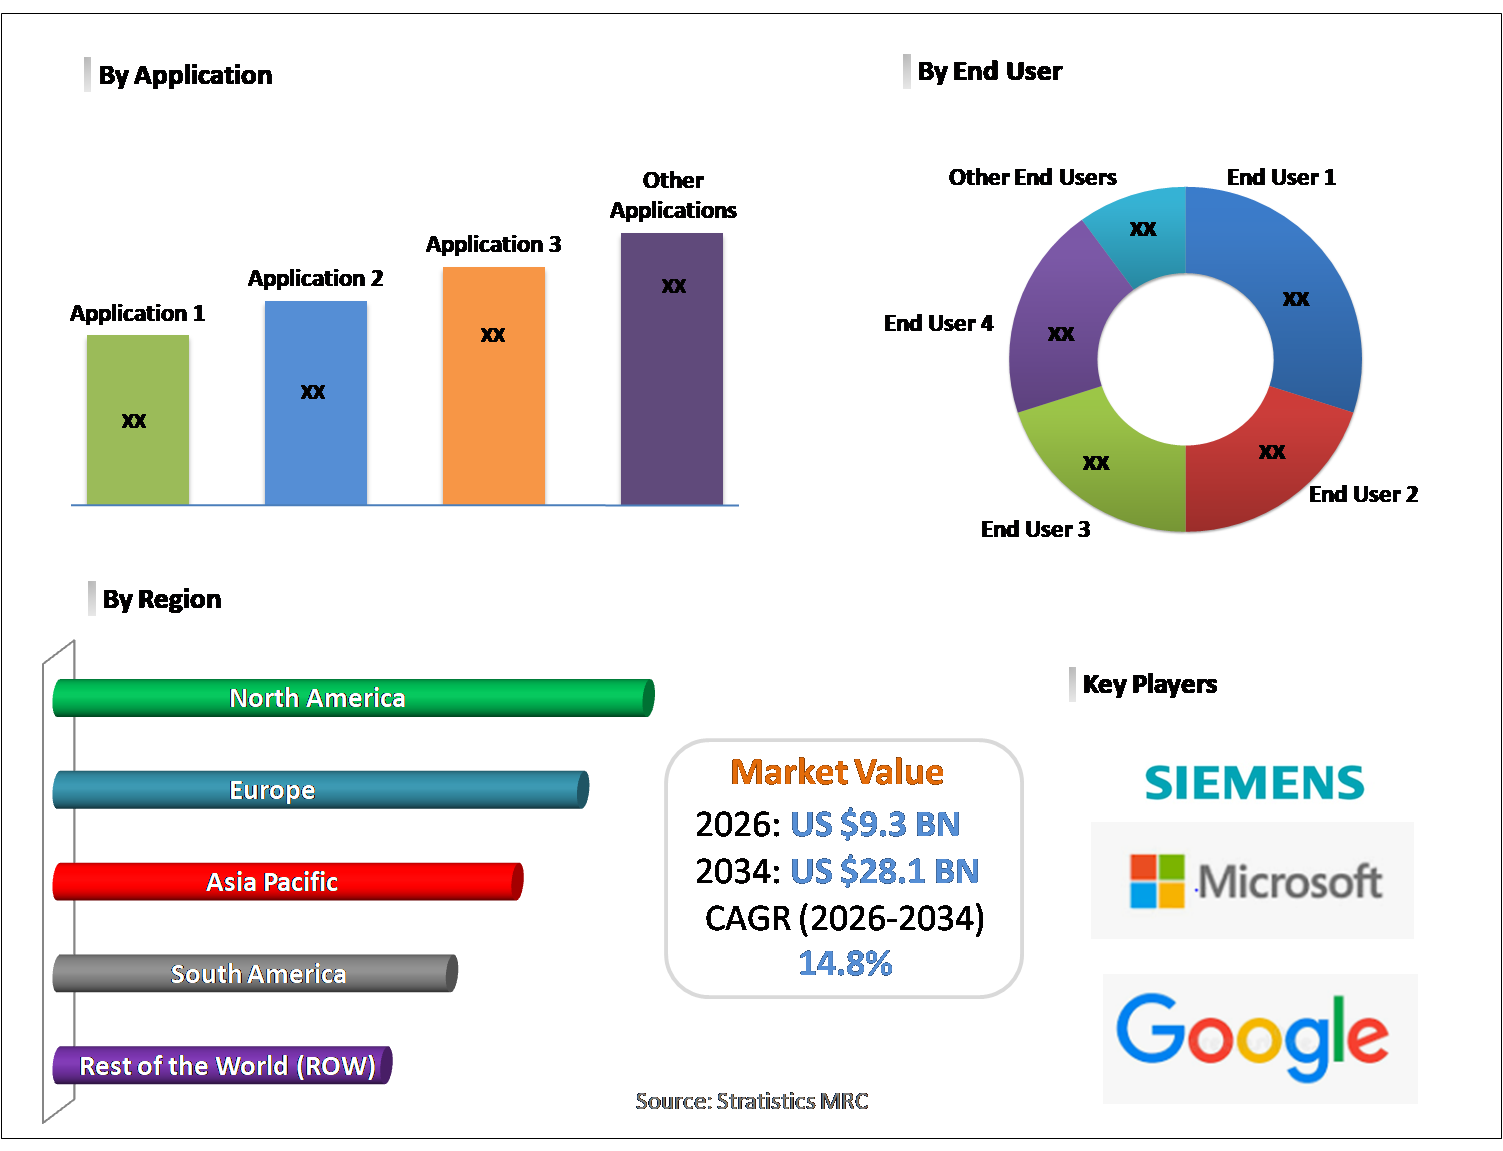
According to Stratistics MRC, the Global Behavioral Phenotyping AI Market is accounted for $9.3 billion in 2026 and is expected to reach $28.1 billion by 2034 growing at a CAGR of 14.8% during the forecast period. Behavioral phenotyping AI refers to artificial intelligence platforms that analyze behavioral data collected from wearables, digital devices, and clinical assessments to identify and characterize patterns linked to mental health, cognitive function, and chronic disease. These systems use machine learning to process physiological signals, movement data, social interactions, and sleep patterns to create detailed behavioral profiles over time. Used in healthcare, research, and workplace wellness, behavioral phenotyping AI supports early diagnosis, continuous monitoring, and personalized therapeutic interventions across diverse patient and user populations.
Market Dynamics:
Driver:
Growing mental health crisis globally
Escalating rates of depression, anxiety, and cognitive disorders worldwide are creating urgent demand for objective behavioral assessment tools. AI behavioral phenotyping enables continuous, passive monitoring that captures behavioral indicators traditional clinical assessments miss. Healthcare systems facing diagnostic bottlenecks benefit from AI-assisted triage and monitoring capabilities. Pharmaceutical companies are leveraging behavioral phenotyping data to accelerate clinical trial recruitment and endpoint measurement. This convergence of healthcare need and technological capability is the primary market growth driver.
Restraint:
Ethical concerns and regulatory uncertainties
Continuous behavioral monitoring raises significant ethical questions about informed consent, data ownership, and potential misuse. Healthcare privacy regulations including HIPAA and GDPR create compliance complexity for behavioral data platforms. Concerns about discriminatory applications in insurance and employment contexts attract regulatory scrutiny. Algorithm bias in behavioral assessment models can perpetuate systemic healthcare disparities. These ethical and regulatory headwinds increase development costs and slow clinical adoption pathways.
Opportunity:
Integration with wearables and digital health platforms
The proliferation of consumer wearables, smartphones, and connected health devices generates rich behavioral data streams for AI phenotyping platforms. Partnerships between behavioral analytics companies and wearable device makers are creating powerful real-world monitoring ecosystems. Digital biomarker discovery from passive behavioral data is transforming clinical research methodologies. Employer wellness programs are integrating behavioral monitoring with broader health engagement platforms. This convergence of consumer technology and clinical behavioral science opens substantial new market opportunities.
Threat:
Consumer and patient backlash
Growing public awareness of AI behavioral monitoring applications is generating consumer backlash and advocacy for stronger regulatory protections. High-profile controversies around emotion recognition and behavioral tracking have prompted calls for outright bans in some jurisdictions. Employee resistance to workplace behavioral monitoring creates legal and labor relations risks for corporate adopters. Academic debates about the scientific validity of some behavioral AI claims undermine stakeholder confidence. These social and political headwinds create significant commercialization uncertainty for behavioral phenotyping AI providers.
Covid-19 Impact:
The Autonomous Home Management Market witnessed accelerated adoption during the COVID-19 period as households increasingly prioritized automation, security, and remote control capabilities. Spurred by prolonged stay-at-home trends and heightened focus on residential comfort, consumers invested in AI-enabled home monitoring, smart appliances, and predictive maintenance systems. Fueled by rapid advancements in IoT connectivity and cloud-based control platforms, autonomous solutions enhanced energy optimization and operational efficiency. This transformation reinforced long-term demand for intelligent, self-regulating home ecosystems across global markets.
The mental health monitoring segment is expected to be the largest during the forecast period
The mental health monitoring segment is expected to account for the largest market share during the forecast period, driven by the global rise in mental health conditions and growing recognition of the need for continuous, technology-enabled mental health tracking. Healthcare systems and employers are increasingly investing in AI tools that can detect early signs of stress, depression, and anxiety through behavioral data. The segment benefits from strong institutional funding, growing clinical trials, and expanding acceptance of digital mental health solutions worldwide.
The software segment is expected to have the highest CAGR during the forecast period
Over the forecast period, the software segment is predicted to witness the highest growth rate, AI-powered analytics platforms are the core value driver in this market, transforming raw behavioral data into actionable clinical and wellness insights. As healthcare providers and research institutions invest in predictive health platforms, subscription-based software models, and interoperable digital health ecosystems, demand for sophisticated behavioral phenotyping software continues to accelerate beyond hardware and services.
Region with largest share:
During the forecast period, the Asia Pacific region is expected to hold the largest market share supported by a robust healthcare research ecosystem, significant NIH and private funding for digital health innovation, and high adoption of clinical AI tools. The United States leads with extensive clinical trial activity, a growing mental health technology market, and widespread digital health platform adoption. Favorable regulatory pathways for AI-based health tools and high institutional willingness to invest in behavioral analytics reinforce the region's dominant
Region with highest CAGR:
Over the forecast period, the North America region is anticipated to exhibit the highest CAGR, due to, rapidly expanding healthcare infrastructure, rising awareness of mental health challenges, and increasing adoption of digital health platforms in China, Japan, India, and South Korea are driving demand for behavioral AI solutions. Government health digitalization initiatives and a growing wearable technology market further support strong regional growth, making Asia Pacific the most dynamically expanding geography for behavioral phenotyping applications.

Key players in the market
Some of the key players in Behavioral Phenotyping AI Market include IBM Corporation, Google LLC, Microsoft Corporation, Oracle Corporation, Amazon Web Services, Inc., Apple Inc., Fitbit, Inc., Philips N.V., Samsung Electronics Co., Ltd., Cerner Corporation, Epic Systems Corporation, Siemens Healthineers AG, Medtronic plc, Roche Holding AG, Johnson & Johnson, Pfizer Inc., Verily Life Sciences LLC, C3.ai, Inc.
Key Developments:
In February 2026, Microsoft introduced Azure AI Health Insights, embedding behavioral phenotyping capabilities into cloud platforms to enable hospitals and researchers to personalize care, predict patient outcomes, and optimize resource allocation.
In January 2026, IBM advanced Watson Health AI with behavioral phenotyping modules, integrating patient data analytics to support personalized treatment pathways, predictive diagnostics, and improved clinical decision‑making in healthcare systems worldwide.
In December 2025, Google’s Verily expanded behavioral phenotyping research, leveraging AI to analyze digital biomarkers from wearables and mobile platforms, aiming to enhance mental health monitoring, chronic disease management, and precision medicine initiatives.
Solution Types Covered:
• Mental Health Monitoring
• Chronic Disease Monitoring
• Cognitive Assessment
• Sleep Analysis
• Social Behavior Tracking
• Workforce Behavior Analytics
Components Covered:
• Software
• Hardware
• Services
Deployments Covered:
• On-Premise
• Cloud-Based
Technologies Covered:
• Machine Learning
• Natural Language Processing
• Computer Vision
• Wearable Integration
Applications Covered:
• Healthcare
• Clinical Research
• Corporate Wellness
• Insurance Risk Assessment
• Academic Research
End Users Covered:
• Hospitals
• Research Institutes
• Pharmaceutical Companies
• Employers
• Insurance Providers
Regions Covered:
• North America
o United States
o Canada
o Mexico
• Europe
o United Kingdom
o Germany
o France
o Italy
o Spain
o Netherlands
o Belgium
o Sweden
o Switzerland
o Poland
o Rest of Europe
• Asia Pacific
o China
o Japan
o India
o South Korea
o Australia
o Indonesia
o Thailand
o Malaysia
o Singapore
o Vietnam
o Rest of Asia Pacific
• South America
o Brazil
o Argentina
o Colombia
o Chile
o Peru
o Rest of South America
• Rest of the World (RoW)
o Middle East
§ Saudi Arabia
§ United Arab Emirates
§ Qatar
§ Israel
§ Rest of Middle East
o Africa
§ South Africa
§ Egypt
§ Morocco
§ Rest of Africa
What our report offers:
- Market share assessments for the regional and country-level segments
- Strategic recommendations for the new entrants
- Covers Market data for the years 2023, 2024, 2025, 2026, 2027, 2028, 2030, 2032 and 2034
- Market Trends (Drivers, Constraints, Opportunities, Threats, Challenges, Investment Opportunities, and recommendations)
- Strategic recommendations in key business segments based on the market estimations
- Competitive landscaping mapping the key common trends
- Company profiling with detailed strategies, financials, and recent developments
- Supply chain trends mapping the latest technological advancements
Free Customization Offerings:
All the customers of this report will be entitled to receive one of the following free customization options:
• Company Profiling
o Comprehensive profiling of additional market players (up to 3)
o SWOT Analysis of key players (up to 3)
• Regional Segmentation
o Market estimations, Forecasts and CAGR of any prominent country as per the client's interest (Note: Depends on feasibility check)
• Competitive Benchmarking
o Benchmarking of key players based on product portfolio, geographical presence, and strategic alliances
Table of Contents
1 Executive Summary
1.1 Market Snapshot and Key Highlights
1.2 Growth Drivers, Challenges, and Opportunities
1.3 Competitive Landscape Overview
1.4 Strategic Insights and Recommendations
2 Research Framework
2.1 Study Objectives and Scope
2.2 Stakeholder Analysis
2.3 Research Assumptions and Limitations
2.4 Research Methodology
2.4.1 Data Collection (Primary and Secondary)
2.4.2 Data Modeling and Estimation Techniques
2.4.3 Data Validation and Triangulation
2.4.4 Analytical and Forecasting Approach
3 Market Dynamics and Trend Analysis
3.1 Market Definition and Structure
3.2 Key Market Drivers
3.3 Market Restraints and Challenges
3.4 Growth Opportunities and Investment Hotspots
3.5 Industry Threats and Risk Assessment
3.6 Technology and Innovation Landscape
3.7 Emerging and High-Growth Markets
3.8 Regulatory and Policy Environment
3.9 Impact of COVID-19 and Recovery Outlook
4 Competitive and Strategic Assessment
4.1 Porter's Five Forces Analysis
4.1.1 Supplier Bargaining Power
4.1.2 Buyer Bargaining Power
4.1.3 Threat of Substitutes
4.1.4 Threat of New Entrants
4.1.5 Competitive Rivalry
4.2 Market Share Analysis of Key Players
4.3 Product Benchmarking and Performance Comparison
5 Global Behavioral Phenotyping AI Market, By Solution Type
5.1 Mental Health Monitoring
5.2 Chronic Disease Monitoring
5.3 Cognitive Assessment
5.4 Sleep Analysis
5.5 Social Behavior Tracking
5.6 Workforce Behavior Analytics
6 Global Behavioral Phenotyping AI Market, By Component
6.1 Software
6.2 Hardware
6.3 Services
7 Global Behavioral Phenotyping AI Market, By Deployment
7.1 On-Premise
7.2 Cloud-Based
8 Global Behavioral Phenotyping AI Market, By Technology
8.1 Machine Learning
8.2 Natural Language Processing
8.3 Computer Vision
8.4 Wearable Integration
9 Global Behavioral Phenotyping AI Market, By Application
9.1 Healthcare
9.2 Clinical Research
9.3 Corporate Wellness
9.4 Insurance Risk Assessment
9.5 Academic Research
10 Global Behavioral Phenotyping AI Market, By End User
10.1 Hospitals
10.2 Research Institutes
10.3 Pharmaceutical Companies
10.4 Employers
10.5 Insurance Providers
11 Global Behavioral Phenotyping AI Market, By Geography
11.1 North America
11.1.1 United States
11.1.2 Canada
11.1.3 Mexico
11.2 Europe
11.2.1 United Kingdom
11.2.2 Germany
11.2.3 France
11.2.4 Italy
11.2.5 Spain
11.2.6 Netherlands
11.2.7 Belgium
11.2.8 Sweden
11.2.9 Switzerland
11.2.10 Poland
11.2.11 Rest of Europe
11.3 Asia Pacific
11.3.1 China
11.3.2 Japan
11.3.3 India
11.3.4 South Korea
11.3.5 Australia
11.3.6 Indonesia
11.3.7 Thailand
11.3.8 Malaysia
11.3.9 Singapore
11.3.10 Vietnam
11.3.11 Rest of Asia Pacific
11.4 South America
11.4.1 Brazil
11.4.2 Argentina
11.4.3 Colombia
11.4.4 Chile
11.4.5 Peru
11.4.6 Rest of South America
11.5 Rest of the World (RoW)
11.5.1 Middle East
11.5.1.1 Saudi Arabia
11.5.1.2 United Arab Emirates
11.5.1.3 Qatar
11.5.1.4 Israel
11.5.1.5 Rest of Middle East
11.5.2 Africa
11.5.2.1 South Africa
11.5.2.2 Egypt
11.5.2.3 Morocco
11.5.2.4 Rest of Africa
12 Strategic Market Intelligence
12.1 Industry Value Network and Supply Chain Assessment
12.2 White-Space and Opportunity Mapping
12.3 Product Evolution and Market Life Cycle Analysis
12.4 Channel, Distributor, and Go-to-Market Assessment
13 Industry Developments and Strategic Initiatives
13.1 Mergers and Acquisitions
13.2 Partnerships, Alliances, and Joint Ventures
13.3 New Product Launches and Certifications
13.4 Capacity Expansion and Investments
13.5 Other Strategic Initiatives
14 Company Profiles
14.1 IBM Corporation
14.2 Google LLC
14.3 Microsoft Corporation
14.4 Oracle Corporation
14.5 Amazon Web Services, Inc.
14.6 Apple Inc.
14.7 Fitbit, Inc.
14.8 Philips N.V.
14.9 Samsung Electronics Co., Ltd.
14.10 Cerner Corporation
14.11 Epic Systems Corporation
14.12 Siemens Healthineers AG
14.13 Medtronic plc
14.14 Roche Holding AG
14.15 Johnson & Johnson
14.16 Pfizer Inc.
14.17 Verily Life Sciences LLC
14.18 C3.ai, Inc.
List of Tables
1 Global Behavioral Phenotyping AI Market Outlook, By Region (2023-2034) ($MN)
2 Global Behavioral Phenotyping AI Market Outlook, By Solution Type (2023-2034) ($MN)
3 Global Behavioral Phenotyping AI Market Outlook, By Mental Health Monitoring (2023-2034) ($MN)
4 Global Behavioral Phenotyping AI Market Outlook, By Chronic Disease Monitoring (2023-2034) ($MN)
5 Global Behavioral Phenotyping AI Market Outlook, By Cognitive Assessment (2023-2034) ($MN)
6 Global Behavioral Phenotyping AI Market Outlook, By Sleep Analysis (2023-2034) ($MN)
7 Global Behavioral Phenotyping AI Market Outlook, By Social Behavior Tracking (2023-2034) ($MN)
8 Global Behavioral Phenotyping AI Market Outlook, By Workforce Behavior Analytics (2023-2034) ($MN)
9 Global Behavioral Phenotyping AI Market Outlook, By Component (2023-2034) ($MN)
10 Global Behavioral Phenotyping AI Market Outlook, By Software (2023-2034) ($MN)
11 Global Behavioral Phenotyping AI Market Outlook, By Hardware (2023-2034) ($MN)
12 Global Behavioral Phenotyping AI Market Outlook, By Services (2023-2034) ($MN)
13 Global Behavioral Phenotyping AI Market Outlook, By Deployment (2023-2034) ($MN)
14 Global Behavioral Phenotyping AI Market Outlook, By On-Premise (2023-2034) ($MN)
15 Global Behavioral Phenotyping AI Market Outlook, By Cloud-Based (2023-2034) ($MN)
16 Global Behavioral Phenotyping AI Market Outlook, By Technology (2023-2034) ($MN)
17 Global Behavioral Phenotyping AI Market Outlook, By Machine Learning (2023-2034) ($MN)
18 Global Behavioral Phenotyping AI Market Outlook, By Natural Language Processing (2023-2034) ($MN)
19 Global Behavioral Phenotyping AI Market Outlook, By Computer Vision (2023-2034) ($MN)
20 Global Behavioral Phenotyping AI Market Outlook, By Wearable Integration (2023-2034) ($MN)
21 Global Behavioral Phenotyping AI Market Outlook, By Application (2023-2034) ($MN)
22 Global Behavioral Phenotyping AI Market Outlook, By Healthcare (2023-2034) ($MN)
23 Global Behavioral Phenotyping AI Market Outlook, By Clinical Research (2023-2034) ($MN)
24 Global Behavioral Phenotyping AI Market Outlook, By Corporate Wellness (2023-2034) ($MN)
25 Global Behavioral Phenotyping AI Market Outlook, By Insurance Risk Assessment (2023-2034) ($MN)
26 Global Behavioral Phenotyping AI Market Outlook, By Academic Research (2023-2034) ($MN)
27 Global Behavioral Phenotyping AI Market Outlook, By End User (2023-2034) ($MN)
28 Global Behavioral Phenotyping AI Market Outlook, By Hospitals (2023-2034) ($MN)
29 Global Behavioral Phenotyping AI Market Outlook, By Research Institutes (2023-2034) ($MN)
30 Global Behavioral Phenotyping AI Market Outlook, By Pharmaceutical Companies (2023-2034) ($MN)
31 Global Behavioral Phenotyping AI Market Outlook, By Employers (2023-2034) ($MN)
32 Global Behavioral Phenotyping AI Market Outlook, By Insurance Providers (2023-2034) ($MN)
Note: Tables for North America, Europe, APAC, South America, and Rest of the World (RoW) Regions are also represented in the same manner as above.
List of Figures
RESEARCH METHODOLOGY

We at ‘Stratistics’ opt for an extensive research approach which involves data mining, data validation, and data analysis. The various research sources include in-house repository, secondary research, competitor’s sources, social media research, client internal data, and primary research.
Our team of analysts prefers the most reliable and authenticated data sources in order to perform the comprehensive literature search. With access to most of the authenticated data bases our team highly considers the best mix of information through various sources to obtain extensive and accurate analysis.
Each report takes an average time of a month and a team of 4 industry analysts. The time may vary depending on the scope and data availability of the desired market report. The various parameters used in the market assessment are standardized in order to enhance the data accuracy.
Data Mining
The data is collected from several authenticated, reliable, paid and unpaid sources and is filtered depending on the scope & objective of the research. Our reports repository acts as an added advantage in this procedure. Data gathering from the raw material suppliers, distributors and the manufacturers is performed on a regular basis, this helps in the comprehensive understanding of the products value chain. Apart from the above mentioned sources the data is also collected from the industry consultants to ensure the objective of the study is in the right direction.
Market trends such as technological advancements, regulatory affairs, market dynamics (Drivers, Restraints, Opportunities and Challenges) are obtained from scientific journals, market related national & international associations and organizations.
Data Analysis
From the data that is collected depending on the scope & objective of the research the data is subjected for the analysis. The critical steps that we follow for the data analysis include:
- Product Lifecycle Analysis
- Competitor analysis
- Risk analysis
- Porters Analysis
- PESTEL Analysis
- SWOT Analysis
The data engineering is performed by the core industry experts considering both the Marketing Mix Modeling and the Demand Forecasting. The marketing mix modeling makes use of multiple-regression techniques to predict the optimal mix of marketing variables. Regression factor is based on a number of variables and how they relate to an outcome such as sales or profits.
Data Validation
The data validation is performed by the exhaustive primary research from the expert interviews. This includes telephonic interviews, focus groups, face to face interviews, and questionnaires to validate our research from all aspects. The industry experts we approach come from the leading firms, involved in the supply chain ranging from the suppliers, distributors to the manufacturers and consumers so as to ensure an unbiased analysis.
We are in touch with more than 15,000 industry experts with the right mix of consultants, CEO's, presidents, vice presidents, managers, experts from both supply side and demand side, executives and so on.
The data validation involves the primary research from the industry experts belonging to:
- Leading Companies
- Suppliers & Distributors
- Manufacturers
- Consumers
- Industry/Strategic Consultants
Apart from the data validation the primary research also helps in performing the fill gap research, i.e. providing solutions for the unmet needs of the research which helps in enhancing the reports quality.
For more details about research methodology, kindly write to us at info@strategymrc.com
Frequently Asked Questions
In case of any queries regarding this report, you can contact the customer service by filing the “Inquiry Before Buy” form available on the right hand side. You may also contact us through email: info@strategymrc.com or phone: +1-301-202-5929
Yes, the samples are available for all the published reports. You can request them by filling the “Request Sample” option available in this page.
Yes, you can request a sample with your specific requirements. All the customized samples will be provided as per the requirement with the real data masked.
All our reports are available in Digital PDF format. In case if you require them in any other formats, such as PPT, Excel etc you can submit a request through “Inquiry Before Buy” form available on the right hand side. You may also contact us through email: info@strategymrc.com or phone: +1-301-202-5929
We offer a free 15% customization with every purchase. This requirement can be fulfilled for both pre and post sale. You may send your customization requirements through email at info@strategymrc.com or call us on +1-301-202-5929.
We have 3 different licensing options available in electronic format.
- Single User Licence: Allows one person, typically the buyer, to have access to the ordered product. The ordered product cannot be distributed to anyone else.
- 2-5 User Licence: Allows the ordered product to be shared among a maximum of 5 people within your organisation.
- Corporate License: Allows the product to be shared among all employees of your organisation regardless of their geographical location.
All our reports are typically be emailed to you as an attachment.
To order any available report you need to register on our website. The payment can be made either through CCAvenue or PayPal payments gateways which accept all international cards.
We extend our support to 6 months post sale. A post sale customization is also provided to cover your unmet needs in the report.
Request Customization
We offer complimentary customization of up to 15% with every purchase. To share your customization requirements, feel free to email us at info@strategymrc.com or call us on +1-301-202-5929. .
Please Note: Customization within the 15% threshold is entirely free of charge. If your request exceeds this limit, we will conduct a feasibility assessment. Following that, a detailed quote and timeline will be provided.
WHY CHOOSE US ?

Assured Quality
Best in class reports with high standard of research integrity

24X7 Research Support
Continuous support to ensure the best customer experience.

Free Customization
Adding more values to your product of interest.

Safe & Secure Access
Providing a secured environment for all online transactions.

Trusted by 600+ Brands
Serving the most reputed brands across the world.