
Beverage Cans Market
Beverage Cans Market Forecasts to 2028 - Global Analysis By Material (Aluminum and Steel), Application (Alcoholic Beverages, Carbonated Soft Drinks, Fruit & Vegetable Juices and Other Applications), and Geography

|
Years Covered |
2022-2028 |
|
Estimated Year Value (2022) |
US $25.5 BN |
|
Projected Year Value (2028) |
US $39.5 BN |
|
CAGR (2022 - 2028) |
7.6% |
|
Regions Covered |
North America, Europe, Asia Pacific, South America, and Middle East & Africa |
|
Countries Covered |
US, Canada, Mexico, Germany, UK, Italy, France, Spain, Japan, China, India, Australia, New Zealand, South Korea, Rest of Asia Pacific, South America, Argentina, Brazil, Chile, Middle East & Africa, Saudi Arabia, UAE, Qatar, and South Africa |
|
Largest Market |
Asia Pacific |
|
Highest Growing Market |
North America |
According to Stratistics MRC, the Global Beverage Cans Market is accounted for $25.5 billion in 2022 and is expected to reach $39.5 billion by 2028 growing at a CAGR of 7.6% during the forecast period. Metal cans known as beverage cans are intended to hold fixed quantities of liquid beverages like alcoholic beverages, carbonated beverages, tea, fruit juices, energy drinks, and other liquids. Aluminum or steel were both used in the cans' production, and they are extremely recyclable. Because they are environmentally friendly and recyclable without sacrificing quality, cans are in higher demand from beverage producers.
According to the Beverage Association and Can Manufacturers Institute Report, the aluminum industry has joined forces with the Can Manufacturers Institute (CMI) to increase consumer recycling of aluminum beverage cans from 45% to 70% by 2030.
Market Dynamics:
Driver:
High demand for ready-to-drink beverages
Consumer behaviour has changed as a result of exponential population expansion, rising purchasing power, and changing lifestyles. The preference of customers for ready-to-drink beverages is a result of their busy schedules and long workdays. Due to their small amount and portability, beverages like tea, coffee, wine, and water in cans are in high demand from consumers. Additionally, the use of eye-catching and engaging printings on metal cans is gaining popularity as a way to strengthen brands which are boosting the market growth.
Restraint:
Rising favourability for PET bottles
The market is being constrained by manufacturers' growing preference for PET and glass bottles. Because PET bottles share some of the same qualities as metal cans, such as reusability, durability, light weight, and oxygen gas barrier features, the demand for PET bottles is growing among beverage makers. When compared to metal cans, PET bottles offer beverage makers a cheaper packaging option. Furthermore, the production of PET bottles uses a lot lesser power than the production of beverage cans. The aforementioned problems will hinder market expansion.
Opportunity:
Rising urbanization activities and growing population
The increased demand for beverages around the world is caused by factors like urbanisation activities and a growing population. Consumer spending on beverages has increased as disposable income in developing countries has increased. Brands like Coca-Cola and Pepsi, for instance, have a big impact on customers in developing nations. Additionally, consumers like beverages with recyclable and environmental packaging, which raises the need for metal cans. The demand for healthy and nourishing drinks has also increased due to shifting lifestyle choices and rising health consciousness, which is propelling the market.
Threat:
Greater use of plastic in packaging as a result of its cheaper price
The advantages of beverage packaging made of metal are not widely known in developing nations. Additionally, consumers are discouraged from using these products because to the expensive cost of the raw materials utilised, such as steel and aluminium. The primary issue for producers of metal cans is the switch to polyethylene terephthalate bottles, particularly for beverages. Although metal packaging is more expensive than alternatives like paper, glass, and plastic, PET-based cans are also slowly making their way into the market.
Covid-19 Impact
The COVID-19 significantly affects how well the market for beverage cans performs. The supply chain was upset by the ban on bauxite mining, raw material transportation, and aluminium recycling. The supply of cans was insufficient for beverage producers. Corona outbreak, nevertheless, turned out to be a boon for the companies who make beverage cans. Due of lockdown, consumers choose to purchase numerous packs of beverages for consumption at home. This preference fuelled beverage demand during the epidemic. The unanticipated increase in beverage consumption has boosted the market's overall business.
The Aluminum segment is expected to be the largest during the forecast period
The Aluminum segment is estimated to have a lucrative growth, due to their environmentally friendly beverage packaging. Compared to other package types, aluminium cans have a greater recycling rate and contain more recycled material. Because they are robust, stackable, and lightweight, marketers can package and ship more beverages with less waste. Aluminum is a recyclable material that provides a sustainable packaging alternative without sacrificing quality by accelerating the market growth.
The Carbonated soft drinks segment is expected to have the highest CAGR during the forecast period
The Carbonated soft drinks segment is anticipated to witness the fastest CAGR growth during the forecast period, due the global surge in soft drink demand. Consumption for carbonated soft drinks is increasing as a result of the introduction of new tastes featuring fruit combinations that appeal to younger generations of customers. The main causes of the growing demand for alcoholic beverages are rising disposable income and evolving lifestyle preferences. Additionally, the rise in the number of young people and greater recognition of alcoholic beverages both contribute to the market's expansion.
Region with largest share:
Asia Pacific is projected to hold the largest market share during the forecast period owing to increased urbanisation and population expansion in Asia Pacific have led to a high demand for beverages, which is driving the market for beverage cans. Drinks that have been processed and packaged are being consumed more frequently in the area. The demand for cans has increased as a result of rising consumption of wholesome beverages in Asia Pacific and growing health consciousness. Additionally, it is projected that rising consumer buying power and evolving lifestyle preferences would favourably impacting market expansion.
Region with highest CAGR:
North America is projected to have the highest CAGR over the forecast period, owing to Both in volume and value, North America dominated the market. By launching programmes like The Clean Seas, nations like the U.S. and Canada has accessing efforts to limit the usage of plastic. With large corporations like Ball Corporation, Crown Holdings, Inc., maintaining their manufacturing facilities and distribution hubs in the nation, the U.S. market has seen continual product improvements for metal beverage cans. The quickest growth of the regional market is anticipated to be supported by the expanding millennial population, which is encouraging demand for beverage cans with high visual appeal.

Key players in the market
Some of the key players profiled in the Beverage Cans Market include BWAY Corporation, CPMC Holdings Ltd., Kian Joo Can Factory Berhad, Toyo Seikan Group Holdings Ltd, HUBER Packaging Group GmbH, Ball Coroporation, Orora Packaging Australia Pty. Ltd, Crown Holdings. Inc, Ardagh Group S.A, GZ Industries Ltd, CANPACK S.A, MSCANCO, Pakistan Aluminum Beverage Cans Limited, Ceylon Beverage Can (Pvt) Ltd, Universal Can and Techpack Solutions
Key Developments:
In Feb 2023, Toyo Seikan has signed a business alliance agreement with UACJ to promote horizontal recycling of aluminum cans, this business alliance aims to develop and commercialize aluminum cans with added environmental value by leveraging the technologies and know-how of both companies.
In Nov 2022, Toyo Seikan announced that it has joined the United Nations Global Compact (UNGC) officially. Toyo Seikan Group has declared to the world that we agree with and continue to adhere to the UNGC's Ten Principles in the four areas of human rights, labour, environment, and anti-corruption.
In Oct 2022, Ball Corporation Expands the Portfolio of its Infinitely Recyclable Ball Aluminum Cup® with the Announcement of Two New, Smaller Sizes, announced the availability of two new sizes of its infinitely recyclable Ball Aluminum Cup®,
In June 2022, Ball Corporation Launches New, Low Carbon Footprint Aluminum Aerosol Can with only half the carbon footprint of a standard can. This will help support Ball’s ambition to achieve its 2030 science-based targets and net-zero emissions prior to 2050.
Materials Covered:
• Aluminum
• Steel
Applications Covered:
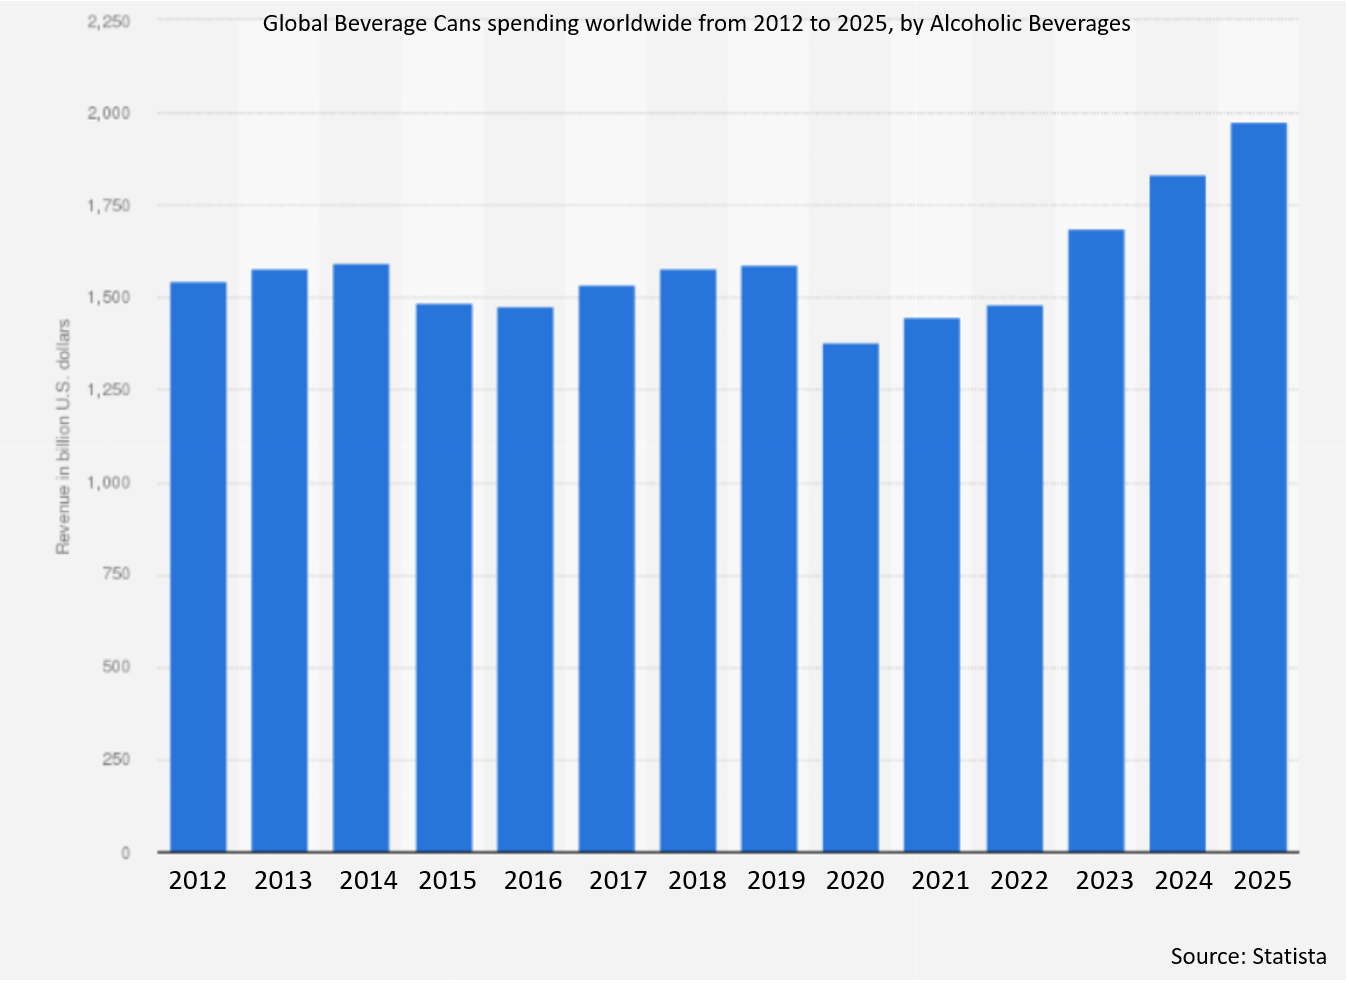
• Alcoholic Beverages
• Carbonated Soft Drinks
• Fruit & Vegetable Juices
• Other Applications
Regions Covered:
• North America
o US
o Canada
o Mexico
• Europe
o Germany
o UK
o Italy
o France
o Spain
o Rest of Europe
• Asia Pacific
o Japan
o China
o India
o Australia
o New Zealand
o South Korea
o Rest of Asia Pacific
• South America
o Argentina
o Brazil
o Chile
o Rest of South America
• Middle East & Africa
o Saudi Arabia
o UAE
o Qatar
o South Africa
o Rest of Middle East & Africa
What our report offers:
- Market share assessments for the regional and country-level segments
- Strategic recommendations for the new entrants
- Covers Market data for the years 2020, 2021, 2022, 2025, and 2028
- Market Trends (Drivers, Constraints, Opportunities, Threats, Challenges, Investment Opportunities, and recommendations)
- Strategic recommendations in key business segments based on the market estimations
- Competitive landscaping mapping the key common trends
- Company profiling with detailed strategies, financials, and recent developments
- Supply chain trends mapping the latest technological advancements
Free Customization Offerings:
All the customers of this report will be entitled to receive one of the following free customization options:
• Company Profiling
o Comprehensive profiling of additional market players (up to 3)
o SWOT Analysis of key players (up to 3)
• Regional Segmentation
o Market estimations, Forecasts and CAGR of any prominent country as per the client's interest (Note: Depends on feasibility check)
• Competitive Benchmarking
o Benchmarking of key players based on product portfolio, geographical presence, and strategic alliances
Table of Contents
1 Executive Summary
2 Preface
2.1 Abstract
2.2 Stake Holders
2.3 Research Scope
2.4 Research Methodology
2.4.1 Data Mining
2.4.2 Data Analysis
2.4.3 Data Validation
2.4.4 Research Approach
2.5 Research Sources
2.5.1 Primary Research Sources
2.5.2 Secondary Research Sources
2.5.3 Assumptions
3 Market Trend Analysis
3.1 Introduction
3.2 Drivers
3.3 Restraints
3.4 Opportunities
3.5 Threats
3.6 Application Analysis
3.7 Emerging Markets
3.8 Impact of Covid-19
4 Porters Five Force Analysis
4.1 Bargaining power of suppliers
4.2 Bargaining power of buyers
4.3 Threat of substitutes
4.4 Threat of new entrants
4.5 Competitive rivalry
5 Global Beverage Cans Market, By Material
5.1 Introduction
5.2 Aluminum
5.3 Steel
6 Global Beverage Cans Market, By Application
6.1 Introduction
6.2 Alcoholic Beverages
6.3 Carbonated Soft Drinks
6.4 Fruit & Vegetable Juices
6.5 Other Applications
7 Global Beverage Cans Market, By Geography
7.1 Introduction
7.2 North America
7.2.1 US
7.2.2 Canada
7.2.3 Mexico
7.3 Europe
7.3.1 Germany
7.3.2 UK
7.3.3 Italy
7.3.4 France
7.3.5 Spain
7.3.6 Rest of Europe
7.4 Asia Pacific
7.4.1 Japan
7.4.2 China
7.4.3 India
7.4.4 Australia
7.4.5 New Zealand
7.4.6 South Korea
7.4.7 Rest of Asia Pacific
7.5 South America
7.5.1 Argentina
7.5.2 Brazil
7.5.3 Chile
7.5.4 Rest of South America
7.6 Middle East & Africa
7.6.1 Saudi Arabia
7.6.2 UAE
7.6.3 Qatar
7.6.4 South Africa
7.6.5 Rest of Middle East & Africa
8 Key Developments
8.1 Agreements, Partnerships, Collaborations and Joint Ventures
8.2 Acquisitions & Mergers
8.3 New Product Launch
8.4 Expansions
8.5 Other Key Strategies
9 Company Profiling
9.1 BWAY Corporation
9.2 CPMC Holdings Ltd.
9.3 Kian Joo Can Factory Berhad
9.4 Toyo Seikan Group Holdings Ltd.
9.5 HUBER Packaging Group GmbH
9.6 Ball Coroporation
9.7 Orora Packaging Australia Pty. Ltd
9.8 Crown Holdings. Inc
9.9 Ardagh Group S.A.
9.10 GZ Industries Ltd.
9.11 CANPACK S.A.
9.12 MSCANCO
9.13 Pakistan Aluminum Beverage Cans Limited
9.14 Ceylon Beverage Can (Pvt) Ltd
9.15 Universal Can
9.16 Techpack Solutions
List of Tables
1 Global Beverage Cans Market Outlook, By Region (2020-2028) ($MN)
2 Global Beverage Cans Market Outlook, By Material (2020-2028) ($MN)
3 Global Beverage Cans Market Outlook, By Aluminum (2020-2028) ($MN)
4 Global Beverage Cans Market Outlook, By Steel (2020-2028) ($MN)
5 Global Beverage Cans Market Outlook, By Application (2020-2028) ($MN)
6 Global Beverage Cans Market Outlook, By Alcoholic Beverages (2020-2028) ($MN)
7 Global Beverage Cans Market Outlook, By Carbonated Soft Drinks (2020-2028) ($MN)
8 Global Beverage Cans Market Outlook, By Fruit & Vegetable Juices (2020-2028) ($MN)
9 Global Beverage Cans Market Outlook, By Other Applications (2020-2028) ($MN)
10 North America Beverage Cans Market Outlook, By Country (2020-2028) ($MN)
11 North America Beverage Cans Market Outlook, By Material (2020-2028) ($MN)
12 North America Beverage Cans Market Outlook, By Aluminum (2020-2028) ($MN)
13 North America Beverage Cans Market Outlook, By Steel (2020-2028) ($MN)
14 North America Beverage Cans Market Outlook, By Application (2020-2028) ($MN)
15 North America Beverage Cans Market Outlook, By Alcoholic Beverages (2020-2028) ($MN)
16 North America Beverage Cans Market Outlook, By Carbonated Soft Drinks (2020-2028) ($MN)
17 North America Beverage Cans Market Outlook, By Fruit & Vegetable Juices (2020-2028) ($MN)
18 North America Beverage Cans Market Outlook, By Other Applications (2020-2028) ($MN)
19 Europe Beverage Cans Market Outlook, By Country (2020-2028) ($MN)
20 Europe Beverage Cans Market Outlook, By Material (2020-2028) ($MN)
21 Europe Beverage Cans Market Outlook, By Aluminum (2020-2028) ($MN)
22 Europe Beverage Cans Market Outlook, By Steel (2020-2028) ($MN)
23 Europe Beverage Cans Market Outlook, By Application (2020-2028) ($MN)
24 Europe Beverage Cans Market Outlook, By Alcoholic Beverages (2020-2028) ($MN)
25 Europe Beverage Cans Market Outlook, By Carbonated Soft Drinks (2020-2028) ($MN)
26 Europe Beverage Cans Market Outlook, By Fruit & Vegetable Juices (2020-2028) ($MN)
27 Europe Beverage Cans Market Outlook, By Other Applications (2020-2028) ($MN)
28 Asia Pacific Beverage Cans Market Outlook, By Country (2020-2028) ($MN)
29 Asia Pacific Beverage Cans Market Outlook, By Material (2020-2028) ($MN)
30 Asia Pacific Beverage Cans Market Outlook, By Aluminum (2020-2028) ($MN)
31 Asia Pacific Beverage Cans Market Outlook, By Steel (2020-2028) ($MN)
32 Asia Pacific Beverage Cans Market Outlook, By Application (2020-2028) ($MN)
33 Asia Pacific Beverage Cans Market Outlook, By Alcoholic Beverages (2020-2028) ($MN)
34 Asia Pacific Beverage Cans Market Outlook, By Carbonated Soft Drinks (2020-2028) ($MN)
35 Asia Pacific Beverage Cans Market Outlook, By Fruit & Vegetable Juices (2020-2028) ($MN)
36 Asia Pacific Beverage Cans Market Outlook, By Other Applications (2020-2028) ($MN)
37 South America Beverage Cans Market Outlook, By Country (2020-2028) ($MN)
38 South America Beverage Cans Market Outlook, By Material (2020-2028) ($MN)
39 South America Beverage Cans Market Outlook, By Aluminum (2020-2028) ($MN)
40 South America Beverage Cans Market Outlook, By Steel (2020-2028) ($MN)
41 South America Beverage Cans Market Outlook, By Application (2020-2028) ($MN)
42 South America Beverage Cans Market Outlook, By Alcoholic Beverages (2020-2028) ($MN)
43 South America Beverage Cans Market Outlook, By Carbonated Soft Drinks (2020-2028) ($MN)
44 South America Beverage Cans Market Outlook, By Fruit & Vegetable Juices (2020-2028) ($MN)
45 South America Beverage Cans Market Outlook, By Other Applications (2020-2028) ($MN)
46 Middle East & Africa Beverage Cans Market Outlook, By Country (2020-2028) ($MN)
47 Middle East & Africa Beverage Cans Market Outlook, By Material (2020-2028) ($MN)
48 Middle East & Africa Beverage Cans Market Outlook, By Aluminum (2020-2028) ($MN)
49 Middle East & Africa Beverage Cans Market Outlook, By Steel (2020-2028) ($MN)
50 Middle East & Africa Beverage Cans Market Outlook, By Application (2020-2028) ($MN)
51 Middle East & Africa Beverage Cans Market Outlook, By Alcoholic Beverages (2020-2028) ($MN)
52 Middle East & Africa Beverage Cans Market Outlook, By Carbonated Soft Drinks (2020-2028) ($MN)
List of Figures
RESEARCH METHODOLOGY

We at ‘Stratistics’ opt for an extensive research approach which involves data mining, data validation, and data analysis. The various research sources include in-house repository, secondary research, competitor’s sources, social media research, client internal data, and primary research.
Our team of analysts prefers the most reliable and authenticated data sources in order to perform the comprehensive literature search. With access to most of the authenticated data bases our team highly considers the best mix of information through various sources to obtain extensive and accurate analysis.
Each report takes an average time of a month and a team of 4 industry analysts. The time may vary depending on the scope and data availability of the desired market report. The various parameters used in the market assessment are standardized in order to enhance the data accuracy.
Data Mining
The data is collected from several authenticated, reliable, paid and unpaid sources and is filtered depending on the scope & objective of the research. Our reports repository acts as an added advantage in this procedure. Data gathering from the raw material suppliers, distributors and the manufacturers is performed on a regular basis, this helps in the comprehensive understanding of the products value chain. Apart from the above mentioned sources the data is also collected from the industry consultants to ensure the objective of the study is in the right direction.
Market trends such as technological advancements, regulatory affairs, market dynamics (Drivers, Restraints, Opportunities and Challenges) are obtained from scientific journals, market related national & international associations and organizations.
Data Analysis
From the data that is collected depending on the scope & objective of the research the data is subjected for the analysis. The critical steps that we follow for the data analysis include:
- Product Lifecycle Analysis
- Competitor analysis
- Risk analysis
- Porters Analysis
- PESTEL Analysis
- SWOT Analysis
The data engineering is performed by the core industry experts considering both the Marketing Mix Modeling and the Demand Forecasting. The marketing mix modeling makes use of multiple-regression techniques to predict the optimal mix of marketing variables. Regression factor is based on a number of variables and how they relate to an outcome such as sales or profits.
Data Validation
The data validation is performed by the exhaustive primary research from the expert interviews. This includes telephonic interviews, focus groups, face to face interviews, and questionnaires to validate our research from all aspects. The industry experts we approach come from the leading firms, involved in the supply chain ranging from the suppliers, distributors to the manufacturers and consumers so as to ensure an unbiased analysis.
We are in touch with more than 15,000 industry experts with the right mix of consultants, CEO's, presidents, vice presidents, managers, experts from both supply side and demand side, executives and so on.
The data validation involves the primary research from the industry experts belonging to:
- Leading Companies
- Suppliers & Distributors
- Manufacturers
- Consumers
- Industry/Strategic Consultants
Apart from the data validation the primary research also helps in performing the fill gap research, i.e. providing solutions for the unmet needs of the research which helps in enhancing the reports quality.
For more details about research methodology, kindly write to us at info@strategymrc.com
Frequently Asked Questions
In case of any queries regarding this report, you can contact the customer service by filing the “Inquiry Before Buy” form available on the right hand side. You may also contact us through email: info@strategymrc.com or phone: +1-301-202-5929
Yes, the samples are available for all the published reports. You can request them by filling the “Request Sample” option available in this page.
Yes, you can request a sample with your specific requirements. All the customized samples will be provided as per the requirement with the real data masked.
All our reports are available in Digital PDF format. In case if you require them in any other formats, such as PPT, Excel etc you can submit a request through “Inquiry Before Buy” form available on the right hand side. You may also contact us through email: info@strategymrc.com or phone: +1-301-202-5929
We offer a free 15% customization with every purchase. This requirement can be fulfilled for both pre and post sale. You may send your customization requirements through email at info@strategymrc.com or call us on +1-301-202-5929.
We have 3 different licensing options available in electronic format.
- Single User Licence: Allows one person, typically the buyer, to have access to the ordered product. The ordered product cannot be distributed to anyone else.
- 2-5 User Licence: Allows the ordered product to be shared among a maximum of 5 people within your organisation.
- Corporate License: Allows the product to be shared among all employees of your organisation regardless of their geographical location.
All our reports are typically be emailed to you as an attachment.
To order any available report you need to register on our website. The payment can be made either through CCAvenue or PayPal payments gateways which accept all international cards.
We extend our support to 6 months post sale. A post sale customization is also provided to cover your unmet needs in the report.
Request Customization
We offer complimentary customization of up to 15% with every purchase. To share your customization requirements, feel free to email us at info@strategymrc.com or call us on +1-301-202-5929. .
Please Note: Customization within the 15% threshold is entirely free of charge. If your request exceeds this limit, we will conduct a feasibility assessment. Following that, a detailed quote and timeline will be provided.
WHY CHOOSE US ?

Assured Quality
Best in class reports with high standard of research integrity

24X7 Research Support
Continuous support to ensure the best customer experience.

Free Customization
Adding more values to your product of interest.

Safe & Secure Access
Providing a secured environment for all online transactions.

Trusted by 600+ Brands
Serving the most reputed brands across the world.