
Bio Reactors For Green Chemical Synthesis Market
Bio-Reactors for Green Chemical Synthesis Market Forecasts to 2034 - Global Analysis By Bio-Reactor Type (Batch Reactors, Continuous Flow Reactors, Photobioreactors and Membrane-Integrated Reactors), Feedstock, Application, End User and By Geography

|
Years Covered |
2023-2034 |
|
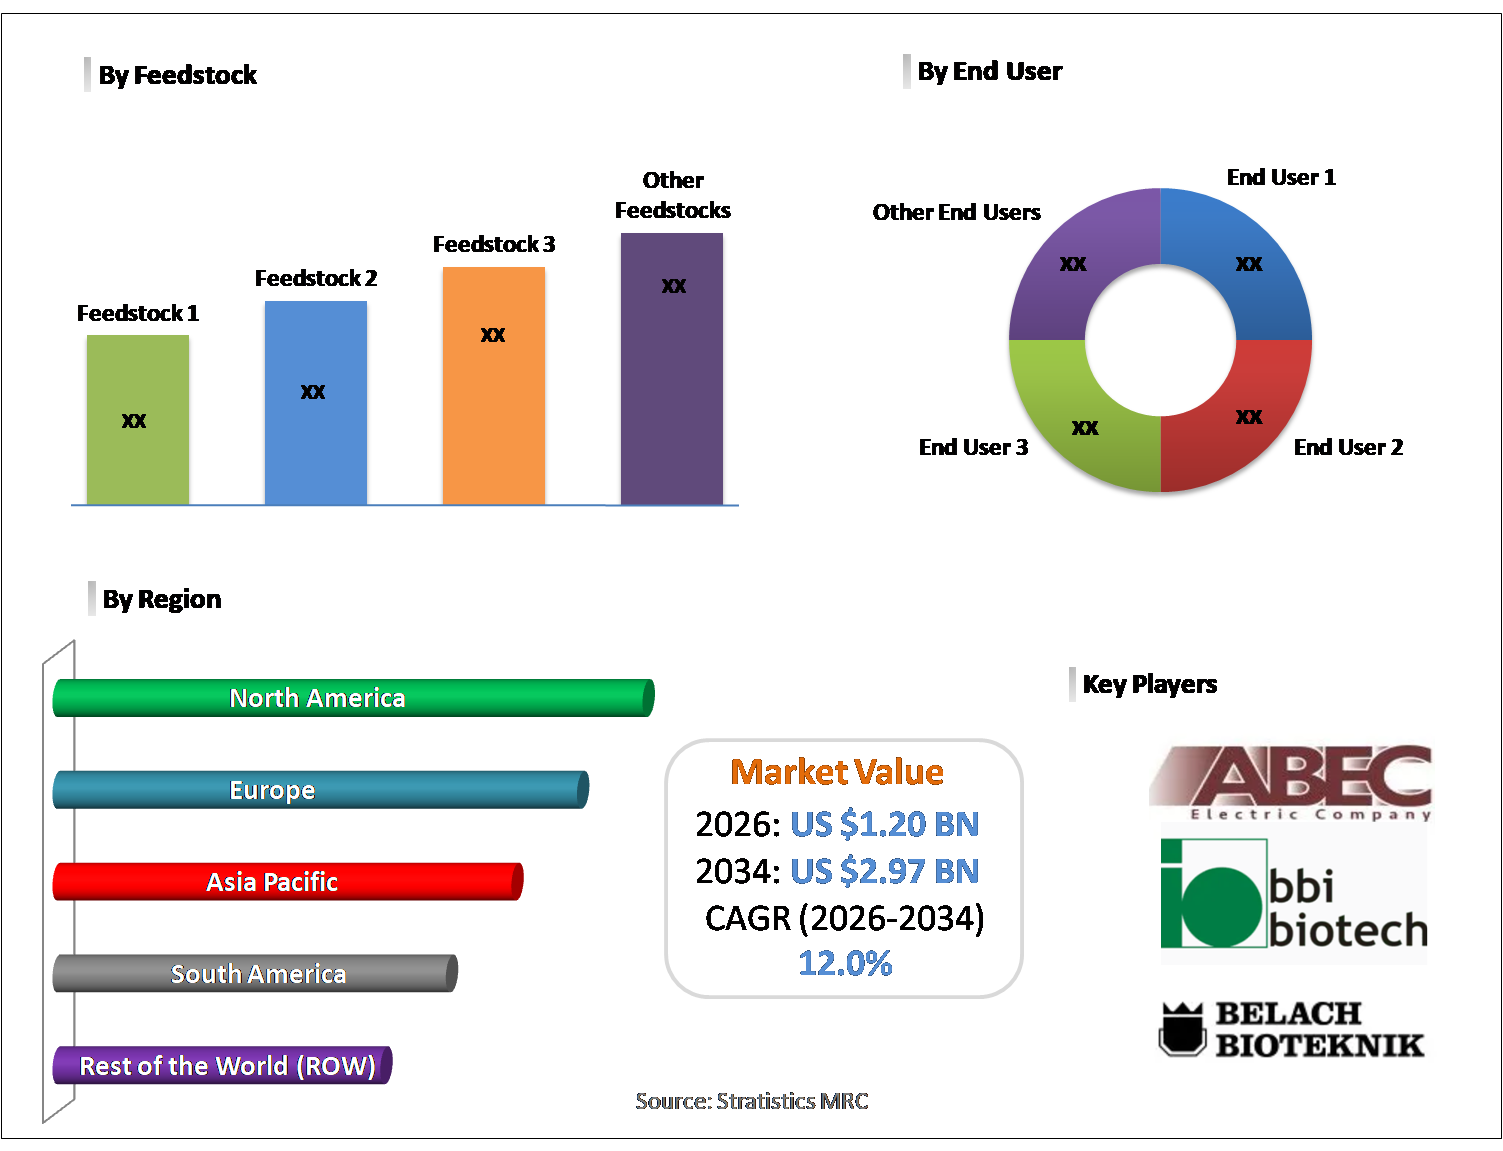
Estimated Year Value (2026) |
US $1.20 BN |
|
Projected Year Value (2034) |
US $2.97 BN |
|
CAGR (2026-2034) |
12.0% |
|
Regions Covered |
North America, Europe, Asia Pacific, South America, and Rest of the World (RoW) |
|
Countries Covered |
United States, Canada, Mexico, United Kingdom, Germany, France, Italy, Spain, Netherlands, Belgium, Sweden, Switzerland, Poland, Rest of Europe, China, Japan, India, South Korea, Australia, Indonesia, Thailand, Malaysia, Singapore, Vietnam, Rest of Asia Pacific, Brazil, Argentina, Colombia, Chile, Peru, Rest of South America, Saudi Arabia, United Arab Emirates, Qatar, Israel, Rest of Middle East, South Africa, Egypt, Morocco, and Rest of Africa. |
|
Largest Market |
North America |
|
Highest Growing Market |
Asia Pacific |
According to Stratistics MRC, the Global Bio-Reactors for Green Chemical Synthesis Market is accounted for $1.20 billion in 2026 and is expected to reach $2.97 billion by 2034 growing at a CAGR of 12.0% during the forecast period. Bio-reactors designed for green chemical synthesis contribute significantly to sustainable manufacturing by facilitating eco-conscious chemical production. These systems rely on enzymes, microbes, or other biological catalysts to transform renewable feedstocks into useful compounds in carefully regulated environments. In contrast to conventional chemical methods, bio-reactors consume less energy, generate fewer toxic byproducts, and reduce carbon emissions. They are widely applied in producing biofuels, biodegradable materials, pharmaceuticals, and high-value specialty chemicals. Through accurate control of operational parameters such as temperature and pH, they improve productivity and process efficiency.
According to the OECD (Organisation for Economic Co-operation and Development), bio-based industries—including bioreactors—could contribute up to 2.7% of GDP in OECD countries by 2030, with significant reductions in greenhouse gas emissions compared to petrochemical processes.
Market Dynamics:
Driver:
Rising demand for sustainable and eco-friendly chemicals
Heightened environmental concerns and tighter emission standards are driving industries toward bio-reactors used in green chemical production. Businesses are replacing traditional petrochemical operations with biological systems that lower pollution and hazardous byproducts. Consumer preference for environmentally responsible goods is also motivating companies to adopt cleaner technologies. Bio-reactors facilitate the transformation of renewable raw materials into biofuels, biodegradable polymers, and high-value chemicals efficiently. As organizations prioritize ESG compliance and carbon reduction commitments, investment in advanced bio-reactor technologies is increasing steadily across global manufacturing landscapes.
Restraint:
High capital investment and operational costs
Substantial upfront expenditures and ongoing operational requirements limit the expansion of the bio-reactor market. Implementing modern systems involves investment in advanced control mechanisms, sterile processing components, and automated monitoring devices, which raise setup costs. Continuous maintenance of controlled reaction environments increases energy usage and staffing needs. Smaller manufacturers may struggle to justify such investments due to uncertain returns. Scaling laboratory processes to industrial production also introduces financial challenges and technical complexity. These monetary constraints discourage rapid deployment of bio-reactor technologies, especially in emerging economies where budget limitations and infrastructure gaps remain considerable.
Opportunity:
Development of advanced biopharmaceuticals and specialty chemicals
Growing requirements for innovative medicines and specialized chemical products provide strong opportunities for bio-reactor adoption. Controlled biological environments allow precise synthesis of complex therapeutic substances and fine chemicals. Pharmaceutical manufacturers prefer bio-based techniques to achieve consistent quality while minimizing environmental impact. Flexible system designs accommodate both limited-volume and high-value output strategies. Advances in continuous processing improve operational efficiency and product safety. As healthcare markets expand and industries seek sustainable production of specialty compounds, bio-reactor technologies are becoming increasingly essential within modern chemical and pharmaceutical manufacturing sectors.
Threat:
Technological obsolescence and rapid innovation cycles
The accelerated pace of technological progress poses a risk to established bio-reactor platforms. Emerging sustainable production methods, including advanced catalysis and alternative energy-driven synthesis, may outperform existing biological systems. Heavy investment in present infrastructure could become less viable if newer technologies offer better efficiency or lower costs. Continuous modernization demands extra funding and workforce adaptation. Uncertainty about future technological standards complicates long-term planning. Such rapid innovation cycles may reduce confidence among investors and slow expansion within the green chemical bio-reactor industry.
Covid-19 Impact:
The outbreak of COVID-19 created both challenges and opportunities for the bio-reactor market focused on green chemical synthesis. Early phases of the pandemic disrupted global logistics, delayed capital investments, and limited workforce availability, hindering project execution. Supply constraints and higher material costs pressured manufacturers. Nevertheless, the crisis strengthened focus on biotechnology, healthcare manufacturing, and sustainable industrial systems. Stimulus packages and green recovery initiatives promoted environmentally responsible production methods. Growing emphasis on local sourcing and supply chain resilience further encouraged bio-based solutions.
The batch reactors segment is expected to be the largest during the forecast period
The batch reactors segment is expected to account for the largest market share during the forecast period because of their adaptability and straightforward process management. They are extensively used in controlled biological reactions that require careful regulation of temperature, pH, and nutrient conditions. Their compatibility with multiple feedstock types and biological cultures enhances operational versatility. Industries producing high-value chemicals and pharmaceutical ingredients prefer batch systems for maintaining consistent product standards. Familiarity with batch processing methods and relatively manageable system design further strengthen their prominence in environmentally responsible chemical production environments.
The biofuel production segment is expected to have the highest CAGR during the forecast period
Over the forecast period, the biofuel production segment is predicted to witness the highest growth rate, driven by strong global commitment to renewable energy adoption. Many countries are encouraging the use of bio-based fuels such as ethanol and biodiesel to reduce carbon footprints and reliance on petroleum resources. Biological processing systems enable effective transformation of biomass into alternative fuels under controlled conditions. Expanding clean energy investments and favourable regulatory measures contribute to accelerated growth in this segment. Increasing pressure to decarbonize transportation and industrial sectors further supports the rapid advancement of biofuel-related bio-reactor technologies.
Region with largest share:
During the forecast period, the North America region is expected to hold the largest market share due to its robust biotechnology ecosystem and progressive environmental policies. Strong funding for renewable technologies and eco-friendly industrial processes supports widespread implementation of bio-reactor systems. The region’s established pharmaceutical and chemical sectors readily integrate advanced biological production methods. Regulatory encouragement for emission control and sustainable practices further stimulates demand. Strategic partnerships between academic organizations and industry leaders enhance innovation and commercialization.
Region with highest CAGR:
Over the forecast period, the Asia Pacific region is anticipated to exhibit the highest CAGR, supported by strong economic expansion and rising focus on sustainability. Nations including China, India, and Japan are actively promoting renewable resources and environmentally responsible industrial practices. Increasing investments in biotechnology research and green infrastructure contribute to rapid adoption of biological processing systems. Competitive production costs and expanding industrial bases further enhance regional growth prospects.

Key players in the market
Some of the key players in Bio-Reactors for Green Chemical Synthesis Market include ABEC, Inc., Adolf Kühner AG, BBI-biotech GmbH, Belach Bioteknik AB, Bioengineering AG, CerCell A/S, Cesco Bioengineering Co., Ltd., FiberCell Systems Inc., G&G Technologies, Inc., GEA Group AG, Getinge AB, Sartorius AG, Praj Industries Limited, Thermo Fisher Scientific Inc., Merck KGaA, Danaher Corporation, Eppendorf AG and Applikon Biotechnology.
Key Developments:
In February 2026, Danaher Corp. agreed to acquire Masimo Corp. for $9.9 billion in a move to strengthen its diagnostics business. Under the terms of the agreement, Danaher will acquire all the outstanding shares of Masimo for $180 per share in cash, representing a 38.3% premium to Masimo’s last closing price.
In November 2025, Merck KGaA has signed a 20-year power purchase agreement (PPA) with SK Innovation E&S to supply renewable electricity to its life science manufacturing sites in Daejeon and Songdo, South Korea. The agreement adds 16 megawatts (MW) of new renewable capacity and represents the company’s longest energy commitment in the Asia-Pacific region.
In October 2025, Thermo Fisher Scientific Inc. has agreed to acquire Clario Holdings Inc., a provider of digital endpoint data solutions for clinical trials. The deal includes potential additional earnout and other payments contingent on future performance. Clario’s platform integrates clinical trial endpoint data from devices, sites, and patients, enabling pharmaceutical and biotechnology companies to digitally collect, manage, and analyze clinical evidence across all phases of drug development.
Bio-Reactor Types Covered:
• Batch Reactors
• Continuous Flow Reactors
• Photobioreactors
• Membrane-Integrated Reactors
Feedstocks Covered:
• Algal Biomass
• Bacterial Cultures
• Yeast Strains
• Lignocellulosic Plant Biomass
Applications Covered:
• Pharmaceutical Synthesis
• Biofuel Production
• Specialty & Fine Chemicals
• Food & Beverage Bioprocessing
End Users Covered:
• Chemical Manufacturing Industry
• Energy & Power Sector
• Healthcare & Life Sciences Enterprises
• Agricultural & Agri-Biotech Sector
Regions Covered:
• North America
o United States
o Canada
o Mexico
• Europe
o United Kingdom
o Germany
o France
o Italy
o Spain
o Netherlands
o Belgium
o Sweden
o Switzerland
o Poland
o Rest of Europe
• Asia Pacific
o China
o Japan
o India
o South Korea
o Australia
o Indonesia
o Thailand
o Malaysia
o Singapore
o Vietnam
o Rest of Asia Pacific
• South America
o Brazil
o Argentina
o Colombia
o Chile
o Peru
o Rest of South America
• Rest of the World (RoW)
o Middle East
§ Saudi Arabia
§ United Arab Emirates
§ Qatar
§ Israel
§ Rest of Middle East
o Africa
§ South Africa
§ Egypt
§ Morocco
§ Rest of Africa
What our report offers:
- Market share assessments for the regional and country-level segments
- Strategic recommendations for the new entrants
- Covers Market data for the years 2023, 2024, 2025, 2026, 2027, 2028, 2030, 2032 and 2034
- Market Trends (Drivers, Constraints, Opportunities, Threats, Challenges, Investment Opportunities, and recommendations)
- Strategic recommendations in key business segments based on the market estimations
- Competitive landscaping mapping the key common trends
- Company profiling with detailed strategies, financials, and recent developments
- Supply chain trends mapping the latest technological advancements
Free Customization Offerings:
All the customers of this report will be entitled to receive one of the following free customization options:
• Company Profiling
o Comprehensive profiling of additional market players (up to 3)
o SWOT Analysis of key players (up to 3)
• Regional Segmentation
o Market estimations, Forecasts and CAGR of any prominent country as per the client's interest (Note: Depends on feasibility check)
• Competitive Benchmarking
o Benchmarking of key players based on product portfolio, geographical presence, and strategic alliances
Table of Contents
1 Executive Summary
1.1 Market Snapshot and Key Highlights
1.2 Growth Drivers, Challenges, and Opportunities
1.3 Competitive Landscape Overview
1.4 Strategic Insights and Recommendations
2 Research Framework
2.1 Study Objectives and Scope
2.2 Stakeholder Analysis
2.3 Research Assumptions and Limitations
2.4 Research Methodology
2.4.1 Data Collection (Primary and Secondary)
2.4.2 Data Modeling and Estimation Techniques
2.4.3 Data Validation and Triangulation
2.4.4 Analytical and Forecasting Approach
3 Market Dynamics and Trend Analysis
3.1 Market Definition and Structure
3.2 Key Market Drivers
3.3 Market Restraints and Challenges
3.4 Growth Opportunities and Investment Hotspots
3.5 Industry Threats and Risk Assessment
3.6 Technology and Innovation Landscape
3.7 Emerging and High-Growth Markets
3.8 Regulatory and Policy Environment
3.9 Impact of COVID-19 and Recovery Outlook
4 Competitive and Strategic Assessment
4.1 Porter's Five Forces Analysis
4.1.1 Supplier Bargaining Power
4.1.2 Buyer Bargaining Power
4.1.3 Threat of Substitutes
4.1.4 Threat of New Entrants
4.1.5 Competitive Rivalry
4.2 Market Share Analysis of Key Players
4.3 Product Benchmarking and Performance Comparison
5 Global Bio-Reactors for Green Chemical Synthesis Market, By Bio-Reactor Type
5.1 Batch Reactors
5.2 Continuous Flow Reactors
5.3 Photobioreactors
5.4 Membrane-Integrated Reactors
6 Global Bio-Reactors for Green Chemical Synthesis Market, By Feedstock
6.1 Algal Biomass
6.2 Bacterial Cultures
6.3 Yeast Strains
6.4 Lignocellulosic Plant Biomass
7 Global Bio-Reactors for Green Chemical Synthesis Market, By Application
7.1 Pharmaceutical Synthesis
7.2 Biofuel Production
7.3 Specialty & Fine Chemicals
7.4 Food & Beverage Bioprocessing
8 Global Bio-Reactors for Green Chemical Synthesis Market, By End User
8.1 Chemical Manufacturing Industry
8.2 Energy & Power Sector
8.3 Healthcare & Life Sciences Enterprises
8.4 Agricultural & Agri-Biotech Sector
9 Global Bio-Reactors for Green Chemical Synthesis Market, By Geography
9.1 North America
9.1.1 United States
9.1.2 Canada
9.1.3 Mexico
9.2 Europe
9.2.1 United Kingdom
9.2.2 Germany
9.2.3 France
9.2.4 Italy
9.2.5 Spain
9.2.6 Netherlands
9.2.7 Belgium
9.2.8 Sweden
9.2.9 Switzerland
9.2.10 Poland
9.2.11 Rest of Europe
9.3 Asia Pacific
9.3.1 China
9.3.2 Japan
9.3.3 India
9.3.4 South Korea
9.3.5 Australia
9.3.6 Indonesia
9.3.7 Thailand
9.3.8 Malaysia
9.3.9 Singapore
9.3.10 Vietnam
9.3.11 Rest of Asia Pacific
9.4 South America
9.4.1 Brazil
9.4.2 Argentina
9.4.3 Colombia
9.4.4 Chile
9.4.5 Peru
9.4.6 Rest of South America
9.5 Rest of the World (RoW)
9.5.1 Middle East
9.5.1.1 Saudi Arabia
9.5.1.2 United Arab Emirates
9.5.1.3 Qatar
9.5.1.4 Israel
9.5.1.5 Rest of Middle East
9.5.2 Africa
9.5.2.1 South Africa
9.5.2.2 Egypt
9.5.2.3 Morocco
9.5.2.4 Rest of Africa
10 Strategic Market Intelligence
10.1 Industry Value Network and Supply Chain Assessment
10.2 White-Space and Opportunity Mapping
10.3 Product Evolution and Market Life Cycle Analysis
10.4 Channel, Distributor, and Go-to-Market Assessment
11 Industry Developments and Strategic Initiatives
11.1 Mergers and Acquisitions
11.2 Partnerships, Alliances, and Joint Ventures
11.3 New Product Launches and Certifications
11.4 Capacity Expansion and Investments
11.5 Other Strategic Initiatives
12 Company Profiles
12.1 ABEC, Inc.
12.2 Adolf Kühner AG
12.3 BBI-biotech GmbH
12.4 Belach Bioteknik AB
12.5 Bioengineering AG
12.6 CerCell A/S
12.7 Cesco Bioengineering Co., Ltd.
12.8 FiberCell Systems Inc.
12.9 G&G Technologies, Inc.
12.10 GEA Group AG
12.11 Getinge AB
12.12 Sartorius AG
12.13 Praj Industries Limited
12.14 Thermo Fisher Scientific Inc.
12.15 Merck KGaA
12.16 Danaher Corporation
12.17 Eppendorf AG
12.18 Applikon Biotechnology
List of Tables
1 Global Bio-Reactors for Green Chemical Synthesis Market Outlook, By Region (2023-2034) ($MN)
2 Global Bio-Reactors for Green Chemical Synthesis Market Outlook, By Bio-Reactor Type (2023-2034) ($MN)
3 Global Bio-Reactors for Green Chemical Synthesis Market Outlook, By Batch Reactors (2023-2034) ($MN)
4 Global Bio-Reactors for Green Chemical Synthesis Market Outlook, By Continuous Flow Reactors (2023-2034) ($MN)
5 Global Bio-Reactors for Green Chemical Synthesis Market Outlook, By Photobioreactors (2023-2034) ($MN)
6 Global Bio-Reactors for Green Chemical Synthesis Market Outlook, By Membrane-Integrated Reactors (2023-2034) ($MN)
7 Global Bio-Reactors for Green Chemical Synthesis Market Outlook, By Feedstock (2023-2034) ($MN)
8 Global Bio-Reactors for Green Chemical Synthesis Market Outlook, By Algal Biomass (2023-2034) ($MN)
9 Global Bio-Reactors for Green Chemical Synthesis Market Outlook, By Bacterial Cultures (2023-2034) ($MN)
10 Global Bio-Reactors for Green Chemical Synthesis Market Outlook, By Yeast Strains (2023-2034) ($MN)
11 Global Bio-Reactors for Green Chemical Synthesis Market Outlook, By Lignocellulosic Plant Biomass (2023-2034) ($MN)
12 Global Bio-Reactors for Green Chemical Synthesis Market Outlook, By Application (2023-2034) ($MN)
13 Global Bio-Reactors for Green Chemical Synthesis Market Outlook, By Pharmaceutical Synthesis (2023-2034) ($MN)
14 Global Bio-Reactors for Green Chemical Synthesis Market Outlook, By Biofuel Production (2023-2034) ($MN)
15 Global Bio-Reactors for Green Chemical Synthesis Market Outlook, By Specialty & Fine Chemicals (2023-2034) ($MN)
16 Global Bio-Reactors for Green Chemical Synthesis Market Outlook, By Food & Beverage Bioprocessing (2023-2034) ($MN)
17 Global Bio-Reactors for Green Chemical Synthesis Market Outlook, By End User (2023-2034) ($MN)
18 Global Bio-Reactors for Green Chemical Synthesis Market Outlook, By Chemical Manufacturing Industry (2023-2034) ($MN)
19 Global Bio-Reactors for Green Chemical Synthesis Market Outlook, By Energy & Power Sector (2023-2034) ($MN)
20 Global Bio-Reactors for Green Chemical Synthesis Market Outlook, By Healthcare & Life Sciences Enterprises (2023-2034) ($MN)
21 Global Bio-Reactors for Green Chemical Synthesis Market Outlook, By Agricultural & Agri-Biotech Sector (2023-2034) ($MN)
Note: Tables for North America, Europe, APAC, South America, and Rest of the World (RoW) Regions are also represented in the same manner as above.
List of Figures
RESEARCH METHODOLOGY

We at ‘Stratistics’ opt for an extensive research approach which involves data mining, data validation, and data analysis. The various research sources include in-house repository, secondary research, competitor’s sources, social media research, client internal data, and primary research.
Our team of analysts prefers the most reliable and authenticated data sources in order to perform the comprehensive literature search. With access to most of the authenticated data bases our team highly considers the best mix of information through various sources to obtain extensive and accurate analysis.
Each report takes an average time of a month and a team of 4 industry analysts. The time may vary depending on the scope and data availability of the desired market report. The various parameters used in the market assessment are standardized in order to enhance the data accuracy.
Data Mining
The data is collected from several authenticated, reliable, paid and unpaid sources and is filtered depending on the scope & objective of the research. Our reports repository acts as an added advantage in this procedure. Data gathering from the raw material suppliers, distributors and the manufacturers is performed on a regular basis, this helps in the comprehensive understanding of the products value chain. Apart from the above mentioned sources the data is also collected from the industry consultants to ensure the objective of the study is in the right direction.
Market trends such as technological advancements, regulatory affairs, market dynamics (Drivers, Restraints, Opportunities and Challenges) are obtained from scientific journals, market related national & international associations and organizations.
Data Analysis
From the data that is collected depending on the scope & objective of the research the data is subjected for the analysis. The critical steps that we follow for the data analysis include:
- Product Lifecycle Analysis
- Competitor analysis
- Risk analysis
- Porters Analysis
- PESTEL Analysis
- SWOT Analysis
The data engineering is performed by the core industry experts considering both the Marketing Mix Modeling and the Demand Forecasting. The marketing mix modeling makes use of multiple-regression techniques to predict the optimal mix of marketing variables. Regression factor is based on a number of variables and how they relate to an outcome such as sales or profits.
Data Validation
The data validation is performed by the exhaustive primary research from the expert interviews. This includes telephonic interviews, focus groups, face to face interviews, and questionnaires to validate our research from all aspects. The industry experts we approach come from the leading firms, involved in the supply chain ranging from the suppliers, distributors to the manufacturers and consumers so as to ensure an unbiased analysis.
We are in touch with more than 15,000 industry experts with the right mix of consultants, CEO's, presidents, vice presidents, managers, experts from both supply side and demand side, executives and so on.
The data validation involves the primary research from the industry experts belonging to:
- Leading Companies
- Suppliers & Distributors
- Manufacturers
- Consumers
- Industry/Strategic Consultants
Apart from the data validation the primary research also helps in performing the fill gap research, i.e. providing solutions for the unmet needs of the research which helps in enhancing the reports quality.
For more details about research methodology, kindly write to us at info@strategymrc.com
Frequently Asked Questions
In case of any queries regarding this report, you can contact the customer service by filing the “Inquiry Before Buy” form available on the right hand side. You may also contact us through email: info@strategymrc.com or phone: +1-301-202-5929
Yes, the samples are available for all the published reports. You can request them by filling the “Request Sample” option available in this page.
Yes, you can request a sample with your specific requirements. All the customized samples will be provided as per the requirement with the real data masked.
All our reports are available in Digital PDF format. In case if you require them in any other formats, such as PPT, Excel etc you can submit a request through “Inquiry Before Buy” form available on the right hand side. You may also contact us through email: info@strategymrc.com or phone: +1-301-202-5929
We offer a free 15% customization with every purchase. This requirement can be fulfilled for both pre and post sale. You may send your customization requirements through email at info@strategymrc.com or call us on +1-301-202-5929.
We have 3 different licensing options available in electronic format.
- Single User Licence: Allows one person, typically the buyer, to have access to the ordered product. The ordered product cannot be distributed to anyone else.
- 2-5 User Licence: Allows the ordered product to be shared among a maximum of 5 people within your organisation.
- Corporate License: Allows the product to be shared among all employees of your organisation regardless of their geographical location.
All our reports are typically be emailed to you as an attachment.
To order any available report you need to register on our website. The payment can be made either through CCAvenue or PayPal payments gateways which accept all international cards.
We extend our support to 6 months post sale. A post sale customization is also provided to cover your unmet needs in the report.
Request Customization
We offer complimentary customization of up to 15% with every purchase. To share your customization requirements, feel free to email us at info@strategymrc.com or call us on +1-301-202-5929. .
Please Note: Customization within the 15% threshold is entirely free of charge. If your request exceeds this limit, we will conduct a feasibility assessment. Following that, a detailed quote and timeline will be provided.
WHY CHOOSE US ?

Assured Quality
Best in class reports with high standard of research integrity

24X7 Research Support
Continuous support to ensure the best customer experience.

Free Customization
Adding more values to your product of interest.

Safe & Secure Access
Providing a secured environment for all online transactions.

Trusted by 600+ Brands
Serving the most reputed brands across the world.