
Biopharmaceutical Licensing Market
Biopharmaceutical Licensing Market Forecasts to 2032 – Global Analysis By Deal Type (In-Licensing, Out-Licensing, Co-Development, Joint Venture, Manufacturing Licenses and Other Deal Types), Licensing Model (Exclusive License, Field-Limited License and Non-Exclusive License), Stage of Development, Modality, Application, End User and By Geography

According to Stratistics MRC, the Global Biopharmaceutical Licensing Market is accounted for $240.5 billion in 2025 and is expected to reach $2,599.6 billion by 2032 growing at a CAGR of 40.5% during the forecast period. Biopharmaceutical licensing is a formal agreement wherein intellectual property rights typically patents or proprietary technologies are granted by one party (licensor) to another (licensee) for development, manufacturing, or commercialization of biologic-based products. These arrangements enable companies to access innovative therapies, expand portfolios, and share risks and costs associated with R&D and regulatory approval. Licensing may be exclusive or non-exclusive, and often includes provisions for royalties, milestone payments, and co-development rights, fostering strategic collaboration across the biopharma value chain
Market Dynamics:
Driver:
Patent cliffs and pipeline replenishment
Licensing agreements especially out-licensing have become strategic tools to monetize underutilized assets and accelerate development timelines. Emerging biotech firms are increasingly sought after for their innovative platforms, offering novel therapeutic candidates that can fill gaps in large pharma portfolios. This dynamic is fostering a surge in deal activity, particularly in areas with unmet clinical needs. Moreover, the urgency to maintain competitive advantage is driving companies to explore early-stage licensing opportunities and collaborative R&D models.
Restraint:
Valuation and deal structure challenges
Determining fair market value for early-stage technologies is inherently complex, often involving speculative forecasts and limited clinical data. Negotiations are further complicated by royalty structures, milestone payments, and territorial rights, which can dilute perceived value. Smaller firms may lack the financial or legal expertise to navigate these intricacies, while larger players are cautious about overpaying for unproven assets. These hurdles can delay or derail promising partnerships, especially in competitive therapeutic areas.
Opportunity:
Focus on niche and high-value therapeutic areas
Licensing activity is increasingly concentrated in specialized domains such as rare diseases, oncology, and cell & gene therapies, where innovation is rapid and pricing power remains strong. These segments offer attractive returns due to limited competition and high unmet medical needs. Companies are targeting assets with orphan drug designation or breakthrough therapy status to capitalize on regulatory incentives and expedited approval pathways. This trend is reshaping portfolio strategies across the industry.
Threat:
Macroeconomic instability & lack of due diligence
Licensing negotiations are also vulnerable to inadequate due diligence, which can result in unforeseen liabilities, IP disputes, or clinical setbacks post-deal. As competition intensifies, some firms may rush into agreements without fully assessing regulatory risks, manufacturing scalability, or market access barriers. This can lead to costly renegotiations or failed partnerships. Ensuring robust technical, legal, and commercial evaluations is critical to mitigating these risks and sustaining long-term value creation.
Covid-19 Impact:
The pandemic reshaped licensing dynamics by accelerating interest in infectious disease platforms and digital therapeutics. While initial disruptions in clinical trials and regulatory reviews slowed deal flow, the urgency to develop COVID-related treatments and diagnostics led to a spike in licensing agreements, particularly for mRNA technologies and antiviral candidates. Remote collaboration tools and virtual due diligence processes became standard, streamlining cross-border transactions.
The out-licensing segment is expected to be the largest during the forecast period
The out-licensing segment is expected to account for the largest market share during the forecast period due to its strategic role in monetizing non-core assets and expanding market reach. It enables originator companies to leverage external expertise for clinical development and commercialization, especially in regions where they lack infrastructure. This model is particularly favored by biotech firms seeking upfront capital and risk-sharing arrangements fueling out-licensing activity, making it the preferred route for portfolio optimization and global expansion.
The cell & gene therapies (CGT) segment is expected to have the highest CAGR during the forecast period
Over the forecast period, the cell & gene therapies (CGT) segment is predicted to witness the highest growth rate driven by breakthroughs in regenerative medicine, immuno-oncology, and personalized therapies. Licensing deals in this space are surging as companies seek access to proprietary vectors, manufacturing platforms, and delivery technologies. High clinical success rates and premium pricing potential make CGT assets highly attractive for licensing, despite their complex regulatory and production requirements.
Region with largest share:
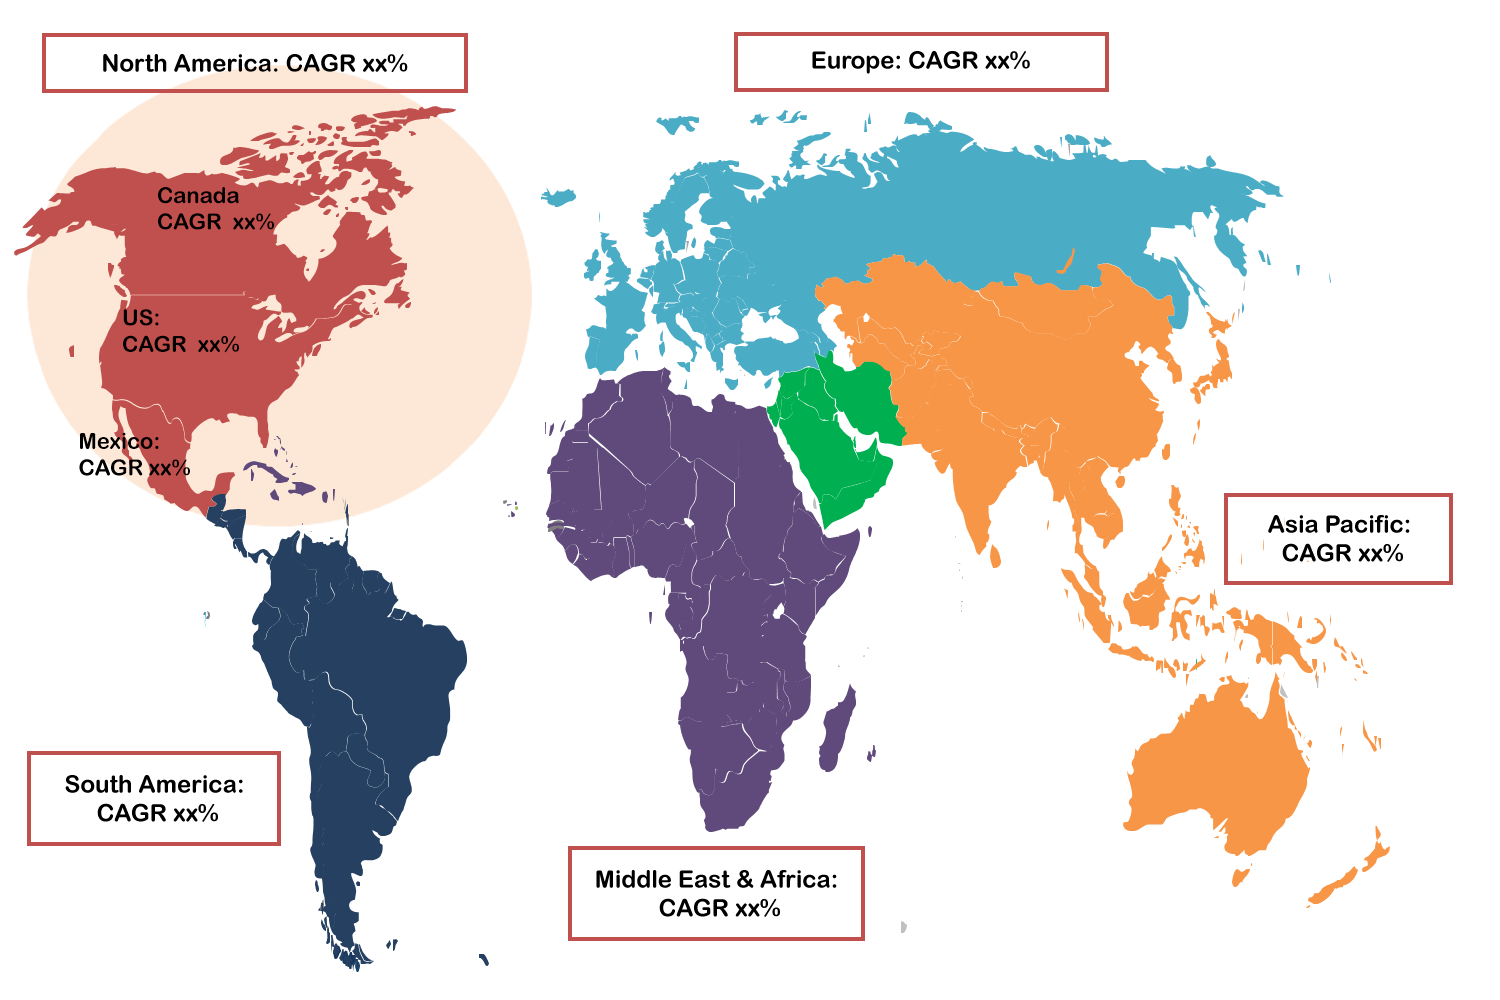
During the forecast period, the North America region is expected to hold the largest market share attributed to robust innovation ecosystem, favorable IP frameworks, and strong venture capital activity. The region hosts numerous biotech hubs, academic research centers, and regulatory agencies that facilitate deal-making. U.S.-based companies are particularly active in out-licensing and cross-border collaborations, leveraging their advanced R&D capabilities and global networks.
Region with highest CAGR:
Over the forecast period, the North America region is anticipated to exhibit the highest CAGR reflecting its dynamic pipeline and aggressive pursuit of novel therapies. The region’s emphasis on precision medicine, digital health integration, and accelerated approval pathways is attracting global interest in licensing U.S.-originated assets. Strategic policy initiatives, such as tax incentives for R&D and streamlined regulatory processes, are further enhancing deal velocity.
Key players in the market
Some of the key players in Biopharmaceutical Licensing Market include Novartis, Pfizer, Roche, Johnson & Johnson, Merck & Co., AstraZeneca, Sanofi, GlaxoSmithKline (GSK), AbbVie, Bristol-Myers Squibb (BMS), Amgen, Eli Lilly & Company, Takeda Pharmaceutical Company, Gilead Sciences, Regeneron Pharmaceuticals, Biogen, Vertex Pharmaceuticals, Moderna, Bayer AG, and Incyte Corporation.
Key Developments:
In July 2025, AstraZeneca reported Priority Review & Breakthrough Therapy designation (US) for IMFINZI® in resectable early-stage gastric/gastroesophageal junction cancers. The company cited positive Phase 3 results and said the regulatory designations could accelerate patient access.
In July 2025, Novartis received approval for Coartem® Baby, the first malaria medicine formulated for newborns and very young infants. The company said this enables faster regulatory routes in African countries and expands access for the most vulnerable patients.
In June 2025, AbbVie announced a definitive agreement to acquire Capstan Therapeutics and later public filings/updates on the transaction. AbbVie said the deal adds an in-vivo tLNP CAR-T candidate and strengthens its immunology and cell-engineering capabilities.
Deal Types Covered:
• In-Licensing
• Out-Licensing
• Co-Development
• Joint Venture
• Manufacturing Licenses
• Other Deal Types
Licensing Models Covered:
• Exclusive License
• Field-Limited License
• Non-Exclusive License
Stage of Developments Covered:
• Discovery & Preclinical Stage
• Phase I
• Phase II
• Phase III
• Commercialization/Marketed Product Stage
Modalities Covered:
• Monoclonal Antibodies (mAbs) & Biologics
• Cell & Gene Therapies (CGT)
• mRNA & Nucleic Acid Therapies
• Vaccines
• Small Biologics-Derived Molecules
• Recombinant Proteins
• Other Modalities
Applications Covered:
• Oncology
• Immunology
• Infectious Diseases
• Cardiovascular Diseases
• Neurological Diseases
• Metabolic & Endocrine Diseases
• Rare Diseases
• Other Applications
End Users Covered:
• Biotech & Mid-Caps
• Contract Research Organizations
• Contract Development & Manufacturing Organizations
• Academic & Research Institutes
• Other End Users
Regions Covered:
• North America
o US
o Canada
o Mexico
• Europe
o Germany
o UK
o Italy
o France
o Spain
o Rest of Europe
• Asia Pacific
o Japan
o China
o India
o Australia
o New Zealand
o South Korea
o Rest of Asia Pacific
• South America
o Argentina
o Brazil
o Chile
o Rest of South America
• Middle East & Africa
o Saudi Arabia
o UAE
o Qatar
o South Africa
o Rest of Middle East & Africa
What our report offers:
- Market share assessments for the regional and country-level segments
- Strategic recommendations for the new entrants
- Covers Market data for the years 2024, 2025, 2026, 2028, and 2032
- Market Trends (Drivers, Constraints, Opportunities, Threats, Challenges, Investment Opportunities, and recommendations)
- Strategic recommendations in key business segments based on the market estimations
- Competitive landscaping mapping the key common trends
- Company profiling with detailed strategies, financials, and recent developments
- Supply chain trends mapping the latest technological advancements
Free Customization Offerings:
All the customers of this report will be entitled to receive one of the following free customization options:
• Company Profiling
o Comprehensive profiling of additional market players (up to 3)
o SWOT Analysis of key players (up to 3)
• Regional Segmentation
o Market estimations, Forecasts and CAGR of any prominent country as per the client's interest (Note: Depends on feasibility check)
• Competitive Benchmarking
o Benchmarking of key players based on product portfolio, geographical presence, and strategic alliances
Table of Contents
1 Executive Summary
2 Preface
2.1 Abstract
2.2 Stake Holders
2.3 Research Scope
2.4 Research Methodology
2.4.1 Data Mining
2.4.2 Data Analysis
2.4.3 Data Validation
2.4.4 Research Approach
2.5 Research Sources
2.5.1 Primary Research Sources
2.5.2 Secondary Research Sources
2.5.3 Assumptions
3 Market Trend Analysis
3.1 Introduction
3.2 Drivers
3.3 Restraints
3.4 Opportunities
3.5 Threats
3.6 Application Analysis
3.7 End User Analysis
3.8 Emerging Markets
3.9 Impact of Covid-19
4 Porters Five Force Analysis
4.1 Bargaining power of suppliers
4.2 Bargaining power of buyers
4.3 Threat of substitutes
4.4 Threat of new entrants
4.5 Competitive rivalry
5 Global Biopharmaceutical Licensing Market, By Deal Type
5.1 Introduction
5.2 In-Licensing
5.3 Out-Licensing
5.4 Co-Development
5.5 Joint Venture
5.6 Manufacturing Licenses
5.7 Other Deal Types
6 Global Biopharmaceutical Licensing Market, By Licensing Model
6.1 Introduction
6.2 Exclusive License
6.3 Field-Limited License
6.4 Non-Exclusive License
7 Global Biopharmaceutical Licensing Market, By Stage of Development
7.1 Introduction
7.2 Discovery & Preclinical Stage
7.3 Phase I
7.4 Phase II
7.5 Phase III
7.6 Commercialization/Marketed Product Stage
8 Global Biopharmaceutical Licensing Market, By Modality
8.1 Introduction
8.2 Monoclonal Antibodies (mAbs) & Biologics
8.3 Cell & Gene Therapies (CGT)
8.4 mRNA & Nucleic Acid Therapies
8.5 Vaccines
8.6 Small Biologics-Derived Molecules
8.7 Recombinant Proteins
8.8 Other Modalities
9 Global Biopharmaceutical Licensing Market, By Application
9.1 Introduction
9.2 Oncology
9.3 Immunology
9.4 Infectious Diseases
9.5 Cardiovascular Diseases
9.6 Neurological Diseases
9.7 Metabolic & Endocrine Diseases
9.8 Rare Diseases
9.9 Other Applications
10 Global Biopharmaceutical Licensing Market, By End User
10.1 Introduction
10.2 Biotech & Mid-Caps
10.3 Contract Research Organizations
10.4 Contract Development & Manufacturing Organizations
10.5 Academic & Research Institutes
10.6 Other End Users
11 Global Biopharmaceutical Licensing Market, By Geography
11.1 Introduction
11.2 North America
11.2.1 US
11.2.2 Canada
11.2.3 Mexico
11.3 Europe
11.3.1 Germany
11.3.2 UK
11.3.3 Italy
11.3.4 France
11.3.5 Spain
11.3.6 Rest of Europe
11.4 Asia Pacific
11.4.1 Japan
11.4.2 China
11.4.3 India
11.4.4 Australia
11.4.5 New Zealand
11.4.6 South Korea
11.4.7 Rest of Asia Pacific
11.5 South America
11.5.1 Argentina
11.5.2 Brazil
11.5.3 Chile
11.5.4 Rest of South America
11.6 Middle East & Africa
11.6.1 Saudi Arabia
11.6.2 UAE
11.6.3 Qatar
11.6.4 South Africa
11.6.5 Rest of Middle East & Africa
12 Key Developments
12.1 Agreements, Partnerships, Collaborations and Joint Ventures
12.2 Acquisitions & Mergers
12.3 New Product Launch
12.4 Expansions
12.5 Other Key Strategies
13 Company Profiling
13.1 Novartis
13.2 Pfizer
13.3 Roche
13.4 Johnson & Johnson
13.5 Merck & Co.
13.6 AstraZeneca
13.7 Sanofi
13.8 GlaxoSmithKline (GSK)
13.9 AbbVie
13.10 Bristol-Myers Squibb (BMS)
13.11 Amgen
13.12 Eli Lilly & Company
13.13 Takeda Pharmaceutical Company
13.14 Gilead Sciences
13.15 Regeneron Pharmaceuticals
13.16 Biogen
13.17 Vertex Pharmaceuticals
13.18 Moderna
13.19 Bayer AG
13.20 Incyte Corporation
List of Tables
1 Global Biopharmaceutical Licensing Market Outlook, By Region (2024-2032) ($MN)
2 Global Biopharmaceutical Licensing Market Outlook, By Deal Type (2024-2032) ($MN)
3 Global Biopharmaceutical Licensing Market Outlook, By In-Licensing (2024-2032) ($MN)
4 Global Biopharmaceutical Licensing Market Outlook, By Out-Licensing (2024-2032) ($MN)
5 Global Biopharmaceutical Licensing Market Outlook, By Co-Development (2024-2032) ($MN)
6 Global Biopharmaceutical Licensing Market Outlook, By Joint Venture (2024-2032) ($MN)
7 Global Biopharmaceutical Licensing Market Outlook, By Manufacturing Licenses (2024-2032) ($MN)
8 Global Biopharmaceutical Licensing Market Outlook, By Other Deal Types (2024-2032) ($MN)
9 Global Biopharmaceutical Licensing Market Outlook, By Licensing Model (2024-2032) ($MN)
10 Global Biopharmaceutical Licensing Market Outlook, By Exclusive License (2024-2032) ($MN)
11 Global Biopharmaceutical Licensing Market Outlook, By Field-Limited License (2024-2032) ($MN)
12 Global Biopharmaceutical Licensing Market Outlook, By Non-Exclusive License (2024-2032) ($MN)
13 Global Biopharmaceutical Licensing Market Outlook, By Stage of Development (2024-2032) ($MN)
14 Global Biopharmaceutical Licensing Market Outlook, By Discovery & Preclinical Stage (2024-2032) ($MN)
15 Global Biopharmaceutical Licensing Market Outlook, By Phase I (2024-2032) ($MN)
16 Global Biopharmaceutical Licensing Market Outlook, By Phase II (2024-2032) ($MN)
17 Global Biopharmaceutical Licensing Market Outlook, By Phase III (2024-2032) ($MN)
18 Global Biopharmaceutical Licensing Market Outlook, By Commercialization/Marketed Product Stage (2024-2032) ($MN)
19 Global Biopharmaceutical Licensing Market Outlook, By Modality (2024-2032) ($MN)
20 Global Biopharmaceutical Licensing Market Outlook, By Monoclonal Antibodies (mAbs) & Biologics (2024-2032) ($MN)
21 Global Biopharmaceutical Licensing Market Outlook, By Cell & Gene Therapies (CGT) (2024-2032) ($MN)
22 Global Biopharmaceutical Licensing Market Outlook, By mRNA & Nucleic Acid Therapies (2024-2032) ($MN)
23 Global Biopharmaceutical Licensing Market Outlook, By Vaccines (2024-2032) ($MN)
24 Global Biopharmaceutical Licensing Market Outlook, By Small Biologics-Derived Molecules (2024-2032) ($MN)
25 Global Biopharmaceutical Licensing Market Outlook, By Recombinant Proteins (2024-2032) ($MN)
26 Global Biopharmaceutical Licensing Market Outlook, By Other Modalities (2024-2032) ($MN)
27 Global Biopharmaceutical Licensing Market Outlook, By Application (2024-2032) ($MN)
28 Global Biopharmaceutical Licensing Market Outlook, By Oncology (2024-2032) ($MN)
29 Global Biopharmaceutical Licensing Market Outlook, By Immunology (2024-2032) ($MN)
30 Global Biopharmaceutical Licensing Market Outlook, By Infectious Diseases (2024-2032) ($MN)
31 Global Biopharmaceutical Licensing Market Outlook, By Cardiovascular Diseases (2024-2032) ($MN)
32 Global Biopharmaceutical Licensing Market Outlook, By Neurological Diseases (2024-2032) ($MN)
33 Global Biopharmaceutical Licensing Market Outlook, By Metabolic & Endocrine Diseases (2024-2032) ($MN)
34 Global Biopharmaceutical Licensing Market Outlook, By Rare Diseases (2024-2032) ($MN)
35 Global Biopharmaceutical Licensing Market Outlook, By Other Applications (2024-2032) ($MN)
36 Global Biopharmaceutical Licensing Market Outlook, By End User (2024-2032) ($MN)
37 Global Biopharmaceutical Licensing Market Outlook, By Biotech & Mid-Caps (2024-2032) ($MN)
38 Global Biopharmaceutical Licensing Market Outlook, By Contract Research Organizations (2024-2032) ($MN)
39 Global Biopharmaceutical Licensing Market Outlook, By Contract Development & Manufacturing Organizations (2024-2032) ($MN)
40 Global Biopharmaceutical Licensing Market Outlook, By Academic & Research Institutes (2024-2032) ($MN)
41 Global Biopharmaceutical Licensing Market Outlook, By Other End Users (2024-2032) ($MN)
Note: Tables for North America, Europe, APAC, South America, and Middle East & Africa Regions are also represented in the same manner as above.
List of Figures
RESEARCH METHODOLOGY

We at ‘Stratistics’ opt for an extensive research approach which involves data mining, data validation, and data analysis. The various research sources include in-house repository, secondary research, competitor’s sources, social media research, client internal data, and primary research.
Our team of analysts prefers the most reliable and authenticated data sources in order to perform the comprehensive literature search. With access to most of the authenticated data bases our team highly considers the best mix of information through various sources to obtain extensive and accurate analysis.
Each report takes an average time of a month and a team of 4 industry analysts. The time may vary depending on the scope and data availability of the desired market report. The various parameters used in the market assessment are standardized in order to enhance the data accuracy.
Data Mining
The data is collected from several authenticated, reliable, paid and unpaid sources and is filtered depending on the scope & objective of the research. Our reports repository acts as an added advantage in this procedure. Data gathering from the raw material suppliers, distributors and the manufacturers is performed on a regular basis, this helps in the comprehensive understanding of the products value chain. Apart from the above mentioned sources the data is also collected from the industry consultants to ensure the objective of the study is in the right direction.
Market trends such as technological advancements, regulatory affairs, market dynamics (Drivers, Restraints, Opportunities and Challenges) are obtained from scientific journals, market related national & international associations and organizations.
Data Analysis
From the data that is collected depending on the scope & objective of the research the data is subjected for the analysis. The critical steps that we follow for the data analysis include:
- Product Lifecycle Analysis
- Competitor analysis
- Risk analysis
- Porters Analysis
- PESTEL Analysis
- SWOT Analysis
The data engineering is performed by the core industry experts considering both the Marketing Mix Modeling and the Demand Forecasting. The marketing mix modeling makes use of multiple-regression techniques to predict the optimal mix of marketing variables. Regression factor is based on a number of variables and how they relate to an outcome such as sales or profits.
Data Validation
The data validation is performed by the exhaustive primary research from the expert interviews. This includes telephonic interviews, focus groups, face to face interviews, and questionnaires to validate our research from all aspects. The industry experts we approach come from the leading firms, involved in the supply chain ranging from the suppliers, distributors to the manufacturers and consumers so as to ensure an unbiased analysis.
We are in touch with more than 15,000 industry experts with the right mix of consultants, CEO's, presidents, vice presidents, managers, experts from both supply side and demand side, executives and so on.
The data validation involves the primary research from the industry experts belonging to:
- Leading Companies
- Suppliers & Distributors
- Manufacturers
- Consumers
- Industry/Strategic Consultants
Apart from the data validation the primary research also helps in performing the fill gap research, i.e. providing solutions for the unmet needs of the research which helps in enhancing the reports quality.
For more details about research methodology, kindly write to us at info@strategymrc.com
Frequently Asked Questions
In case of any queries regarding this report, you can contact the customer service by filing the “Inquiry Before Buy” form available on the right hand side. You may also contact us through email: info@strategymrc.com or phone: +1-301-202-5929
Yes, the samples are available for all the published reports. You can request them by filling the “Request Sample” option available in this page.
Yes, you can request a sample with your specific requirements. All the customized samples will be provided as per the requirement with the real data masked.
All our reports are available in Digital PDF format. In case if you require them in any other formats, such as PPT, Excel etc you can submit a request through “Inquiry Before Buy” form available on the right hand side. You may also contact us through email: info@strategymrc.com or phone: +1-301-202-5929
We offer a free 15% customization with every purchase. This requirement can be fulfilled for both pre and post sale. You may send your customization requirements through email at info@strategymrc.com or call us on +1-301-202-5929.
We have 3 different licensing options available in electronic format.
- Single User Licence: Allows one person, typically the buyer, to have access to the ordered product. The ordered product cannot be distributed to anyone else.
- 2-5 User Licence: Allows the ordered product to be shared among a maximum of 5 people within your organisation.
- Corporate License: Allows the product to be shared among all employees of your organisation regardless of their geographical location.
All our reports are typically be emailed to you as an attachment.
To order any available report you need to register on our website. The payment can be made either through CCAvenue or PayPal payments gateways which accept all international cards.
We extend our support to 6 months post sale. A post sale customization is also provided to cover your unmet needs in the report.
Request Customization
We offer complimentary customization of up to 15% with every purchase. To share your customization requirements, feel free to email us at info@strategymrc.com or call us on +1-301-202-5929. .
Please Note: Customization within the 15% threshold is entirely free of charge. If your request exceeds this limit, we will conduct a feasibility assessment. Following that, a detailed quote and timeline will be provided.
WHY CHOOSE US ?

Assured Quality
Best in class reports with high standard of research integrity

24X7 Research Support
Continuous support to ensure the best customer experience.

Free Customization
Adding more values to your product of interest.

Safe & Secure Access
Providing a secured environment for all online transactions.

Trusted by 600+ Brands
Serving the most reputed brands across the world.
