
Brain Mapping Instruments Market
Brain Mapping Instruments Market Forecasts to 2030 - Global Analysis By Product Type (Magnetic Resonance Imaging (MRI), Near-Infrared Spectroscopy (NIRS), Electroencephalography (EEG), Positron Emission Tomography (PET), Computed Tomography and Other Product Types), End User and By Geography

|
Years Covered |
2021-2030 |
|
Estimated Year Value (2023) |
US $2.5 BN |
|
Projected Year Value (2030) |
US $4.2 BN |
|
CAGR (2023 - 2030) |
8.1% |
|
Regions Covered |
North America, Europe, Asia Pacific, South America, and Middle East & Africa |
|
Countries Covered |
US, Canada, Mexico, Germany, UK, Italy, France, Spain, Japan, China, India, Australia, New Zealand, South Korea, Rest of Asia Pacific, South America, Argentina, Brazil, Chile, Middle East & Africa, Saudi Arabia, UAE, Qatar, and South Africa |
|
Largest Market |
North America |
|
Highest Growing Market |
Asia Pacific |
According to Stratistics MRC, the Global Brain Mapping Instruments Market is accounted for $2.5 billion in 2023 and is expected to reach $4.2 billion by 2030 growing at a CAGR of 8.1% during the forecast period. The most accurate technique to detect and safeguard important brain regions while removing a tumor is through brain mapping. This operation may be necessary for patients whose tumors are close to the linguistic, motor, or sensory parts of the brain. Doctors have been able to remove as much of a brain tumor as feasible while limiting the effect on the vital regions of the brain that regulate movement, speech, and the senses.
According to the September 2021 update by the World Health Organization (WHO), about 55 million people worldwide were living with dementia in 2021, and nearly 10 million cases are reported every year.
Market Dynamics:
Driver:
Increase in neurological conditions
The prevalence of neurological disorders among the target population means that the use of brain mapping instruments in the medical device industry is likely to grow more rapidly, opening up new opportunities for the market for these tools. Additionally, the increased introduction of new products by several major players globally as a result of enhanced technology is anticipated to positively affect market growth.
Restraint:
High costs
The cost of purchasing and maintaining brain mapping equipment like MRI scanners, EEG systems, and MEG devices can be high. These instruments' high costs can be a constraint, especially for healthcare facilities with limited funds. The cost of the tools may prevent their widespread use, particularly in areas with limited resources.
Opportunity:
Technological development
The market for brain mapping instruments has a lot of potential due to the ongoing developments in brain imaging and mapping technology. In order to map brain activity more precisely, new imaging techniques, including functional magnetic resonance imaging (fMRI), electroencephalography (EEG), and magnetoencephalography (MEG), offer greater spatial and temporal resolution. Additionally, technology development has produced more complex and precise instruments for mapping the human brain. These technologies provide better data collection and analysis capacities, higher-quality images, and improved communication with other systems and devices. These advancements offer scientists and researchers a better understanding of how the brain works, how neural networks work, and how related illnesses work.
Threat:
Accessibility issues
Not all locations have equal access to brain mapping instruments, particularly rural and low-income nations. The accessibility and availability of brain mapping tools may be constrained by a lack of infrastructure, including healthcare facilities and competent workers. However, as it prevents the general adoption of these technologies, this restricted accessibility limits market expansion.
Covid-19 Impact:
An unexpected global public health emergency, COVID-19, has had an impact on practically every business. For instance, COVID-19 not only affects the respiratory system but also causes neurological and neuropsychiatric diseases, according to an article published in the Journal of Alzheimer's Diseases in December 2021. According to this, the virus may have an impact on the central nervous system (CNS), which could lead to cognitive impairment even after COVID-19 symptoms have subsided. As a result, people with COVID-19 developed worse neurological conditions. As a result, there was a need for brain mapping instruments, which had a major effect on market expansion during the epidemic.
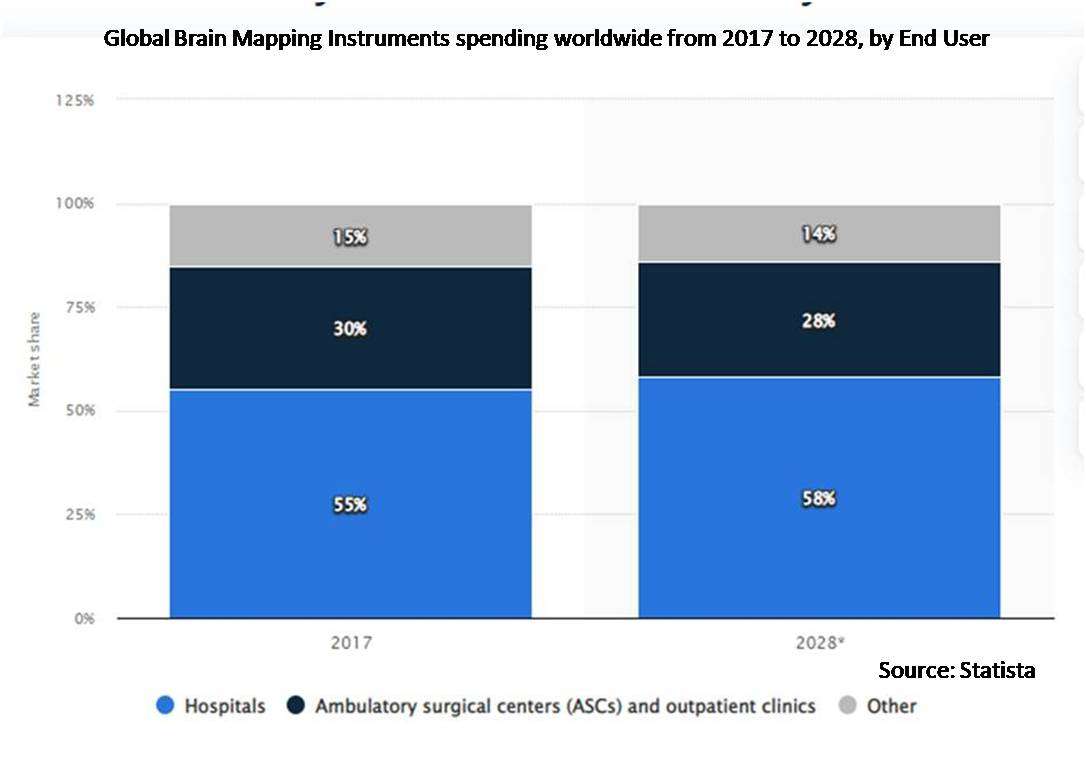
The hospitals segment is expected to be the largest during the forecast period
Due to a rise in hospital admissions and product launches by the major market participants, the hospital segment dominated the largest share over the forecast period. The expansion of the market is also being fueled by the rising number of hospitals in the United States. According to numbers from the American Heart Association (AHA) released in January 2021, there were 1,228 investor-owned (for-profit) community hospitals in the United States in 2021, compared to 951 state and local government community hospitals. Moreover, the demand for brain mapping instruments is generated by the enormous number of hospitals, which is anticipated to fuel market expansion.
The Electroencephalography (EEG) segment is expected to have the highest CAGR during the forecast period
Due to its capabilities of using imaging techniques to diagnose brain illnesses, including epilepsy and seizures, the electroencephalography (EEG) segment is anticipated to have the highest CAGR throughout the projection period. Moreover, it is a method of diagnosis that aids in identifying alterations in the electrical activity of the brain. Therefore, it is promoting market expansion due to its quicker application process for detecting various brain challenges.
Region with largest share:
Due to the rising incidence of neurological illnesses, early acceptance of new technologies, and enhanced healthcare infrastructure in the US, North America currently holds a dominant position in the global market for brain mapping instruments. For instance, according to the Alzheimer's Association, in 2021, there were around 6.2 million Americans 65 and older who had Alzheimer's dementia, and that number is predicted to rise to 12.7 million by the year 2050. Moreover, the highly developed healthcare system and concentration on research and development provide a climate that is favorable to the adoption of cutting-edge technologies in the region. These elements are boosting the region's growth.
Region with highest CAGR:
Owing to growing health concerns and increased adoption of cutting-edge technologies, Asia-Pacific is anticipated to expand at a rapid pace over the course of the projected period. The NCBI reports that the rising prevalence of neurological illnesses in the area has led to an increase in neuroimaging investigations of brain structure and cognitive functioning. The treatment of individuals with brain illnesses has also adapted new methods, such as echo-planar imaging (EPI). The rapid MRI technique known as EPI can acquire MR images in a very short amount of time. As a result, the prevalence of brain illnesses and the adoption of cutting-edge technologies in the region have fueled market expansion.

Key players in the market
Some of the key players in Brain Mapping Instruments market include Advanced Brain Monitoring, Inc, Artinis Medical Systems, Canon Medical Systems Corp, General Electric Company, Gowerlabs Ltd, Koninklijke Philips N.V., Medtronic, Natus Medical Incorporated, Nihon Kohden Corporation, NIRx Medical Technologies, LLC, Siemens Healthcare Private Limited and Soterix Medical Inc.
Key Developments:
In September 2022, Scientists at the Allen Institute established the Brain Genome Project, a new global partnership to map approximately 200 billion cells in the human brain by type and function.
In March 2022, Kernel, a neurotechnology company, developed a wearable headset device, Kernel Flow, for brain measurement, which is based on time-domain functional near-infrared spectroscopy (TD-fNIRS). The device enables accurate, high-resolution measurement of the brain, and it functions by emitting picosecond pulses of light into tissue and measuring the arrival times of single photons.
Product Types Covered:
• Magnetic Resonance Imaging (MRI)
• Near-Infrared Spectroscopy (NIRS)
• Electroencephalography (EEG)
• Positron Emission Tomography (PET)
• Computed Tomography
• Other Product Types
End Users Covered:
• Ambulatory Centers
• Hospitals
• Other End Users
Regions Covered:
• North America
o US
o Canada
o Mexico
• Europe
o Germany
o UK
o Italy
o France
o Spain
o Rest of Europe
• Asia Pacific
o Japan
o China
o India
o Australia
o New Zealand
o South Korea
o Rest of Asia Pacific
• South America
o Argentina
o Brazil
o Chile
o Rest of South America
• Middle East & Africa
o Saudi Arabia
o UAE
o Qatar
o South Africa
o Rest of Middle East & Africa
What our report offers:
- Market share assessments for the regional and country-level segments
- Strategic recommendations for the new entrants
- Covers Market data for the years 2021, 2022, 2023, 2026, and 2030
- Market Trends (Drivers, Constraints, Opportunities, Threats, Challenges, Investment Opportunities, and recommendations)
- Strategic recommendations in key business segments based on the market estimations
- Competitive landscaping mapping the key common trends
- Company profiling with detailed strategies, financials, and recent developments
- Supply chain trends mapping the latest technological advancements
Free Customization Offerings:
All the customers of this report will be entitled to receive one of the following free customization options:
• Company Profiling
o Comprehensive profiling of additional market players (up to 3)
o SWOT Analysis of key players (up to 3)
• Regional Segmentation
o Market estimations, Forecasts and CAGR of any prominent country as per the client's interest (Note: Depends on feasibility check)
• Competitive Benchmarking
Benchmarking of key players based on product portfolio, geographical presence, and strategic alliances
Table of Contents
1 Executive Summary
2 Preface
2.1 Abstract
2.2 Stake Holders
2.3 Research Scope
2.4 Research Methodology
2.4.1 Data Mining
2.4.2 Data Analysis
2.4.3 Data Validation
2.4.4 Research Approach
2.5 Research Sources
2.5.1 Primary Research Sources
2.5.2 Secondary Research Sources
2.5.3 Assumptions
3 Market Trend Analysis
3.1 Introduction
3.2 Drivers
3.3 Restraints
3.4 Opportunities
3.5 Threats
3.6 Product Analysis
3.7 End User Analysis
3.8 Emerging Markets
3.9 Impact of Covid-19
4 Porters Five Force Analysis
4.1 Bargaining power of suppliers
4.2 Bargaining power of buyers
4.3 Threat of substitutes
4.4 Threat of new entrants
4.5 Competitive rivalry
5 Global Brain Mapping Instruments Market, By Product Type
5.1 Introduction
5.2 Magnetic Resonance Imaging (MRI)
5.3 Near-Infrared Spectroscopy (NIRS)
5.4 Electroencephalography (EEG)
5.5 Positron Emission Tomography (PET)
5.6 Computed Tomography
5.7 Other Product Types
6 Global Brain Mapping Instruments Market, By End User
6.1 Introduction
6.2 Ambulatory Centers
6.3 Hospitals
6.4 Other End Users
7 Global Brain Mapping Instruments Market, By Geography
7.1 Introduction
7.2 North America
7.2.1 US
7.2.2 Canada
7.2.3 Mexico
7.3 Europe
7.3.1 Germany
7.3.2 UK
7.3.3 Italy
7.3.4 France
7.3.5 Spain
7.3.6 Rest of Europe
7.4 Asia Pacific
7.4.1 Japan
7.4.2 China
7.4.3 India
7.4.4 Australia
7.4.5 New Zealand
7.4.6 South Korea
7.4.7 Rest of Asia Pacific
7.5 South America
7.5.1 Argentina
7.5.2 Brazil
7.5.3 Chile
7.5.4 Rest of South America
7.6 Middle East & Africa
7.6.1 Saudi Arabia
7.6.2 UAE
7.6.3 Qatar
7.6.4 South Africa
7.6.5 Rest of Middle East & Africa
8 Key Developments
8.1 Agreements, Partnerships, Collaborations and Joint Ventures
8.2 Acquisitions & Mergers
8.3 New Product Launch
8.4 Expansions
8.5 Other Key Strategies
9 Company Profiling
9.1 Advanced Brain Monitoring, Inc
9.2 Artinis Medical Systems
9.3 Canon Medical Systems Corp
9.4 General Electric Company
9.5 Gowerlabs Ltd
9.6 Koninklijke Philips N.V.
9.7 Medtronic
9.8 Natus Medical Incorporated
9.9 Nihon Kohden Corporation
9.10 NIRx Medical Technologies, LLC
9.11 Siemens Healthcare Private Limited
9.12 Soterix Medical Inc
List of Tables
1 Global Brain Mapping Instruments Market Outlook, By Region (2021-2030) ($MN)
2 Global Brain Mapping Instruments Market Outlook, By Product Type (2021-2030) ($MN)
3 Global Brain Mapping Instruments Market Outlook, By Magnetic Resonance Imaging (MRI) (2021-2030) ($MN)
4 Global Brain Mapping Instruments Market Outlook, By Near-Infrared Spectroscopy (NIRS) (2021-2030) ($MN)
5 Global Brain Mapping Instruments Market Outlook, By Electroencephalography (EEG) (2021-2030) ($MN)
6 Global Brain Mapping Instruments Market Outlook, By Positron Emission Tomography (PET) (2021-2030) ($MN)
7 Global Brain Mapping Instruments Market Outlook, By Computed Tomography (2021-2030) ($MN)
8 Global Brain Mapping Instruments Market Outlook, By Other Product Types (2021-2030) ($MN)
9 Global Brain Mapping Instruments Market Outlook, By End User (2021-2030) ($MN)
10 Global Brain Mapping Instruments Market Outlook, By Ambulatory Centers (2021-2030) ($MN)
11 Global Brain Mapping Instruments Market Outlook, By Hospitals (2021-2030) ($MN)
12 Global Brain Mapping Instruments Market Outlook, By Other End Users (2021-2030) ($MN)
13 North America Brain Mapping Instruments Market Outlook, By Country (2021-2030) ($MN)
14 North America Brain Mapping Instruments Market Outlook, By Product Type (2021-2030) ($MN)
15 North America Brain Mapping Instruments Market Outlook, By Magnetic Resonance Imaging (MRI) (2021-2030) ($MN)
16 North America Brain Mapping Instruments Market Outlook, By Near-Infrared Spectroscopy (NIRS) (2021-2030) ($MN)
17 North America Brain Mapping Instruments Market Outlook, By Electroencephalography (EEG) (2021-2030) ($MN)
18 North America Brain Mapping Instruments Market Outlook, By Positron Emission Tomography (PET) (2021-2030) ($MN)
19 North America Brain Mapping Instruments Market Outlook, By Computed Tomography (2021-2030) ($MN)
20 North America Brain Mapping Instruments Market Outlook, By Other Product Types (2021-2030) ($MN)
21 North America Brain Mapping Instruments Market Outlook, By End User (2021-2030) ($MN)
22 North America Brain Mapping Instruments Market Outlook, By Ambulatory Centers (2021-2030) ($MN)
23 North America Brain Mapping Instruments Market Outlook, By Hospitals (2021-2030) ($MN)
24 North America Brain Mapping Instruments Market Outlook, By Other End Users (2021-2030) ($MN)
25 Europe Brain Mapping Instruments Market Outlook, By Country (2021-2030) ($MN)
26 Europe Brain Mapping Instruments Market Outlook, By Product Type (2021-2030) ($MN)
27 Europe Brain Mapping Instruments Market Outlook, By Magnetic Resonance Imaging (MRI) (2021-2030) ($MN)
28 Europe Brain Mapping Instruments Market Outlook, By Near-Infrared Spectroscopy (NIRS) (2021-2030) ($MN)
29 Europe Brain Mapping Instruments Market Outlook, By Electroencephalography (EEG) (2021-2030) ($MN)
30 Europe Brain Mapping Instruments Market Outlook, By Positron Emission Tomography (PET) (2021-2030) ($MN)
31 Europe Brain Mapping Instruments Market Outlook, By Computed Tomography (2021-2030) ($MN)
32 Europe Brain Mapping Instruments Market Outlook, By Other Product Types (2021-2030) ($MN)
33 Europe Brain Mapping Instruments Market Outlook, By End User (2021-2030) ($MN)
34 Europe Brain Mapping Instruments Market Outlook, By Ambulatory Centers (2021-2030) ($MN)
35 Europe Brain Mapping Instruments Market Outlook, By Hospitals (2021-2030) ($MN)
36 Europe Brain Mapping Instruments Market Outlook, By Other End Users (2021-2030) ($MN)
37 Asia Pacific Brain Mapping Instruments Market Outlook, By Country (2021-2030) ($MN)
38 Asia Pacific Brain Mapping Instruments Market Outlook, By Product Type (2021-2030) ($MN)
39 Asia Pacific Brain Mapping Instruments Market Outlook, By Magnetic Resonance Imaging (MRI) (2021-2030) ($MN)
40 Asia Pacific Brain Mapping Instruments Market Outlook, By Near-Infrared Spectroscopy (NIRS) (2021-2030) ($MN)
41 Asia Pacific Brain Mapping Instruments Market Outlook, By Electroencephalography (EEG) (2021-2030) ($MN)
42 Asia Pacific Brain Mapping Instruments Market Outlook, By Positron Emission Tomography (PET) (2021-2030) ($MN)
43 Asia Pacific Brain Mapping Instruments Market Outlook, By Computed Tomography (2021-2030) ($MN)
44 Asia Pacific Brain Mapping Instruments Market Outlook, By Other Product Types (2021-2030) ($MN)
45 Asia Pacific Brain Mapping Instruments Market Outlook, By End User (2021-2030) ($MN)
46 Asia Pacific Brain Mapping Instruments Market Outlook, By Ambulatory Centers (2021-2030) ($MN)
47 Asia Pacific Brain Mapping Instruments Market Outlook, By Hospitals (2021-2030) ($MN)
48 Asia Pacific Brain Mapping Instruments Market Outlook, By Other End Users (2021-2030) ($MN)
49 South America Brain Mapping Instruments Market Outlook, By Country (2021-2030) ($MN)
50 South America Brain Mapping Instruments Market Outlook, By Product Type (2021-2030) ($MN)
51 South America Brain Mapping Instruments Market Outlook, By Magnetic Resonance Imaging (MRI) (2021-2030) ($MN)
52 South America Brain Mapping Instruments Market Outlook, By Near-Infrared Spectroscopy (NIRS) (2021-2030) ($MN)
53 South America Brain Mapping Instruments Market Outlook, By Electroencephalography (EEG) (2021-2030) ($MN)
54 South America Brain Mapping Instruments Market Outlook, By Positron Emission Tomography (PET) (2021-2030) ($MN)
55 South America Brain Mapping Instruments Market Outlook, By Computed Tomography (2021-2030) ($MN)
56 South America Brain Mapping Instruments Market Outlook, By Other Product Types (2021-2030) ($MN)
57 South America Brain Mapping Instruments Market Outlook, By End User (2021-2030) ($MN)
58 South America Brain Mapping Instruments Market Outlook, By Ambulatory Centers (2021-2030) ($MN)
59 South America Brain Mapping Instruments Market Outlook, By Hospitals (2021-2030) ($MN)
60 South America Brain Mapping Instruments Market Outlook, By Other End Users (2021-2030) ($MN)
61 Middle East & Africa Brain Mapping Instruments Market Outlook, By Country (2021-2030) ($MN)
62 Middle East & Africa Brain Mapping Instruments Market Outlook, By Product Type (2021-2030) ($MN)
63 Middle East & Africa Brain Mapping Instruments Market Outlook, By Magnetic Resonance Imaging (MRI) (2021-2030) ($MN)
64 Middle East & Africa Brain Mapping Instruments Market Outlook, By Near-Infrared Spectroscopy (NIRS) (2021-2030) ($MN)
65 Middle East & Africa Brain Mapping Instruments Market Outlook, By Electroencephalography (EEG) (2021-2030) ($MN)
66 Middle East & Africa Brain Mapping Instruments Market Outlook, By Positron Emission Tomography (PET) (2021-2030) ($MN)
67 Middle East & Africa Brain Mapping Instruments Market Outlook, By Computed Tomography (2021-2030) ($MN)
68 Middle East & Africa Brain Mapping Instruments Market Outlook, By Other Product Types (2021-2030) ($MN)
69 Middle East & Africa Brain Mapping Instruments Market Outlook, By End User (2021-2030) ($MN)
70 Middle East & Africa Brain Mapping Instruments Market Outlook, By Ambulatory Centers (2021-2030) ($MN)
71 Middle East & Africa Brain Mapping Instruments Market Outlook, By Hospitals (2021-2030) ($MN)
72 Middle East & Africa Brain Mapping Instruments Market Outlook, By Other End Users (2021-2030) ($MN)
List of Figures
List of Figures
Figure 1 Global Brain Mapping Instruments Market Outlook (2021-2030) ($MN)
Figure 2 North America Brain Mapping Instruments Market Outlook (2021-2030) ($MN)
Figure 3 US Brain Mapping Instruments Market Outlook (2021-2030) ($MN)
Figure 4 Canada Brain Mapping Instruments Market Outlook (2021-2030) ($MN)
Figure 5 Mexico Brain Mapping Instruments Market Outlook (2021-2030) ($MN)
Figure 6 Europe Brain Mapping Instruments Market Outlook (2021-2030) ($MN)
Figure 7 Germany Brain Mapping Instruments Market Outlook (2021-2030) ($MN)
Figure 8 UK Brain Mapping Instruments Market Outlook (2021-2030) ($MN)
Figure 9 Italy Brain Mapping Instruments Market Outlook (2021-2030) ($MN)
Figure 10 France Brain Mapping Instruments Market Outlook (2021-2030) ($MN)
Figure 11 Spain Brain Mapping Instruments Market Outlook (2021-2030) ($MN)
Figure 12 Rest of Europe Brain Mapping Instruments Market Outlook (2021-2030) ($MN)
Figure 13 Asia Pacific Brain Mapping Instruments Market Outlook (2021-2030) ($MN)
Figure 14 Japan Brain Mapping Instruments Market Outlook (2021-2030) ($MN)
Figure 15 China Brain Mapping Instruments Market Outlook (2021-2030) ($MN)
Figure 16 India Brain Mapping Instruments Market Outlook (2021-2030) ($MN)
Figure 17 Australia Brain Mapping Instruments Market Outlook (2021-2030) ($MN)
Figure 18 New Zealand Brain Mapping Instruments Market Outlook (2021-2030) ($MN)
Figure 19 South Korea Brain Mapping Instruments Market Outlook (2021-2030) ($MN)
Figure 20 Rest of Asia Pacific Brain Mapping Instruments Market Outlook (2021-2030) ($MN)
Figure 21 South America Brain Mapping Instruments Market Outlook (2021-2030) ($MN)
Figure 22 Argentina Brain Mapping Instruments Market Outlook (2021-2030) ($MN)
Figure 23 Brazil Brain Mapping Instruments Market Outlook (2021-2030) ($MN)
Figure 24 Chile Brain Mapping Instruments Market Outlook (2021-2030) ($MN)
Figure 25 Rest of South America Brain Mapping Instruments Market Outlook (2021-2030) ($MN)
Figure 26 Middle East & Africa Brain Mapping Instruments Market Outlook (2021-2030) ($MN)
Figure 27 Saudi Arabia Brain Mapping Instruments Market Outlook (2021-2030) ($MN)
Figure 28 UAE Brain Mapping Instruments Market Outlook (2021-2030) ($MN)
Figure 29 Qatar Brain Mapping Instruments Market Outlook (2021-2030) ($MN)
Figure 30 South Africa Brain Mapping Instruments Market Outlook (2021-2030) ($MN)
Figure 31 Rest of Middle East & Africa Brain Mapping Instruments Market Outlook (2021-2030) ($MN)
RESEARCH METHODOLOGY

We at ‘Stratistics’ opt for an extensive research approach which involves data mining, data validation, and data analysis. The various research sources include in-house repository, secondary research, competitor’s sources, social media research, client internal data, and primary research.
Our team of analysts prefers the most reliable and authenticated data sources in order to perform the comprehensive literature search. With access to most of the authenticated data bases our team highly considers the best mix of information through various sources to obtain extensive and accurate analysis.
Each report takes an average time of a month and a team of 4 industry analysts. The time may vary depending on the scope and data availability of the desired market report. The various parameters used in the market assessment are standardized in order to enhance the data accuracy.
Data Mining
The data is collected from several authenticated, reliable, paid and unpaid sources and is filtered depending on the scope & objective of the research. Our reports repository acts as an added advantage in this procedure. Data gathering from the raw material suppliers, distributors and the manufacturers is performed on a regular basis, this helps in the comprehensive understanding of the products value chain. Apart from the above mentioned sources the data is also collected from the industry consultants to ensure the objective of the study is in the right direction.
Market trends such as technological advancements, regulatory affairs, market dynamics (Drivers, Restraints, Opportunities and Challenges) are obtained from scientific journals, market related national & international associations and organizations.
Data Analysis
From the data that is collected depending on the scope & objective of the research the data is subjected for the analysis. The critical steps that we follow for the data analysis include:
- Product Lifecycle Analysis
- Competitor analysis
- Risk analysis
- Porters Analysis
- PESTEL Analysis
- SWOT Analysis
The data engineering is performed by the core industry experts considering both the Marketing Mix Modeling and the Demand Forecasting. The marketing mix modeling makes use of multiple-regression techniques to predict the optimal mix of marketing variables. Regression factor is based on a number of variables and how they relate to an outcome such as sales or profits.
Data Validation
The data validation is performed by the exhaustive primary research from the expert interviews. This includes telephonic interviews, focus groups, face to face interviews, and questionnaires to validate our research from all aspects. The industry experts we approach come from the leading firms, involved in the supply chain ranging from the suppliers, distributors to the manufacturers and consumers so as to ensure an unbiased analysis.
We are in touch with more than 15,000 industry experts with the right mix of consultants, CEO's, presidents, vice presidents, managers, experts from both supply side and demand side, executives and so on.
The data validation involves the primary research from the industry experts belonging to:
- Leading Companies
- Suppliers & Distributors
- Manufacturers
- Consumers
- Industry/Strategic Consultants
Apart from the data validation the primary research also helps in performing the fill gap research, i.e. providing solutions for the unmet needs of the research which helps in enhancing the reports quality.
For more details about research methodology, kindly write to us at info@strategymrc.com
Frequently Asked Questions
In case of any queries regarding this report, you can contact the customer service by filing the “Inquiry Before Buy” form available on the right hand side. You may also contact us through email: info@strategymrc.com or phone: +1-301-202-5929
Yes, the samples are available for all the published reports. You can request them by filling the “Request Sample” option available in this page.
Yes, you can request a sample with your specific requirements. All the customized samples will be provided as per the requirement with the real data masked.
All our reports are available in Digital PDF format. In case if you require them in any other formats, such as PPT, Excel etc you can submit a request through “Inquiry Before Buy” form available on the right hand side. You may also contact us through email: info@strategymrc.com or phone: +1-301-202-5929
We offer a free 15% customization with every purchase. This requirement can be fulfilled for both pre and post sale. You may send your customization requirements through email at info@strategymrc.com or call us on +1-301-202-5929.
We have 3 different licensing options available in electronic format.
- Single User Licence: Allows one person, typically the buyer, to have access to the ordered product. The ordered product cannot be distributed to anyone else.
- 2-5 User Licence: Allows the ordered product to be shared among a maximum of 5 people within your organisation.
- Corporate License: Allows the product to be shared among all employees of your organisation regardless of their geographical location.
All our reports are typically be emailed to you as an attachment.
To order any available report you need to register on our website. The payment can be made either through CCAvenue or PayPal payments gateways which accept all international cards.
We extend our support to 6 months post sale. A post sale customization is also provided to cover your unmet needs in the report.
Request Customization
We offer complimentary customization of up to 15% with every purchase. To share your customization requirements, feel free to email us at info@strategymrc.com or call us on +1-301-202-5929. .
Please Note: Customization within the 15% threshold is entirely free of charge. If your request exceeds this limit, we will conduct a feasibility assessment. Following that, a detailed quote and timeline will be provided.
WHY CHOOSE US ?

Assured Quality
Best in class reports with high standard of research integrity

24X7 Research Support
Continuous support to ensure the best customer experience.

Free Customization
Adding more values to your product of interest.

Safe & Secure Access
Providing a secured environment for all online transactions.

Trusted by 600+ Brands
Serving the most reputed brands across the world.