
Catalyst Fertilizers Market
Catalyst Fertilizers Market Forecasts to 2028 - Global Analysis By Production Process (Contact Process, Nitric Acid Production, Potassium Fertilizer Production, Urea Production and Haber-Bosch Process), Application (Phosphatic Fertilizers and Nitrogenous Fertilizers)and By Geography

|
Years Covered |
2020-2028 |
|
Estimated Year Value (2022) |
US $2.5 BN |
|
Projected Year Value (2028) |
US $3.4 BN |
|
CAGR (2022 - 2028) |
5.2% |
|
Regions Covered |
North America, Europe, Asia Pacific, South America, and Middle East & Africa |
|
Countries Covered |
US, Canada, Mexico, Germany, UK, Italy, France, Spain, Japan, China, India, Australia, New Zealand, South Korea, Rest of Asia Pacific, South America, Argentina, Brazil, Chile, Middle East & Africa, Saudi Arabia, UAE, Qatar, and South Africa |
|
Largest Market |
Asia Pacific |
|
Highest Growing Market |
Europe |
According to Stratistics MRC, the Global Catalyst Fertilizers Market is accounted for $2.5 billion in 2022 and is expected to reach $3.4 billion by 2028 growing at a CAGR of 5.2% during the forecast period. Catalyst fertilizers are used in the reforming process to enhance the yield of the plants. The major function of catalyst is to increase reaction rate and reduce the emission from production process. Catalysts are used to enhance efficiency of fertilizers and improve the overall growth and performance of crops, vegetables, and plants. Technological advancements in the catalyst industry have helped in decreasing emission of greenhouse gases, which is expected to boost revenue growth of the catalyst fertilizers market.
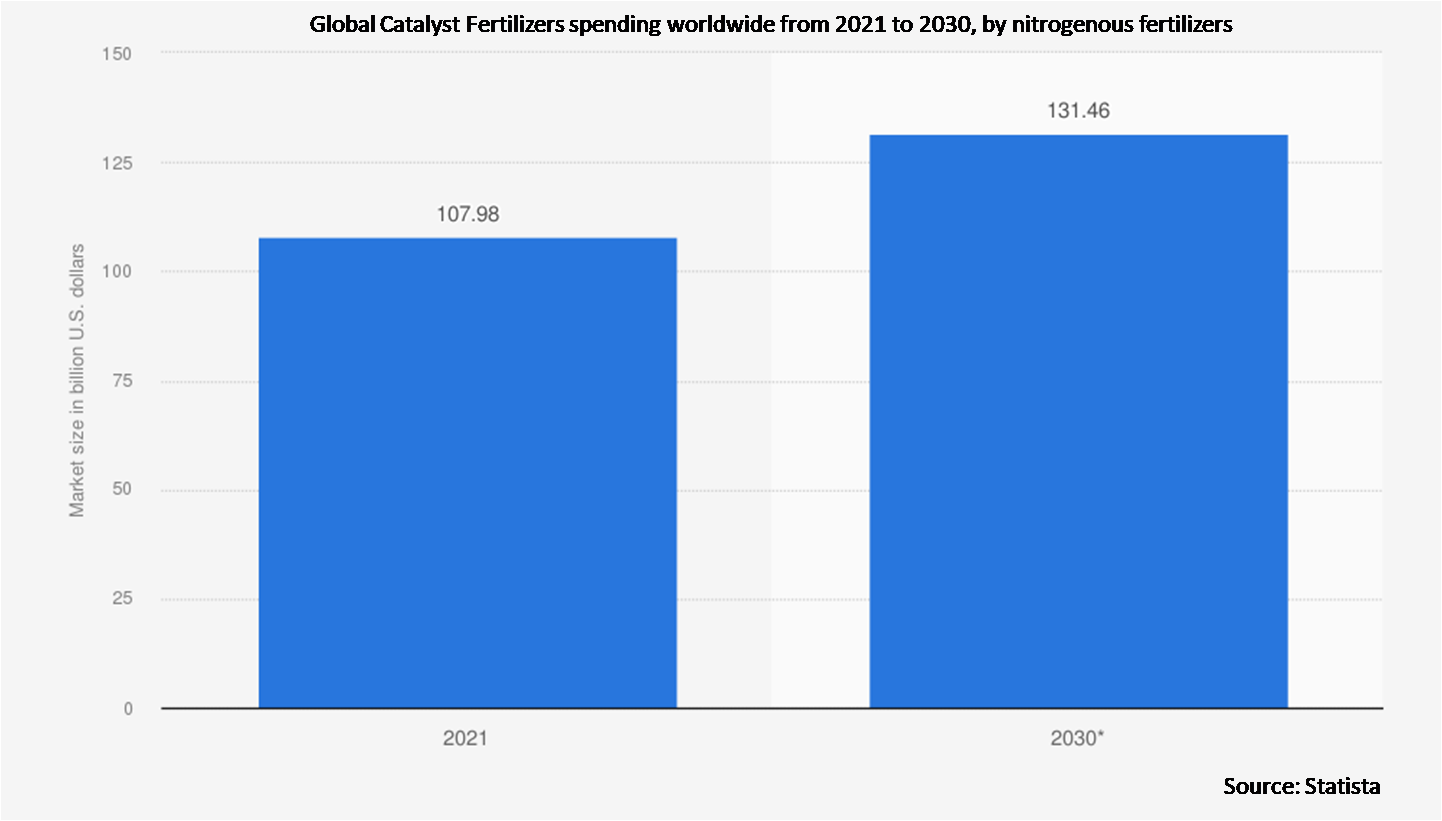
According to FAOSTAT, nitrogenous fertilizer is essential nutrient that is consumed around 70.7% across the globe. Around 80% of commercially produced ammonia is processed for nitrogenous fertilizer. According to International Fertilizers Association, Nitrogen is by far the largest nutrient, accounting for almost 60% of total consumption.
Market Dynamics:
Driver:
Environmental Concerns
Rising environmental concerns regarding pollution and changing of weather due to use of certain fertilizers would propel adoption of catalyst fertilizers. In addition, government initiatives and regulations to control pollution have led to an escalating demand for catalyst fertilizers and efforts to reduce environmental concerns by developing low-emission fertilizers are fueling growth of the market. Additionally, increasing adoption of these fertilizers by farmers in several countries, owing to capability of the product to improve crop quality and yield is expected to boost revenue growth of the market.
Restraint:
Lack of Affordability
Growth of the market is expected to be negatively impacted due to some unfavourable factors like lack of awareness regarding the functioning of catalyst fertilizers among farmers in underdeveloped economies and high costs of certain fertilizers. Additionally, increasing preference for organic fertilizers and uncertain replacement time of catalyst membranes can limit growth of the market.
Opportunity:
Technological advancements
Technological advancement in agricultural sector has led to higher productivity of crops, limited use of water and fertilizers which in turn have minimized crop prices, lower release of chemicals and pesticides into water bodies, and safer conditions of growing and high quality crops. Recent technological advancement coupled with new product launches is adding fuel to the market. Additionally, growing demand and increasing consumption of food globally due to rapidly growing population is a key factor contributing to the growth of the market.
Threat:
Fluctuations in raw material costs
Huge fluctuations in raw material costs triggered by prevailing geo-political tensions, and expected economic turbulences. The prices of most base metals have fallen, but the drop in prices is substantially lower than that of oil prices. Additionally, stringent environmental regulations, long replacement period for catalyst membranes, increasing demand for the organic fertilizer are the factors hampering the growth of the catalyst fertilizers market.
Covid-19 Impact
Robust changes brought in by the pandemic in the catalyst fertilizers supply chain and the burgeoning drive for a cleaner and sustainable environment is necessitating companies to alter their strategies. Production disruptions resulting from shutdowns of mines and refineries due to the outbreak of COVID-19 are also impacting supply. Pandemic has led to economic sanctions on multiple countries, a surge in commodity prices, and supply chain disruptions, causing inflation across goods and services, and affecting many markets globally.
The urea production segment is expected to be the largest during the forecast period
The urea production segment is anticipated to witness the fastest CAGR growth during the forecast period, due to its benefits. Urea is one of the essential components used in nitrogen fertilizers for acidifying soils at lowest costs. The presence of carbon monoxide causes catalyst poisoning, which can reduce urea output. The technique heavily relies on iron-chromium complexes. Thus, these aspects are fueling the market growth.
The nitrogenous fertilizers segment is expected to have the highest CAGR during the forecast period
The nitrogenous fertilizers segment is estimated to have a lucrative growth, due to it is essential in the formation of protein, and protein makes up much of the tissues of most living things. Nitrogen is considered to be the most important nutrient, and plants absorb more nitrogen than any other element. Nitrogen is essential for plants healthy as they develop and nutritious to eat after they are harvested. Hence, these are the factors influencing the growth of the market.
Region with largest share:
Asia Pacific is projected to hold the largest market share during the forecast period owing to the major economies, the large population and changing lifestyles. The presence of large-scale urea and ammonia manufacturing facilities, along with significant capital investments in countries is anticipated to drive the demand for fertilizer catalysts. The implementation of stringent regulations on the fertilizer sector owing to pollution concerns is a major market trend.
Region with highest CAGR:
Europe is projected to have the highest CAGR over the forecast period, owing to increasing government support for encouraging farmers to practice sustainable farming and high demand for quality crops and food products, supportive government policies for sustainable practices along with ongoing development activities for efficient production process. Factors such as growing ammonia production and rapid expansion of ammonia-based fertilizer manufacturing companies are expected to augment demand for market in this region.

Key players in the market
Some of the key players profiled in the Catalyst Fertilizers Market include Johnson Matthey, Clariant International, Unicat Catalyst Technologies, Quality Magnetite, Dowdupont, Honeywell International Inc, Albemarle Corporation, Oham Industries, Direct Commodities Pty Ltd, Projects & Development India Limited (PDIL), Casale SA, LKAB Minerals AB, China Petroleum and Chemical Corporation, TANAKA HOLDINGS Co., Ltd, Chempack, Thyssenkrupp AG, Quantumsphere Inc., WEICKMANN & WEICKMANN, N.E.Chemcat and Axens.
Key Developments:
In March 2022, Casale SA, a Switzerland-based chemicals company, partnered with Ferkensco Management Limited and Enter Engineering Pte Ltd. The agreement represents the foundation for future cooperation between the three companies to support the construction of an ammonia-based fertilizer plant in Uzbekistan.
In December 2020, Johnson Matthey, a UK-based chemicals company, partnered with ThyssenKrupp AG, a Germany-based technology provider for world-scale ammonia plants. Through this partnership, both companies signed an agreement to renew their collaboration around the ammonia production process and catalyst supply.
Products Covered:
• Precious Metals
• Base Metals
Production Processes Covered:
• Contact Process
• Nitric Acid Production
• Potassium Fertilizer Production
• Urea Production
• Haber-Bosch Process
Applications Covered:
• Phosphatic Fertilizers
• Nitrogenous Fertilizers
Regions Covered:
• North America
o US
o Canada
o Mexico
• Europe
o Germany
o UK
o Italy
o France
o Spain
o Rest of Europe
• Asia Pacific
o Japan
o China
o India
o Australia
o New Zealand
o South Korea
o Rest of Asia Pacific
• South America
o Argentina
o Brazil
o Chile
o Rest of South America
• Middle East & Africa
o Saudi Arabia
o UAE
o Qatar
o South Africa
o Rest of Middle East & Africa
What our report offers:
- Market share assessments for the regional and country-level segments
- Strategic recommendations for the new entrants
- Covers Market data for the years 2020, 2021, 2022, 2025, and 2028
- Market Trends (Drivers, Constraints, Opportunities, Threats, Challenges, Investment Opportunities, and recommendations)
- Strategic recommendations in key business segments based on the market estimations
- Competitive landscaping mapping the key common trends
- Company profiling with detailed strategies, financials, and recent developments
- Supply chain trends mapping the latest technological advancements
Free Customization Offerings:
All the customers of this report will be entitled to receive one of the following free customization options:
• Company Profiling
o Comprehensive profiling of additional market players (up to 3)
o SWOT Analysis of key players (up to 3)
• Regional Segmentation
o Market estimations, Forecasts and CAGR of any prominent country as per the client's interest (Note: Depends on feasibility check)
• Competitive Benchmarking
o Benchmarking of key players based on product portfolio, geographical presence, and strategic alliances
Table of Contents
1 Executive Summary
2 Preface
2.1 Abstract
2.2 Stake Holders
2.3 Research Scope
2.4 Research Methodology
2.4.1 Data Mining
2.4.2 Data Analysis
2.4.3 Data Validation
2.4.4 Research Approach
2.5 Research Sources
2.5.1 Primary Research Sources
2.5.2 Secondary Research Sources
2.5.3 Assumptions
3 Market Trend Analysis
3.1 Introduction
3.2 Drivers
3.3 Restraints
3.4 Opportunities
3.5 Threats
3.6 Product Analysis
3.7 Application Analysis
3.8 Emerging Markets
3.9 Impact of Covid-19
4 Porters Five Force Analysis
4.1 Bargaining power of suppliers
4.2 Bargaining power of buyers
4.3 Threat of substitutes
4.4 Threat of new entrants
4.5 Competitive rivalry
5 Global Catalyst Fertilizers Market, By Product
5.1 Introduction
5.2 Precious Metals
5.2.1 Palladium Based
5.2.2 Ruthenium Based
5.2.3 Platinum Based
5.2.4 Rhodium Based
5.3 Base Metals
5.3.1 Zinc Based
5.3.2 Iron-Based
5.3.3 Cobalt Based
5.3.4 Vanadium Based
5.3.5 Molybdenum Based
5.3.6 Nickel Based
5.3.7 Chromium Based
6 Global Catalyst Fertilizers Market, By Production Process
6.1 Introduction
6.2 Contact Process
6.3 Nitric Acid Production
6.4 Potassium Fertilizer Production
6.5 Urea Production
6.6 Haber-Bosch Process
7 Global Catalyst Fertilizers Market, By Application
7.1 Introduction
7.2 Phosphatic Fertilizers
7.3 Nitrogenous Fertilizers
8 Global Catalyst Fertilizers Market, By Geography
8.1 Introduction
8.2 North America
8.2.1 US
8.2.2 Canada
8.2.3 Mexico
8.3 Europe
8.3.1 Germany
8.3.2 UK
8.3.3 Italy
8.3.4 France
8.3.5 Spain
8.3.6 Rest of Europe
8.4 Asia Pacific
8.4.1 Japan
8.4.2 China
8.4.3 India
8.4.4 Australia
8.4.5 New Zealand
8.4.6 South Korea
8.4.7 Rest of Asia Pacific
8.5 South America
8.5.1 Argentina
8.5.2 Brazil
8.5.3 Chile
8.5.4 Rest of South America
8.6 Middle East & Africa
8.6.1 Saudi Arabia
8.6.2 UAE
8.6.3 Qatar
8.6.4 South Africa
8.6.5 Rest of Middle East & Africa
9 Key Developments
9.1 Agreements, Partnerships, Collaborations and Joint Ventures
9.2 Acquisitions & Mergers
9.3 New Product Launch
9.4 Expansions
9.5 Other Key Strategies
10 Company Profiling
10.1 Johnson Matthey
10.2 Clariant International
10.3 Unicat Catalyst Technologies
10.4 Quality Magnetite
10.5 Dowdupont
10.6 Honeywell International Inc
10.7 Albemarle Corporation
10.8 Oham Industries
10.9 Direct Commodities Pty Ltd
10.10 Projects & Development India Limited (PDIL)
10.11 Casale SA
10.12 LKAB Minerals AB
10.13 China Petroleum and Chemical Corporation
10.14 TANAKA HOLDINGS Co., Ltd
10.15 Chempack
10.16 Thyssenkrupp AG
10.17 Quantumsphere Inc.
10.18 WEICKMANN & WEICKMANN
10.19 N.E.Chemcat
10.20 Axens
List of Tables
1 Global Catalyst Fertilizers Market Outlook, By Region (2020-2028) ($MN)
2 Global Catalyst Fertilizers Market Outlook, By Product (2020-2028) ($MN)
3 Global Catalyst Fertilizers Market Outlook, By Precious Metals (2020-2028) ($MN)
4 Global Catalyst Fertilizers Market Outlook, By Base Metals (2020-2028) ($MN)
5 Global Catalyst Fertilizers Market Outlook, By Production Process (2020-2028) ($MN)
6 Global Catalyst Fertilizers Market Outlook, By Contact Process (2020-2028) ($MN)
7 Global Catalyst Fertilizers Market Outlook, By Nitric Acid Production (2020-2028) ($MN)
8 Global Catalyst Fertilizers Market Outlook, By Potassium Fertilizer Production (2020-2028) ($MN)
9 Global Catalyst Fertilizers Market Outlook, By Urea Production (2020-2028) ($MN)
10 Global Catalyst Fertilizers Market Outlook, By Haber-Bosch Process (2020-2028) ($MN)
11 Global Catalyst Fertilizers Market Outlook, By Application (2020-2028) ($MN)
12 Global Catalyst Fertilizers Market Outlook, By Phosphatic Fertilizers (2020-2028) ($MN)
13 Global Catalyst Fertilizers Market Outlook, By Nitrogenous Fertilizers (2020-2028) ($MN)
14 North America Catalyst Fertilizers Market Outlook, By Country (2020-2028) ($MN)
15 North America Catalyst Fertilizers Market Outlook, By Product (2020-2028) ($MN)
16 North America Catalyst Fertilizers Market Outlook, By Precious Metals (2020-2028) ($MN)
17 North America Catalyst Fertilizers Market Outlook, By Base Metals (2020-2028) ($MN)
18 North America Catalyst Fertilizers Market Outlook, By Production Process (2020-2028) ($MN)
19 North America Catalyst Fertilizers Market Outlook, By Contact Process (2020-2028) ($MN)
20 North America Catalyst Fertilizers Market Outlook, By Nitric Acid Production (2020-2028) ($MN)
21 North America Catalyst Fertilizers Market Outlook, By Potassium Fertilizer Production (2020-2028) ($MN)
22 North America Catalyst Fertilizers Market Outlook, By Urea Production (2020-2028) ($MN)
23 North America Catalyst Fertilizers Market Outlook, By Haber-Bosch Process (2020-2028) ($MN)
24 North America Catalyst Fertilizers Market Outlook, By Application (2020-2028) ($MN)
25 North America Catalyst Fertilizers Market Outlook, By Phosphatic Fertilizers (2020-2028) ($MN)
26 North America Catalyst Fertilizers Market Outlook, By Nitrogenous Fertilizers (2020-2028) ($MN)
27 Europe Catalyst Fertilizers Market Outlook, By Country (2020-2028) ($MN)
28 Europe Catalyst Fertilizers Market Outlook, By Product (2020-2028) ($MN)
29 Europe Catalyst Fertilizers Market Outlook, By Precious Metals (2020-2028) ($MN)
30 Europe Catalyst Fertilizers Market Outlook, By Base Metals (2020-2028) ($MN)
31 Europe Catalyst Fertilizers Market Outlook, By Production Process (2020-2028) ($MN)
32 Europe Catalyst Fertilizers Market Outlook, By Contact Process (2020-2028) ($MN)
33 Europe Catalyst Fertilizers Market Outlook, By Nitric Acid Production (2020-2028) ($MN)
34 Europe Catalyst Fertilizers Market Outlook, By Potassium Fertilizer Production (2020-2028) ($MN)
35 Europe Catalyst Fertilizers Market Outlook, By Urea Production (2020-2028) ($MN)
36 Europe Catalyst Fertilizers Market Outlook, By Haber-Bosch Process (2020-2028) ($MN)
37 Europe Catalyst Fertilizers Market Outlook, By Application (2020-2028) ($MN)
38 Europe Catalyst Fertilizers Market Outlook, By Phosphatic Fertilizers (2020-2028) ($MN)
39 Europe Catalyst Fertilizers Market Outlook, By Nitrogenous Fertilizers (2020-2028) ($MN)
40 Asia Pacific Catalyst Fertilizers Market Outlook, By Country (2020-2028) ($MN)
41 Asia Pacific Catalyst Fertilizers Market Outlook, By Product (2020-2028) ($MN)
42 Asia Pacific Catalyst Fertilizers Market Outlook, By Precious Metals (2020-2028) ($MN)
43 Asia Pacific Catalyst Fertilizers Market Outlook, By Base Metals (2020-2028) ($MN)
44 Asia Pacific Catalyst Fertilizers Market Outlook, By Production Process (2020-2028) ($MN)
45 Asia Pacific Catalyst Fertilizers Market Outlook, By Contact Process (2020-2028) ($MN)
46 Asia Pacific Catalyst Fertilizers Market Outlook, By Nitric Acid Production (2020-2028) ($MN)
47 Asia Pacific Catalyst Fertilizers Market Outlook, By Potassium Fertilizer Production (2020-2028) ($MN)
48 Asia Pacific Catalyst Fertilizers Market Outlook, By Urea Production (2020-2028) ($MN)
49 Asia Pacific Catalyst Fertilizers Market Outlook, By Haber-Bosch Process (2020-2028) ($MN)
50 Asia Pacific Catalyst Fertilizers Market Outlook, By Application (2020-2028) ($MN)
51 Asia Pacific Catalyst Fertilizers Market Outlook, By Phosphatic Fertilizers (2020-2028) ($MN)
52 Asia Pacific Catalyst Fertilizers Market Outlook, By Nitrogenous Fertilizers (2020-2028) ($MN)
53 South America Catalyst Fertilizers Market Outlook, By Country (2020-2028) ($MN)
54 South America Catalyst Fertilizers Market Outlook, By Product (2020-2028) ($MN)
55 South America Catalyst Fertilizers Market Outlook, By Precious Metals (2020-2028) ($MN)
56 South America Catalyst Fertilizers Market Outlook, By Base Metals (2020-2028) ($MN)
57 South America Catalyst Fertilizers Market Outlook, By Production Process (2020-2028) ($MN)
58 South America Catalyst Fertilizers Market Outlook, By Contact Process (2020-2028) ($MN)
59 South America Catalyst Fertilizers Market Outlook, By Nitric Acid Production (2020-2028) ($MN)
60 South America Catalyst Fertilizers Market Outlook, By Potassium Fertilizer Production (2020-2028) ($MN)
61 South America Catalyst Fertilizers Market Outlook, By Urea Production (2020-2028) ($MN)
62 South America Catalyst Fertilizers Market Outlook, By Haber-Bosch Process (2020-2028) ($MN)
63 South America Catalyst Fertilizers Market Outlook, By Application (2020-2028) ($MN)
64 South America Catalyst Fertilizers Market Outlook, By Phosphatic Fertilizers (2020-2028) ($MN)
65 South America Catalyst Fertilizers Market Outlook, By Nitrogenous Fertilizers (2020-2028) ($MN)
66 Middle East & Africa Catalyst Fertilizers Market Outlook, By Country (2020-2028) ($MN)
67 Middle East & Africa Catalyst Fertilizers Market Outlook, By Product (2020-2028) ($MN)
68 Middle East & Africa Catalyst Fertilizers Market Outlook, By Precious Metals (2020-2028) ($MN)
69 Middle East & Africa Catalyst Fertilizers Market Outlook, By Base Metals (2020-2028) ($MN)
70 Middle East & Africa Catalyst Fertilizers Market Outlook, By Production Process (2020-2028) ($MN)
71 Middle East & Africa Catalyst Fertilizers Market Outlook, By Contact Process (2020-2028) ($MN)
72 Middle East & Africa Catalyst Fertilizers Market Outlook, By Nitric Acid Production (2020-2028) ($MN)
73 Middle East & Africa Catalyst Fertilizers Market Outlook, By Potassium Fertilizer Production (2020-2028) ($MN)
74 Middle East & Africa Catalyst Fertilizers Market Outlook, By Urea Production (2020-2028) ($MN)
75 Middle East & Africa Catalyst Fertilizers Market Outlook, By Haber-Bosch Process (2020-2028) ($MN)
76 Middle East & Africa Catalyst Fertilizers Market Outlook, By Application (2020-2028) ($MN)
77 Middle East & Africa Catalyst Fertilizers Market Outlook, By Phosphatic Fertilizers (2020-2028) ($MN)
78 Middle East & Africa Catalyst Fertilizers Market Outlook, By Nitrogenous Fertilizers (2020-2028) ($MN)
List of Figures
RESEARCH METHODOLOGY

We at ‘Stratistics’ opt for an extensive research approach which involves data mining, data validation, and data analysis. The various research sources include in-house repository, secondary research, competitor’s sources, social media research, client internal data, and primary research.
Our team of analysts prefers the most reliable and authenticated data sources in order to perform the comprehensive literature search. With access to most of the authenticated data bases our team highly considers the best mix of information through various sources to obtain extensive and accurate analysis.
Each report takes an average time of a month and a team of 4 industry analysts. The time may vary depending on the scope and data availability of the desired market report. The various parameters used in the market assessment are standardized in order to enhance the data accuracy.
Data Mining
The data is collected from several authenticated, reliable, paid and unpaid sources and is filtered depending on the scope & objective of the research. Our reports repository acts as an added advantage in this procedure. Data gathering from the raw material suppliers, distributors and the manufacturers is performed on a regular basis, this helps in the comprehensive understanding of the products value chain. Apart from the above mentioned sources the data is also collected from the industry consultants to ensure the objective of the study is in the right direction.
Market trends such as technological advancements, regulatory affairs, market dynamics (Drivers, Restraints, Opportunities and Challenges) are obtained from scientific journals, market related national & international associations and organizations.
Data Analysis
From the data that is collected depending on the scope & objective of the research the data is subjected for the analysis. The critical steps that we follow for the data analysis include:
- Product Lifecycle Analysis
- Competitor analysis
- Risk analysis
- Porters Analysis
- PESTEL Analysis
- SWOT Analysis
The data engineering is performed by the core industry experts considering both the Marketing Mix Modeling and the Demand Forecasting. The marketing mix modeling makes use of multiple-regression techniques to predict the optimal mix of marketing variables. Regression factor is based on a number of variables and how they relate to an outcome such as sales or profits.
Data Validation
The data validation is performed by the exhaustive primary research from the expert interviews. This includes telephonic interviews, focus groups, face to face interviews, and questionnaires to validate our research from all aspects. The industry experts we approach come from the leading firms, involved in the supply chain ranging from the suppliers, distributors to the manufacturers and consumers so as to ensure an unbiased analysis.
We are in touch with more than 15,000 industry experts with the right mix of consultants, CEO's, presidents, vice presidents, managers, experts from both supply side and demand side, executives and so on.
The data validation involves the primary research from the industry experts belonging to:
- Leading Companies
- Suppliers & Distributors
- Manufacturers
- Consumers
- Industry/Strategic Consultants
Apart from the data validation the primary research also helps in performing the fill gap research, i.e. providing solutions for the unmet needs of the research which helps in enhancing the reports quality.
For more details about research methodology, kindly write to us at info@strategymrc.com
Frequently Asked Questions
In case of any queries regarding this report, you can contact the customer service by filing the “Inquiry Before Buy” form available on the right hand side. You may also contact us through email: info@strategymrc.com or phone: +1-301-202-5929
Yes, the samples are available for all the published reports. You can request them by filling the “Request Sample” option available in this page.
Yes, you can request a sample with your specific requirements. All the customized samples will be provided as per the requirement with the real data masked.
All our reports are available in Digital PDF format. In case if you require them in any other formats, such as PPT, Excel etc you can submit a request through “Inquiry Before Buy” form available on the right hand side. You may also contact us through email: info@strategymrc.com or phone: +1-301-202-5929
We offer a free 15% customization with every purchase. This requirement can be fulfilled for both pre and post sale. You may send your customization requirements through email at info@strategymrc.com or call us on +1-301-202-5929.
We have 3 different licensing options available in electronic format.
- Single User Licence: Allows one person, typically the buyer, to have access to the ordered product. The ordered product cannot be distributed to anyone else.
- 2-5 User Licence: Allows the ordered product to be shared among a maximum of 5 people within your organisation.
- Corporate License: Allows the product to be shared among all employees of your organisation regardless of their geographical location.
All our reports are typically be emailed to you as an attachment.
To order any available report you need to register on our website. The payment can be made either through CCAvenue or PayPal payments gateways which accept all international cards.
We extend our support to 6 months post sale. A post sale customization is also provided to cover your unmet needs in the report.
Request Customization
We offer complimentary customization of up to 15% with every purchase. To share your customization requirements, feel free to email us at info@strategymrc.com or call us on +1-301-202-5929. .
Please Note: Customization within the 15% threshold is entirely free of charge. If your request exceeds this limit, we will conduct a feasibility assessment. Following that, a detailed quote and timeline will be provided.
WHY CHOOSE US ?

Assured Quality
Best in class reports with high standard of research integrity

24X7 Research Support
Continuous support to ensure the best customer experience.

Free Customization
Adding more values to your product of interest.

Safe & Secure Access
Providing a secured environment for all online transactions.

Trusted by 600+ Brands
Serving the most reputed brands across the world.