
Chemical Warehousing Market
Chemical Warehousing Market Forecasts to 2028 - Global Analysis By Type (General Warehouse and Specialty Chemicals Warehouse), Chemical Type (Petrochemical, Consumer Chemicals, Synthetic Rubber, Agrochemicals, Polymer and Plastic, Construction Chemicals, Textile Chemicals and Other Chemical Types) and By Geography

|
Years Covered |
2020-2028 |
|
Estimated Year Value (2022) |
US $16.18 BN |
|
Projected Year Value (2028) |
US $22.70 BN |
|
CAGR (2022 - 2028) |
5.8% |
|
Regions Covered |
North America, Europe, Asia Pacific, South America, and Middle East & Africa |
|
Countries Covered |
US, Canada, Mexico, Germany, UK, Italy, France, Spain, Japan, China, India, Australia, New Zealand, South Korea, Rest of Asia Pacific, South America, Argentina, Brazil, Chile, Middle East & Africa, Saudi Arabia, UAE, Qatar, and South Africa |
|
Largest Market |
Asia Pacific |
|
Fastest Growing Market |
North America |
According to Stratistics MRC, the Global Chemical Warehousing Market is accounted for $16.18 billion in 2022 and is expected to reach $22.70 billion by 2028 growing at a CAGR of 5.8% during the forecast period. Chemical warehousing involves both hazardous and non-hazardous materials storage. It is heavily regulated, requiring a substantial investment in the construction of facilities as well as strict adherence to the associated procedures, practices, and paperwork in order to guarantee safety and compliance. Many businesses have outsourced the storage of their goods to professionals, such third-party logistics (3PL) providers who are experts in chemical and hazardous operations. Services for warehousing, distribution, transportation, and inventory management are provided by companies that provide chemical warehousing and storage.
According to according to the American Chemistry Council, Chemical volumes in the United States increased by 1.4% in 2021 and 3.2% in 2022, while shipments increased by 8.1% in 2021 and 8.2% in 2022. Furthermore, according to the government of India, India's chemical sector (including fertilizers and pharmaceuticals) reached USD 178 billion in 2019 and is predicted to expand to USD 304 billion by 2025, with an annual growth rate of 9.3%. Therefore, the rise in chemical production is driving the growth of the chemical logistics market.
Market Dynamics:
Driver:
Rise in production and international trade
The market for chemical warehousing is primarily driven by an increase in chemical manufacturing and worldwide trade, particularly for hazardous chemicals. Particularly in the FMCG sector, there would be a huge demand for chemical warehouse facilities.
Restraint:
High costs of basic raw materials
The price of raw materials has an impact on both the amount of a product that a business can manufacture at any one time and the price of their finished product. Depending on quality, raw material prices can also change. Another aspect to take into account when choosing what and how much to purchase is the price of the raw materials. Higher-quality raw materials cost more than lower-quality raw materials. High costs of basic raw materials like natural gas and crude oil has a negative impact on the growth the market.
Opportunity:
Increasing trend of third-party logistics (3PL)
The market for chemical storage will see increased revenue opportunities due to the rising trend of third-party logistics (3PL) providers for a variety of warehousing, distribution, transportation, and inventory management services.
Threat:
Strict safety requirements
All harmful compounds, including those that are combustible, explosive, corrosive, poisonous, carcinogenic, and others, must be stored safely. Chemicals that are improperly stored have the potential to be extremely harmful and could result in a major accident.
Covid-19 Impact
The regional chemical warehousing and storage business was in upheaval in 2020 due to the spread of the COVID-19 pandemic. Due to COVID-19-related constraints, the logistics sector in nations like India, China, and Japan had a skilled labour scarcity, which in turn created challenging supply chain issues. However, after COVID-19, the market in question is anticipated to experience moderate development as consumer demand for chemical warehousing and storage from industries like automotive and electronics businesses is anticipated to gradually recover.
The specialty chemicals warehouses segment is expected to be the largest during the forecast period
Based on the type, the market is classified into General Warehouse and Specialty Chemicals Warehouse. The specialty chemicals warehouse segment is projected to control the global chemical warehousing market and most liable explanation for the majority of the share during the forecast period. Specialty chemical storage management has been subject to rules from OSHA and other regulatory bodies. Chemical warehouses can be used to store specialty chemicals such specialty polymers, radioactive materials, and nanomaterials. To reduce risks and hazards to the health and safety of workers and employees, chemical storage must be segregated.
The agrochemicals segment is expected to have the highest CAGR during the forecast period
Based on the chemical type, the market is segmented Petrochemical, Consumer Chemicals, Synthetic Rubber, Agrochemicals, Polymer and Plastic, Construction Chemicals, Textile Chemicals and Others. The agrochemicals segment is captured to be more profitable and predicted to record a strong CAGR during the forecast period. Rise in demand for agrochemicals has spurred revenue streams for logistics companies. Agrochemicals like fertilisers, insecticides, and herbicides are in great demand due to the agriculture industry's global scale.
Region with highest share:
Asia Pacific is anticipated to hold the highest share during the forecast period. Owing to the presence of a significantly high number of chemical production companies in the region. Urbanization and industrialisation are occurring quickly in Asia Pacific, boosting the expansion of numerous industries there. Due to the increased demand for chemical feedstock from these sectors, more warehouses are required to store the chemicals. Additionally, government programmes to upgrade warehouse infrastructure are fostering market expansion in the area.
Region with highest CAGR:
The North America chemical warehousing market is one of the fastest-growing regions and also records highest CAGR during the forecast period. This is due to the availability of low-cost raw resources (such natural gas) for the production of chemicals encourages large-scale chemical production in the area, which increases chemical storage and exports. In the U.S., investments are expected to increase in agrochemicals, textile chemicals, polymer, and plastic industries.

Key players in the market
Some of the key players profiled in the Chemical Warehousing Market include Deutsche Post DHL Group, Broekman Logistics, ALFRED TALKE GmbH & Co. KG, Broekman Logistics, Affiliated Warehouse Companies, Anchor 3PL, KEMITO, Commonwealth Inc., Odyssey Logistics & Technology Corporation, Univar Solutions, BRENNTAG, Warehouse Specialists Inc., Rinchem Company, Inc.
Key Developments:
In 2019, Vinmar entered into a contract with TALKE Group for Houston chemical logistics. The purpose of the contract was to handle plastic resins on the 500,000-square foot site that was designed for an initial term of 10 years.
In 2018, Odyssey Logistics & Technology Corporation acquired AFF Global Logistics, a recognized leader in logistics services to Hawaii, Alaska, PR, freight forwarding, and comprehensive warehousing and distribution services across North America productivity.
Type Covered:
• General Warehouse
• Specialty Chemicals Warehouse
Chemical Type Covered:
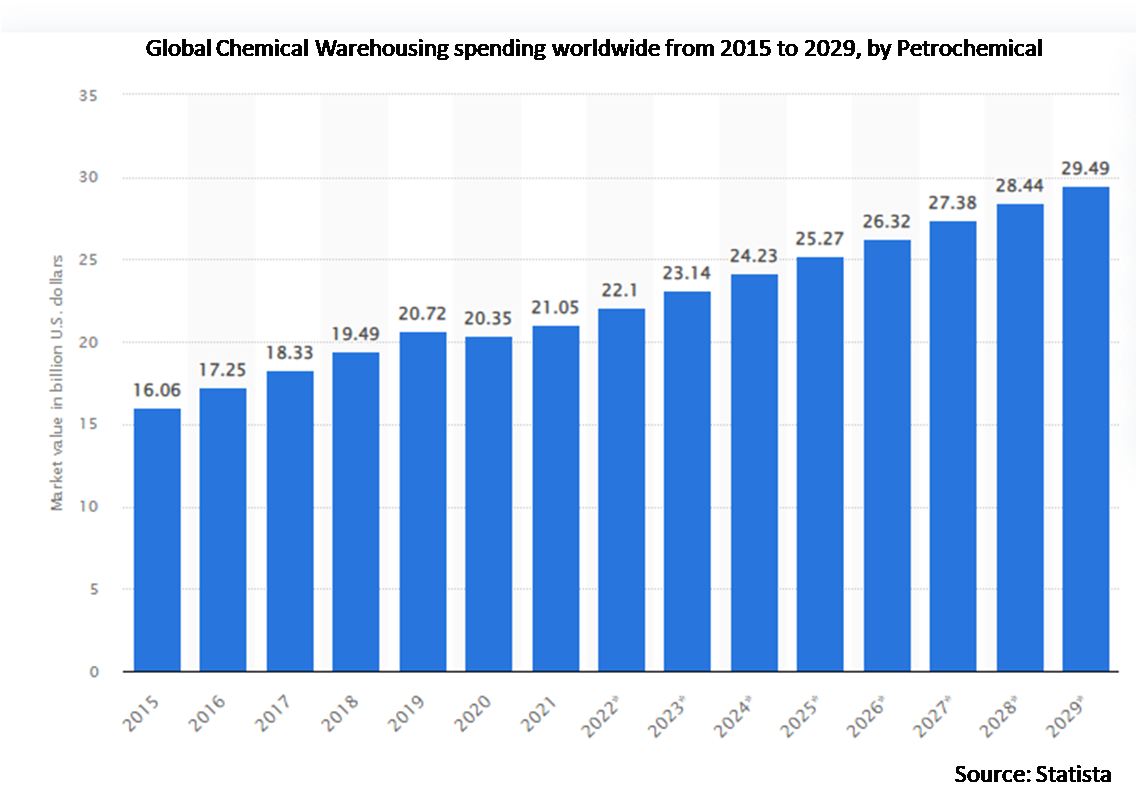
• Petrochemical
• Consumer Chemicals
• Synthetic Rubber
• Agrochemicals
• Polymer and Plastic
• Construction Chemicals
• Textile Chemicals
• Other Chemical Types
Regions Covered:
• North America
o US
o Canada
o Mexico
• Europe
o Germany
o UK
o Italy
o France
o Spain
o Rest of Europe
• Asia Pacific
o Japan
o China
o India
o Australia
o New Zealand
o South Korea
o Rest of Asia Pacific
• South America
o Argentina
o Brazil
o Chile
o Rest of South America
• Middle East & Africa
o Saudi Arabia
o UAE
o Qatar
o South Africa
o Rest of Middle East & Africa
What our report offers:
- Market share assessments for the regional and country-level segments
- Strategic recommendations for the new entrants
- Covers Market data for the years 2020, 2021, 2022, 2025, and 2028
- Market Trends (Drivers, Constraints, Opportunities, Threats, Challenges, Investment Opportunities, and recommendations)
- Strategic recommendations in key business segments based on the market estimations
- Competitive landscaping mapping the key common trends
- Company profiling with detailed strategies, financials, and recent developments
- Supply chain trends mapping the latest technological advancements
Free Customization Offerings:
All the customers of this report will be entitled to receive one of the following free customization options:
• Company Profiling
o Comprehensive profiling of additional market players (up to 3)
o SWOT Analysis of key players (up to 3)
• Regional Segmentation
o Market estimations, Forecasts and CAGR of any prominent country as per the client's interest (Note: Depends on feasibility check)
• Competitive Benchmarking
o Benchmarking of key players based on product portfolio, geographical presence, and strategic alliances
Table of Contents
1 Executive Summary
2 Preface
2.1 Abstract
2.2 Stake Holders
2.3 Research Scope
2.4 Research Methodology
2.4.1 Data Mining
2.4.2 Data Analysis
2.4.3 Data Validation
2.4.4 Research Approach
2.5 Research Sources
2.5.1 Primary Research Sources
2.5.2 Secondary Research Sources
2.5.3 Assumptions
3 Market Trend Analysis
3.1 Introduction
3.2 Drivers
3.3 Restraints
3.4 Opportunities
3.5 Threats
3.6 Product Analysis
3.7 Emerging Markets
3.8 Impact of Covid-19
4 Porters Five Force Analysis
4.1 Bargaining power of suppliers
4.2 Bargaining power of buyers
4.3 Threat of substitutes
4.4 Threat of new entrants
4.5 Competitive rivalry
5 Global Chemical Warehousing Market, By Type
5.1 Introduction
5.2 General Warehouse
5.3 Specialty Chemicals Warehouse
6 Global Chemical Warehousing Market, By Chemical Type
6.1 Introduction
6.2 Petrochemical
6.3 Consumer Chemicals
6.4 Synthetic Rubber
6.5 Agrochemicals
6.6 Polymer and Plastic
6.7 Construction Chemicals
6.8 Textile Chemicals
6.9 Other Chemical Types
7 Global Chemical Warehousing Market, By Geography
7.1 Introduction
7.2 North America
7.2.1 US
7.2.2 Canada
7.2.3 Mexico
7.3 Europe
7.3.1 Germany
7.3.2 UK
7.3.3 Italy
7.3.4 France
7.3.5 Spain
7.3.6 Rest of Europe
7.4 Asia Pacific
7.4.1 Japan
7.4.2 China
7.4.3 India
7.4.4 Australia
7.4.5 New Zealand
7.4.6 South Korea
7.4.7 Rest of Asia Pacific
7.5 South America
7.5.1 Argentina
7.5.2 Brazil
7.5.3 Chile
7.5.4 Rest of South America
7.6 Middle East & Africa
7.6.1 Saudi Arabia
7.6.2 UAE
7.6.3 Qatar
7.6.4 South Africa
7.6.5 Rest of Middle East & Africa
8 Key Developments
8.1 Agreements, Partnerships, Collaborations and Joint Ventures
8.2 Acquisitions & Mergers
8.3 New Product Launch
8.4 Expansions
8.5 Other Key Strategies
9 Company Profiling
9.1 Deutsche Post DHL Group
9.2 Broekman Logistics
9.3 ALFRED TALKE GmbH & Co. KG
9.4 Broekman Logistics
9.5 Affiliated Warehouse Companies
9.6 Anchor 3PL
9.7 KEMITO
9.8 Commonwealth Inc.
9.9 Odyssey Logistics & Technology Corporation
9.10 Univar Solutions
9.11 BRENNTAG
9.12 Warehouse Specialists Inc.
9.13 Rinchem Company, Inc.
List of Tables
1 Global Chemical Warehousing Market Outlook, By Region (2020-2028) ($MN)
2 Global Chemical Warehousing Market Outlook, By Type (2020-2028) ($MN)
3 Global Chemical Warehousing Market Outlook, By General Warehouse (2020-2028) ($MN)
4 Global Chemical Warehousing Market Outlook, By Specialty Chemicals Warehouse (2020-2028) ($MN)
5 Global Chemical Warehousing Market Outlook, By Chemical Type (2020-2028) ($MN)
6 Global Chemical Warehousing Market Outlook, By Petrochemical (2020-2028) ($MN)
7 Global Chemical Warehousing Market Outlook, By Consumer Chemicals (2020-2028) ($MN)
8 Global Chemical Warehousing Market Outlook, By Synthetic Rubber (2020-2028) ($MN)
9 Global Chemical Warehousing Market Outlook, By Agrochemicals (2020-2028) ($MN)
10 Global Chemical Warehousing Market Outlook, By Polymer and Plastic (2020-2028) ($MN)
11 Global Chemical Warehousing Market Outlook, By Construction Chemicals (2020-2028) ($MN)
12 Global Chemical Warehousing Market Outlook, By Textile Chemicals (2020-2028) ($MN)
13 Global Chemical Warehousing Market Outlook, By Others (2020-2028) ($MN)
14 Global Chemical Warehousing Market Outlook, By Country (2020-2028) ($MN)
15 North America Chemical Warehousing Market Outlook, By Type (2020-2028) ($MN)
16 North America Chemical Warehousing Market Outlook, By General Warehouse (2020-2028) ($MN)
17 North America Chemical Warehousing Market Outlook, By Specialty Chemicals Warehouse (2020-2028) ($MN)
18 North America Chemical Warehousing Market Outlook, By Chemical Type (2020-2028) ($MN)
19 North America Chemical Warehousing Market Outlook, By Petrochemical (2020-2028) ($MN)
20 North America Chemical Warehousing Market Outlook, By Consumer Chemicals (2020-2028) ($MN)
21 North America Chemical Warehousing Market Outlook, By Synthetic Rubber (2020-2028) ($MN)
22 North America Chemical Warehousing Market Outlook, By Agrochemicals (2020-2028) ($MN)
23 North America Chemical Warehousing Market Outlook, By Polymer and Plastic (2020-2028) ($MN)
24 North America Chemical Warehousing Market Outlook, By Construction Chemicals (2020-2028) ($MN)
25 North America Chemical Warehousing Market Outlook, By Textile Chemicals (2020-2028) ($MN)
26 North America Chemical Warehousing Market Outlook, By Chemical Types (2020-2028) ($MN)
27 Europe Chemical Warehousing Market Outlook, By Type (2020-2028) ($MN)
28 Europe Chemical Warehousing Market Outlook, By General Warehouse (2020-2028) ($MN)
29 Europe Chemical Warehousing Market Outlook, By Specialty Chemicals Warehouse (2020-2028) ($MN)
30 Europe Chemical Warehousing Market Outlook, By Chemical Type (2020-2028) ($MN)
31 Europe Chemical Warehousing Market Outlook, By Petrochemical (2020-2028) ($MN)
32 Europe Chemical Warehousing Market Outlook, By Consumer Chemicals (2020-2028) ($MN)
33 Europe Chemical Warehousing Market Outlook, By Synthetic Rubber (2020-2028) ($MN)
34 Europe Chemical Warehousing Market Outlook, By Agrochemicals (2020-2028) ($MN)
35 Europe Chemical Warehousing Market Outlook, By Polymer and Plastic (2020-2028) ($MN)
36 Europe Chemical Warehousing Market Outlook, By Construction Chemicals (2020-2028) ($MN)
37 Europe Chemical Warehousing Market Outlook, By Textile Chemicals (2020-2028) ($MN)
38 Europe Chemical Warehousing Market Outlook, By Others (2020-2028) ($MN)
39 Aisa Pacific Chemical Warehousing Market Outlook, By Type (2020-2028) ($MN)
40 Aisa Pacific Chemical Warehousing Market Outlook, By General Warehouse (2020-2028) ($MN)
41 Aisa Pacific Chemical Warehousing Market Outlook, By Specialty Chemicals Warehouse (2020-2028) ($MN)
42 Aisa Pacific Chemical Warehousing Market Outlook, By Chemical Type (2020-2028) ($MN)
43 Aisa Pacific Chemical Warehousing Market Outlook, By Petrochemical (2020-2028) ($MN)
44 Aisa Pacific Chemical Warehousing Market Outlook, By Consumer Chemicals (2020-2028) ($MN)
45 Aisa Pacific Chemical Warehousing Market Outlook, By Synthetic Rubber (2020-2028) ($MN)
46 Aisa Pacific Chemical Warehousing Market Outlook, By Agrochemicals (2020-2028) ($MN)
47 Aisa Pacific Chemical Warehousing Market Outlook, By Polymer and Plastic (2020-2028) ($MN)
48 Aisa Pacific Chemical Warehousing Market Outlook, By Construction Chemicals (2020-2028) ($MN)
49 Aisa Pacific Chemical Warehousing Market Outlook, By Textile Chemicals (2020-2028) ($MN)
50 Aisa Pacific Chemical Warehousing Market Outlook, By Others (2020-2028) ($MN)
51 South America Chemical Warehousing Market Outlook, By Type (2020-2028) ($MN)
52 South America Chemical Warehousing Market Outlook, By General Warehouse (2020-2028) ($MN)
53 South America Chemical Warehousing Market Outlook, By Specialty Chemicals Warehouse (2020-2028) ($MN)
54 South America Chemical Warehousing Market Outlook, By Chemical Type (2020-2028) ($MN)
55 South America Chemical Warehousing Market Outlook, By Petrochemical (2020-2028) ($MN)
56 South America Chemical Warehousing Market Outlook, By Consumer Chemicals (2020-2028) ($MN)
57 South America Chemical Warehousing Market Outlook, By Synthetic Rubber (2020-2028) ($MN)
58 South America Chemical Warehousing Market Outlook, By Agrochemicals (2020-2028) ($MN)
59 South America Chemical Warehousing Market Outlook, By Polymer and Plastic (2020-2028) ($MN)
60 South America Chemical Warehousing Market Outlook, By Construction Chemicals (2020-2028) ($MN)
61 South America Chemical Warehousing Market Outlook, By Textile Chemicals (2020-2028) ($MN)
62 South America Chemical Warehousing Market Outlook, By Others (2020-2028) ($MN)
63 Middle East & Africa Chemical Warehousing Market Outlook, By Type (2020-2028) ($MN)
64 Middle East & Africa Chemical Warehousing Market Outlook, By General Warehouse (2020-2028) ($MN)
65 Middle East & Africa Chemical Warehousing Market Outlook, By Specialty Chemicals Warehouse (2020-2028) ($MN)
66 Middle East & Africa Chemical Warehousing Market Outlook, By Chemical Type (2020-2028) ($MN)
67 Middle East & Africa Chemical Warehousing Market Outlook, By Petrochemical (2020-2028) ($MN)
68 Middle East & Africa Chemical Warehousing Market Outlook, By Consumer Chemicals (2020-2028) ($MN)
69 Middle East & Africa Chemical Warehousing Market Outlook, By Synthetic Rubber (2020-2028) ($MN)
70 Middle East & Africa Chemical Warehousing Market Outlook, By Agrochemicals (2020-2028) ($MN)
71 Middle East & Africa Chemical Warehousing Market Outlook, By Polymer and Plastic (2020-2028) ($MN)
72 Middle East & Africa Chemical Warehousing Market Outlook, By Construction Chemicals (2020-2028) ($MN)
73 Middle East & Africa Chemical Warehousing Market Outlook, By Textile Chemicals (2020-2028) ($MN)
74 Middle East & Africa Chemical Warehousing Market Outlook, By Others (2020-2028) ($MN)
List of Figures
RESEARCH METHODOLOGY

We at ‘Stratistics’ opt for an extensive research approach which involves data mining, data validation, and data analysis. The various research sources include in-house repository, secondary research, competitor’s sources, social media research, client internal data, and primary research.
Our team of analysts prefers the most reliable and authenticated data sources in order to perform the comprehensive literature search. With access to most of the authenticated data bases our team highly considers the best mix of information through various sources to obtain extensive and accurate analysis.
Each report takes an average time of a month and a team of 4 industry analysts. The time may vary depending on the scope and data availability of the desired market report. The various parameters used in the market assessment are standardized in order to enhance the data accuracy.
Data Mining
The data is collected from several authenticated, reliable, paid and unpaid sources and is filtered depending on the scope & objective of the research. Our reports repository acts as an added advantage in this procedure. Data gathering from the raw material suppliers, distributors and the manufacturers is performed on a regular basis, this helps in the comprehensive understanding of the products value chain. Apart from the above mentioned sources the data is also collected from the industry consultants to ensure the objective of the study is in the right direction.
Market trends such as technological advancements, regulatory affairs, market dynamics (Drivers, Restraints, Opportunities and Challenges) are obtained from scientific journals, market related national & international associations and organizations.
Data Analysis
From the data that is collected depending on the scope & objective of the research the data is subjected for the analysis. The critical steps that we follow for the data analysis include:
- Product Lifecycle Analysis
- Competitor analysis
- Risk analysis
- Porters Analysis
- PESTEL Analysis
- SWOT Analysis
The data engineering is performed by the core industry experts considering both the Marketing Mix Modeling and the Demand Forecasting. The marketing mix modeling makes use of multiple-regression techniques to predict the optimal mix of marketing variables. Regression factor is based on a number of variables and how they relate to an outcome such as sales or profits.
Data Validation
The data validation is performed by the exhaustive primary research from the expert interviews. This includes telephonic interviews, focus groups, face to face interviews, and questionnaires to validate our research from all aspects. The industry experts we approach come from the leading firms, involved in the supply chain ranging from the suppliers, distributors to the manufacturers and consumers so as to ensure an unbiased analysis.
We are in touch with more than 15,000 industry experts with the right mix of consultants, CEO's, presidents, vice presidents, managers, experts from both supply side and demand side, executives and so on.
The data validation involves the primary research from the industry experts belonging to:
- Leading Companies
- Suppliers & Distributors
- Manufacturers
- Consumers
- Industry/Strategic Consultants
Apart from the data validation the primary research also helps in performing the fill gap research, i.e. providing solutions for the unmet needs of the research which helps in enhancing the reports quality.
For more details about research methodology, kindly write to us at info@strategymrc.com
Frequently Asked Questions
In case of any queries regarding this report, you can contact the customer service by filing the “Inquiry Before Buy” form available on the right hand side. You may also contact us through email: info@strategymrc.com or phone: +1-301-202-5929
Yes, the samples are available for all the published reports. You can request them by filling the “Request Sample” option available in this page.
Yes, you can request a sample with your specific requirements. All the customized samples will be provided as per the requirement with the real data masked.
All our reports are available in Digital PDF format. In case if you require them in any other formats, such as PPT, Excel etc you can submit a request through “Inquiry Before Buy” form available on the right hand side. You may also contact us through email: info@strategymrc.com or phone: +1-301-202-5929
We offer a free 15% customization with every purchase. This requirement can be fulfilled for both pre and post sale. You may send your customization requirements through email at info@strategymrc.com or call us on +1-301-202-5929.
We have 3 different licensing options available in electronic format.
- Single User Licence: Allows one person, typically the buyer, to have access to the ordered product. The ordered product cannot be distributed to anyone else.
- 2-5 User Licence: Allows the ordered product to be shared among a maximum of 5 people within your organisation.
- Corporate License: Allows the product to be shared among all employees of your organisation regardless of their geographical location.
All our reports are typically be emailed to you as an attachment.
To order any available report you need to register on our website. The payment can be made either through CCAvenue or PayPal payments gateways which accept all international cards.
We extend our support to 6 months post sale. A post sale customization is also provided to cover your unmet needs in the report.
Request Customization
We offer complimentary customization of up to 15% with every purchase. To share your customization requirements, feel free to email us at info@strategymrc.com or call us on +1-301-202-5929. .
Please Note: Customization within the 15% threshold is entirely free of charge. If your request exceeds this limit, we will conduct a feasibility assessment. Following that, a detailed quote and timeline will be provided.
WHY CHOOSE US ?

Assured Quality
Best in class reports with high standard of research integrity

24X7 Research Support
Continuous support to ensure the best customer experience.

Free Customization
Adding more values to your product of interest.

Safe & Secure Access
Providing a secured environment for all online transactions.

Trusted by 600+ Brands
Serving the most reputed brands across the world.