
Cng Powertrain Market
CNG Powertrain Market Forecasts to 2028 - Global Analysis By Drive Type (Front Wheel Drive, All-Wheel Drive and Rear Wheel Drive), Fuel Type (Bi-Fuel, Mono Fuel and Other Fuel Types), Vehicle Type (Commercial Vehicle and Passenger Vehicle), and By Geography

|
Years Covered |
2020-2028 |
|
Estimated Year Value (2022) |
US $82.14 BN |
|
Projected Year Value (2028) |
US $237.76 BN |
|
CAGR (2022 - 2028) |
19.38% |
|
Regions Covered |
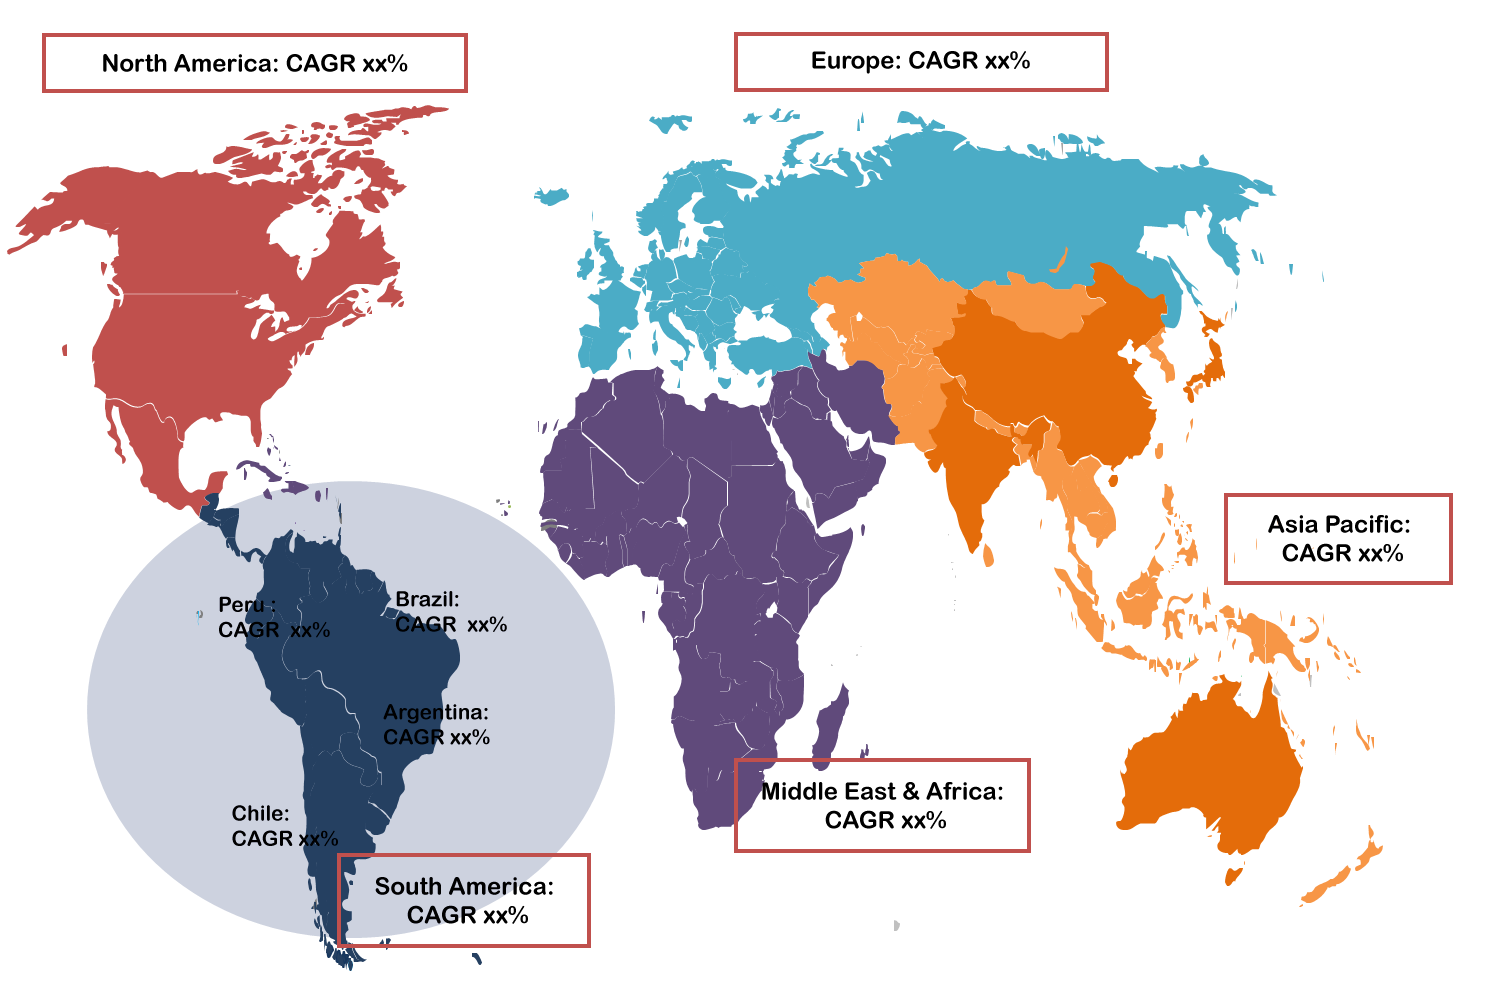
North America, Europe, Asia Pacific, South America, and Middle East & Africa |
|
Countries Covered |
US, Canada, Mexico, Germany, UK, Italy, France, Spain, Japan, China, India, Australia, New Zealand, South Korea, Rest of Asia Pacific, South America, Argentina, Brazil, Chile, Middle East & Africa, Saudi Arabia, UAE, Qatar, and South Africa |
|
Largest Market |
Asia Pacific |
|
Highest Growing Market |
South America |
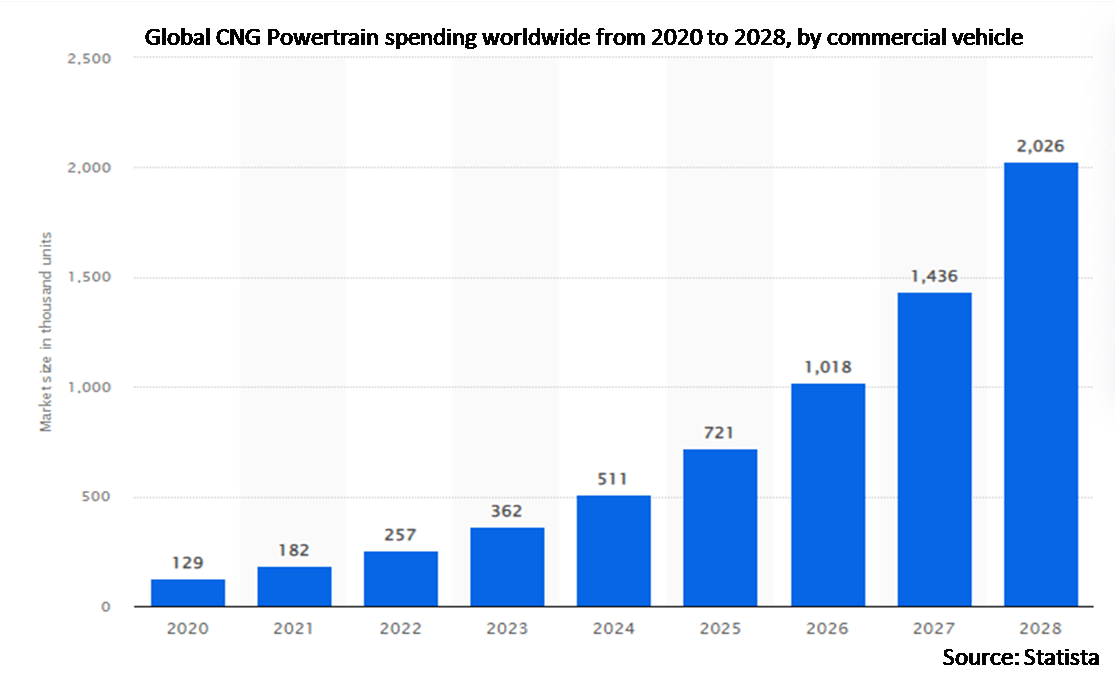
According to Stratistics MRC, the Global CNG Powertrain Market is accounted for $82.14 billion in 2022 and is expected to reach $237.76 billion by 2028 growing at a CAGR of 19.38% during the forecast period. The pursuit of the net-zero carbon emissions target is driven by a rising need for an alternate transitional fuel. Compressed Natural Gas (CNG) is predicted to overtake other fuels like diesel, petrol and LPG as a dominating energy source since it emits fewer carbon emissions and no particle matter, which is a significant source of vehicle pollution. Governments all over the world are taking strategic steps to offer tax breaks, subsidies, and other incentives to people who buy CNG vehicles, which is anticipated to lead to a significant increase in demand for CNG powertrain vehicles during the projected period.
According to the International Energy Agency, in 2012, India had a stock of EV cars of about 2,800 units, which increased to about 23,000 units in 2021. According to the Ministry of Heavy Industries, more than 0.52 million EVs were registered in India in the last three years.
Market Dynamics:
Driver:
Increasing Demand for a Transitory Alternate Fuel
The rising demand for alternative transitional fuels is advancing the objective of achieving zero carbon emissions. Compared to other fuels including diesel, petrol and liquefied petroleum gas (LPG), compressed natural gas (CNG) emits less carbon dioxide into the atmosphere. Particulate matter, a major contributor to pollution, is absent from it. Governments all over the world are taking calculated actions to provide citizens with tax breaks, subsidies, and other benefits, therefore it is anticipated that a sizable demand for CNG powertrain vehicles will arise over the projection period.
Restraint:
High maintenance and investment costs
Since these vehicles have extra components, CNG and LPG powertrain are often more expensive than conventional petrol vehicles. Because most of these cars lack lubrication, they require more frequent maintenance, which over time increases the cost because some parts degrade more quickly than in gasoline-powered cars. The parts also need to be replaced more frequently than those in gasoline-powered cars, whose lifespan is usually longer. For instance, fleet operators that frequently travel for business purposes might use CNG. Only when they are used often can CNG and LPG vehicles be considered cost-effective.
Opportunity:
Manufacturer’s Primary Focus on Enhancing Engine Efficiency
The development of more efficient engines for CNG powertrain is a top priority for the industry. By lowering the volumetric efficiency loss, speeding up flame spread, and lowering petrol evaporation from the engine, they are making an investment in enhancing the engine's performance. Leading automakers are also putting innovative technologies onto their CNG vehicles. For instance, S-CNG technology is added to passenger cars to increase fuel efficiency. To do this, the fuel-to-air ratio is modified, and the intelligent fuel injection system is synchronised with the electric control units.
Threat:
Excessive initial outlay
Automobiles powered by CNG and LPG are more expensive than those powered by regular petrol. This is caused by the extra parts that have been added to these cars. Because most of these vehicles lack lubricants, different parts of them deteriorate more quickly than those powered by petrol, including parts that are more prone to overheating. As a result, these vehicles need a lot more regular maintenance over time, which increases their overall cost. Additionally, the parts need to be changed frequently, as opposed to petrol cars, which normally have a longer lifespan than comparable equipment.
Covid-19 Impact
The COVID 19 epidemic had paralysed the whole eco-system and stopped the manufacture and sale of new cars. Operations were negatively impacted since manufacturers had to wait for the lockdowns to be lifted before they could resume production. Automakers were forced to change their manufacturing volumes as a result. Additionally, the production of components was stopped, and tiny Tier 2 and Tier 3 manufacturers experienced cash flow issues. The automotive sector has high capital intensity and frequently needs finance to remain afloat. As a result, the pandemic's reduced demand and production standstill had a remarkable effect on the CNG Powertrain market.
The front wheel drive segment is expected to be the largest during the forecast period
The front wheel drive segment is estimated to have a lucrative growth, due to the benefits of front-wheel drive cars, including their light weight, better fuel economy, and balanced weight distribution, which helps the car's overall stability on rough terrain. Additionally, users can save money by choosing front-wheel drive because the drive trains need less maintenance and the engine has better fuel efficiency.
The bi-fuel segment is expected to have the highest CAGR during the forecast period
The bi-fuel segment is anticipated to witness the fastest CAGR growth during the forecast period, due to the rising use of contemporary technologies like S-CNG. With this technology, switching between petrol and CNG is simple and doesn't affect engine performance. Sales of bi-fuel CNG powertrains have increased as a result of the advancement of fuel injection technology, which enables CNG to be directly injected into the existing combustion chamber.
Region with highest share:
Asia Pacific is projected to hold the largest market share during the forecast period owing to the automotive industry's explosive growth in nations like China and India. With the help of important local enterprises, the region is also experiencing considerable technological improvements, particularly in the expansion of CNG infrastructure. These vehicles have a CNG engine that improves all-terrain manoeuvrability and provides excellent performance thanks to an effective fuel injection system.
Region with highest CAGR:
South America is projected to have the highest CAGR over the forecast period. Automobile spending has increased as a result of rising per capita incomes among consumers in Argentina, Brazil, and Colombia. Due to the viability, affordability, and environmental friendliness of automobiles powered by compressed natural gas, consumers are investing a lot of money to buy a personal vehicle. The "Conectar Gas Industria" programme was also started by the Argentine government to encourage the widespread usage of CNG-powered cars.
Key players in the market
Some of the key players profiled in the CNG Powertrain Market include FPT Industrial S.P.A., Nissan Motor Co. Ltd., Cummins Inc., Honda Motor Company., Maruti Suzuki India Limited, AB Volvo, Hyundai Motor Company, Robert Bosch GmbH., Volkswagen AG and Ford Motor Company.
Key Developments:
In June 2022, Volvo Energy invests in Connected Energy for the second-life battery business. Volvo Energy invests in the UK-based, second-life battery energy storage specialist Connected Energy in order to further accelerate Volvo Group's battery business and sustainability opportunities.
In June 2022, Volvo CE will be the first to deliver construction machines built using fossil-free steel to customers. The company will continue to introduce production using fossil-free steel into its machines and components, dependent on aspects such as steel availability.
Drive Types Covered:
• Front Wheel Drive
• All-Wheel Drive
• Rear Wheel Drive
Fuel Types Covered:
• Bi-Fuel
• Mono Fuel
• Other Fuel Types
Vehicle Types Covered:
• Commercial Vehicle
• Passenger Vehicle
Regions Covered:
• North America
o US
o Canada
o Mexico
• Europe
o Germany
o UK
o Italy
o France
o Spain
o Rest of Europe
• Asia Pacific
o Japan
o China
o India
o Australia
o New Zealand
o South Korea
o Rest of Asia Pacific
• South America
o Argentina
o Brazil
o Chile
o Rest of South America
• Middle East & Africa
o Saudi Arabia
o UAE
o Qatar
o South Africa
o Rest of Middle East & Africa
What our report offers:
- Market share assessments for the regional and country-level segments
- Strategic recommendations for the new entrants
- Covers Market data for the years 2020, 2021, 2022, 2025, and 2028
- Market Trends (Drivers, Constraints, Opportunities, Threats, Challenges, Investment Opportunities, and recommendations)
- Strategic recommendations in key business segments based on the market estimations
- Competitive landscaping mapping the key common trends
- Company profiling with detailed strategies, financials, and recent developments
- Supply chain trends mapping the latest technological advancements
Free Customization Offerings:
All the customers of this report will be entitled to receive one of the following free customization options:
• Company Profiling
o Comprehensive profiling of additional market players (up to 3)
o SWOT Analysis of key players (up to 3)
• Regional Segmentation
o Market estimations, Forecasts and CAGR of any prominent country as per the client's interest (Note: Depends on feasibility check)
• Competitive Benchmarking
o Benchmarking of key players based on product portfolio, geographical presence, and strategic alliances
Table of Contents
1 Executive Summary
2 Preface
2.1 Abstract
2.2 Stake Holders
2.3 Research Scope
2.4 Research Methodology
2.4.1 Data Mining
2.4.2 Data Analysis
2.4.3 Data Validation
2.4.4 Research Approach
2.5 Research Sources
2.5.1 Primary Research Sources
2.5.2 Secondary Research Sources
2.5.3 Assumptions
3 Market Trend Analysis
3.1 Introduction
3.2 Drivers
3.3 Restraints
3.4 Opportunities
3.5 Threats
3.6 Emerging Markets
3.7 Impact of Covid-19
4 Porters Five Force Analysis
4.1 Bargaining power of suppliers
4.2 Bargaining power of buyers
4.3 Threat of substitutes
4.4 Threat of new entrants
4.5 Competitive rivalry
5 Global CNG Powertrain Market, By Drive Type
5.1 Introduction
5.2 Front Wheel Drive
5.3 All-Wheel Drive
5.4 Rear Wheel Drive
6 Global CNG Powertrain Market, By Fuel Type
6.1 Introduction
6.2 Bi-Fuel
6.3 Mono Fuel
6.4 Other Fuel Types
7 Global CNG Powertrain Market, By Vehicle Type
7.1 Introduction
7.2 Commercial Vehicle
7.3 Passenger Vehicle
8 Global CNG Powertrain Market, By Geography
8.1 Introduction
8.2 North America
8.2.1 US
8.2.2 Canada
8.2.3 Mexico
8.3 Europe
8.3.1 Germany
8.3.2 UK
8.3.3 Italy
8.3.4 France
8.3.5 Spain
8.3.6 Rest of Europe
8.4 Asia Pacific
8.4.1 Japan
8.4.2 China
8.4.3 India
8.4.4 Australia
8.4.5 New Zealand
8.4.6 South Korea
8.4.7 Rest of Asia Pacific
8.5 South America
8.5.1 Argentina
8.5.2 Brazil
8.5.3 Chile
8.5.4 Rest of South America
8.6 Middle East & Africa
8.6.1 Saudi Arabia
8.6.2 UAE
8.6.3 Qatar
8.6.4 South Africa
8.6.5 Rest of Middle East & Africa
9 Key Developments
9.1 Agreements, Partnerships, Collaborations and Joint Ventures
9.2 Acquisitions & Mergers
9.3 New Product Launch
9.4 Expansions
9.5 Other Key Strategies
10 Company Profiling
10.1 FPT Industrial S.P.A.
10.2 Nissan Motor Co. Ltd.
10.3 Cummins Inc.
10.4 Honda Motor Company.
10.5 Maruti Suzuki India Limited
10.6 AB Volvo
10.7 Hyundai Motor Company
10.8 Robert Bosch GmbH.
10.9 Volkswagen AG
10.10 Ford Motor Company
List of Tables
1 Global CNG Powertrain Market Outlook, By Region (2020-2028) ($MN)
2 Global CNG Powertrain Market Outlook, By Drive Type (2020-2028) ($MN)
3 Global CNG Powertrain Market Outlook, By Front Wheel Drive (2020-2028) ($MN)
4 Global CNG Powertrain Market Outlook, By All-Wheel Drive (2020-2028) ($MN)
5 Global CNG Powertrain Market Outlook, By Rear Wheel Drive (2020-2028) ($MN)
6 Global CNG Powertrain Market Outlook, By Fuel Type (2020-2028) ($MN)
7 Global CNG Powertrain Market Outlook, By Bi-Fuel (2020-2028) ($MN)
8 Global CNG Powertrain Market Outlook, By Mono Fuel (2020-2028) ($MN)
9 Global CNG Powertrain Market Outlook, By Other Fuel Types (2020-2028) ($MN)
10 Global CNG Powertrain Market Outlook, By Vehicle Type (2020-2028) ($MN)
11 Global CNG Powertrain Market Outlook, By Commercial Vehicle (2020-2028) ($MN)
12 Global CNG Powertrain Market Outlook, By Passenger Vehicle (2020-2028) ($MN)
13 North America CNG Powertrain Market Outlook, By Country (2020-2028) ($MN)
14 North America CNG Powertrain Market Outlook, By Drive Type (2020-2028) ($MN)
15 North America CNG Powertrain Market Outlook, By Front Wheel Drive (2020-2028) ($MN)
16 North America CNG Powertrain Market Outlook, By All-Wheel Drive (2020-2028) ($MN)
17 North America CNG Powertrain Market Outlook, By Rear Wheel Drive (2020-2028) ($MN)
18 North America CNG Powertrain Market Outlook, By Fuel Type (2020-2028) ($MN)
19 North America CNG Powertrain Market Outlook, By Bi-Fuel (2020-2028) ($MN)
20 North America CNG Powertrain Market Outlook, By Mono Fuel (2020-2028) ($MN)
21 North America CNG Powertrain Market Outlook, By Other Fuel Types (2020-2028) ($MN)
22 North America CNG Powertrain Market Outlook, By Vehicle Type (2020-2028) ($MN)
23 North America CNG Powertrain Market Outlook, By Commercial Vehicle (2020-2028) ($MN)
24 North America CNG Powertrain Market Outlook, By Passenger Vehicle (2020-2028) ($MN)
25 Europe CNG Powertrain Market Outlook, By Country (2020-2028) ($MN)
26 Europe CNG Powertrain Market Outlook, By Drive Type (2020-2028) ($MN)
27 Europe CNG Powertrain Market Outlook, By Front Wheel Drive (2020-2028) ($MN)
28 Europe CNG Powertrain Market Outlook, By All-Wheel Drive (2020-2028) ($MN)
29 Europe CNG Powertrain Market Outlook, By Rear Wheel Drive (2020-2028) ($MN)
30 Europe CNG Powertrain Market Outlook, By Fuel Type (2020-2028) ($MN)
31 Europe CNG Powertrain Market Outlook, By Bi-Fuel (2020-2028) ($MN)
32 Europe CNG Powertrain Market Outlook, By Mono Fuel (2020-2028) ($MN)
33 Europe CNG Powertrain Market Outlook, By Other Fuel Types (2020-2028) ($MN)
34 Europe CNG Powertrain Market Outlook, By Vehicle Type (2020-2028) ($MN)
35 Europe CNG Powertrain Market Outlook, By Commercial Vehicle (2020-2028) ($MN)
36 Europe CNG Powertrain Market Outlook, By Passenger Vehicle (2020-2028) ($MN)
37 Asia Pacific CNG Powertrain Market Outlook, By Country (2020-2028) ($MN)
38 Asia Pacific CNG Powertrain Market Outlook, By Drive Type (2020-2028) ($MN)
39 Asia Pacific CNG Powertrain Market Outlook, By Front Wheel Drive (2020-2028) ($MN)
40 Asia Pacific CNG Powertrain Market Outlook, By All-Wheel Drive (2020-2028) ($MN)
41 Asia Pacific CNG Powertrain Market Outlook, By Rear Wheel Drive (2020-2028) ($MN)
42 Asia Pacific CNG Powertrain Market Outlook, By Fuel Type (2020-2028) ($MN)
43 Asia Pacific CNG Powertrain Market Outlook, By Bi-Fuel (2020-2028) ($MN)
44 Asia Pacific CNG Powertrain Market Outlook, By Mono Fuel (2020-2028) ($MN)
45 Asia Pacific CNG Powertrain Market Outlook, By Other Fuel Types (2020-2028) ($MN)
46 Asia Pacific CNG Powertrain Market Outlook, By Vehicle Type (2020-2028) ($MN)
47 Asia Pacific CNG Powertrain Market Outlook, By Commercial Vehicle (2020-2028) ($MN)
48 Asia Pacific CNG Powertrain Market Outlook, By Passenger Vehicle (2020-2028) ($MN)
49 South America CNG Powertrain Market Outlook, By Country (2020-2028) ($MN)
50 South America CNG Powertrain Market Outlook, By Drive Type (2020-2028) ($MN)
51 South America CNG Powertrain Market Outlook, By Front Wheel Drive (2020-2028) ($MN)
52 South America CNG Powertrain Market Outlook, By All-Wheel Drive (2020-2028) ($MN)
53 South America CNG Powertrain Market Outlook, By Rear Wheel Drive (2020-2028) ($MN)
54 South America CNG Powertrain Market Outlook, By Fuel Type (2020-2028) ($MN)
55 South America CNG Powertrain Market Outlook, By Bi-Fuel (2020-2028) ($MN)
56 South America CNG Powertrain Market Outlook, By Mono Fuel (2020-2028) ($MN)
57 South America CNG Powertrain Market Outlook, By Other Fuel Types (2020-2028) ($MN)
58 South America CNG Powertrain Market Outlook, By Vehicle Type (2020-2028) ($MN)
59 South America CNG Powertrain Market Outlook, By Commercial Vehicle (2020-2028) ($MN)
60 South America CNG Powertrain Market Outlook, By Passenger Vehicle (2020-2028) ($MN)
61 Middle East & Africa CNG Powertrain Market Outlook, By Country (2020-2028) ($MN)
62 Middle East & Africa CNG Powertrain Market Outlook, By Drive Type (2020-2028) ($MN)
63 Middle East & Africa CNG Powertrain Market Outlook, By Front Wheel Drive (2020-2028) ($MN)
64 Middle East & Africa CNG Powertrain Market Outlook, By All-Wheel Drive (2020-2028) ($MN)
65 Middle East & Africa CNG Powertrain Market Outlook, By Rear Wheel Drive (2020-2028) ($MN)
66 Middle East & Africa CNG Powertrain Market Outlook, By Fuel Type (2020-2028) ($MN)
67 Middle East & Africa CNG Powertrain Market Outlook, By Bi-Fuel (2020-2028) ($MN)
68 Middle East & Africa CNG Powertrain Market Outlook, By Mono Fuel (2020-2028) ($MN)
69 Middle East & Africa CNG Powertrain Market Outlook, By Other Fuel Types (2020-2028) ($MN)
70 Middle East & Africa CNG Powertrain Market Outlook, By Vehicle Type (2020-2028) ($MN)
71 Middle East & Africa CNG Powertrain Market Outlook, By Commercial Vehicle (2020-2028) ($MN)
72 Middle East & Africa CNG Powertrain Market Outlook, By Passenger Vehicle (2020-2028) ($MN)
List of Figures
RESEARCH METHODOLOGY

We at ‘Stratistics’ opt for an extensive research approach which involves data mining, data validation, and data analysis. The various research sources include in-house repository, secondary research, competitor’s sources, social media research, client internal data, and primary research.
Our team of analysts prefers the most reliable and authenticated data sources in order to perform the comprehensive literature search. With access to most of the authenticated data bases our team highly considers the best mix of information through various sources to obtain extensive and accurate analysis.
Each report takes an average time of a month and a team of 4 industry analysts. The time may vary depending on the scope and data availability of the desired market report. The various parameters used in the market assessment are standardized in order to enhance the data accuracy.
Data Mining
The data is collected from several authenticated, reliable, paid and unpaid sources and is filtered depending on the scope & objective of the research. Our reports repository acts as an added advantage in this procedure. Data gathering from the raw material suppliers, distributors and the manufacturers is performed on a regular basis, this helps in the comprehensive understanding of the products value chain. Apart from the above mentioned sources the data is also collected from the industry consultants to ensure the objective of the study is in the right direction.
Market trends such as technological advancements, regulatory affairs, market dynamics (Drivers, Restraints, Opportunities and Challenges) are obtained from scientific journals, market related national & international associations and organizations.
Data Analysis
From the data that is collected depending on the scope & objective of the research the data is subjected for the analysis. The critical steps that we follow for the data analysis include:
- Product Lifecycle Analysis
- Competitor analysis
- Risk analysis
- Porters Analysis
- PESTEL Analysis
- SWOT Analysis
The data engineering is performed by the core industry experts considering both the Marketing Mix Modeling and the Demand Forecasting. The marketing mix modeling makes use of multiple-regression techniques to predict the optimal mix of marketing variables. Regression factor is based on a number of variables and how they relate to an outcome such as sales or profits.
Data Validation
The data validation is performed by the exhaustive primary research from the expert interviews. This includes telephonic interviews, focus groups, face to face interviews, and questionnaires to validate our research from all aspects. The industry experts we approach come from the leading firms, involved in the supply chain ranging from the suppliers, distributors to the manufacturers and consumers so as to ensure an unbiased analysis.
We are in touch with more than 15,000 industry experts with the right mix of consultants, CEO's, presidents, vice presidents, managers, experts from both supply side and demand side, executives and so on.
The data validation involves the primary research from the industry experts belonging to:
- Leading Companies
- Suppliers & Distributors
- Manufacturers
- Consumers
- Industry/Strategic Consultants
Apart from the data validation the primary research also helps in performing the fill gap research, i.e. providing solutions for the unmet needs of the research which helps in enhancing the reports quality.
For more details about research methodology, kindly write to us at info@strategymrc.com
Frequently Asked Questions
In case of any queries regarding this report, you can contact the customer service by filing the “Inquiry Before Buy” form available on the right hand side. You may also contact us through email: info@strategymrc.com or phone: +1-301-202-5929
Yes, the samples are available for all the published reports. You can request them by filling the “Request Sample” option available in this page.
Yes, you can request a sample with your specific requirements. All the customized samples will be provided as per the requirement with the real data masked.
All our reports are available in Digital PDF format. In case if you require them in any other formats, such as PPT, Excel etc you can submit a request through “Inquiry Before Buy” form available on the right hand side. You may also contact us through email: info@strategymrc.com or phone: +1-301-202-5929
We offer a free 15% customization with every purchase. This requirement can be fulfilled for both pre and post sale. You may send your customization requirements through email at info@strategymrc.com or call us on +1-301-202-5929.
We have 3 different licensing options available in electronic format.
- Single User Licence: Allows one person, typically the buyer, to have access to the ordered product. The ordered product cannot be distributed to anyone else.
- 2-5 User Licence: Allows the ordered product to be shared among a maximum of 5 people within your organisation.
- Corporate License: Allows the product to be shared among all employees of your organisation regardless of their geographical location.
All our reports are typically be emailed to you as an attachment.
To order any available report you need to register on our website. The payment can be made either through CCAvenue or PayPal payments gateways which accept all international cards.
We extend our support to 6 months post sale. A post sale customization is also provided to cover your unmet needs in the report.
Request Customization
We offer complimentary customization of up to 15% with every purchase. To share your customization requirements, feel free to email us at info@strategymrc.com or call us on +1-301-202-5929. .
Please Note: Customization within the 15% threshold is entirely free of charge. If your request exceeds this limit, we will conduct a feasibility assessment. Following that, a detailed quote and timeline will be provided.
WHY CHOOSE US ?

Assured Quality
Best in class reports with high standard of research integrity

24X7 Research Support
Continuous support to ensure the best customer experience.

Free Customization
Adding more values to your product of interest.

Safe & Secure Access
Providing a secured environment for all online transactions.

Trusted by 600+ Brands
Serving the most reputed brands across the world.