
Cold Chain Market
Cold Chain Market Forecasts to 2028 – Global Analysis By Temperature (Chilled, Frozen), Technology (Blast Freezing, Programmable Logic Controller (PLC), Cryogenic Systems) and By Geography

|
Years Covered |
2020-2028 |
|
Estimated Year Value (2021) |
US $252.04 BN |
|
Projected Year Value (2028) |
US $484.93 BN |
|
CAGR (2021 - 2028) |
9.8% |
|
Regions Covered |
North America, Europe, Asia Pacific, South America, and Middle East & Africa |
|
Countries Covered |
US, Canada, Mexico, Germany, UK, Italy, France, Spain, Japan, China, India, Australia, New Zealand, South Korea, Rest of Asia Pacific, South America, Argentina, Brazil, Chile, Middle East & Africa, Saudi Arabia, UAE, Qatar, and South Africa |
|
Largest Market |
North America |
|
Highest Growing Market |
Asia Pacific |
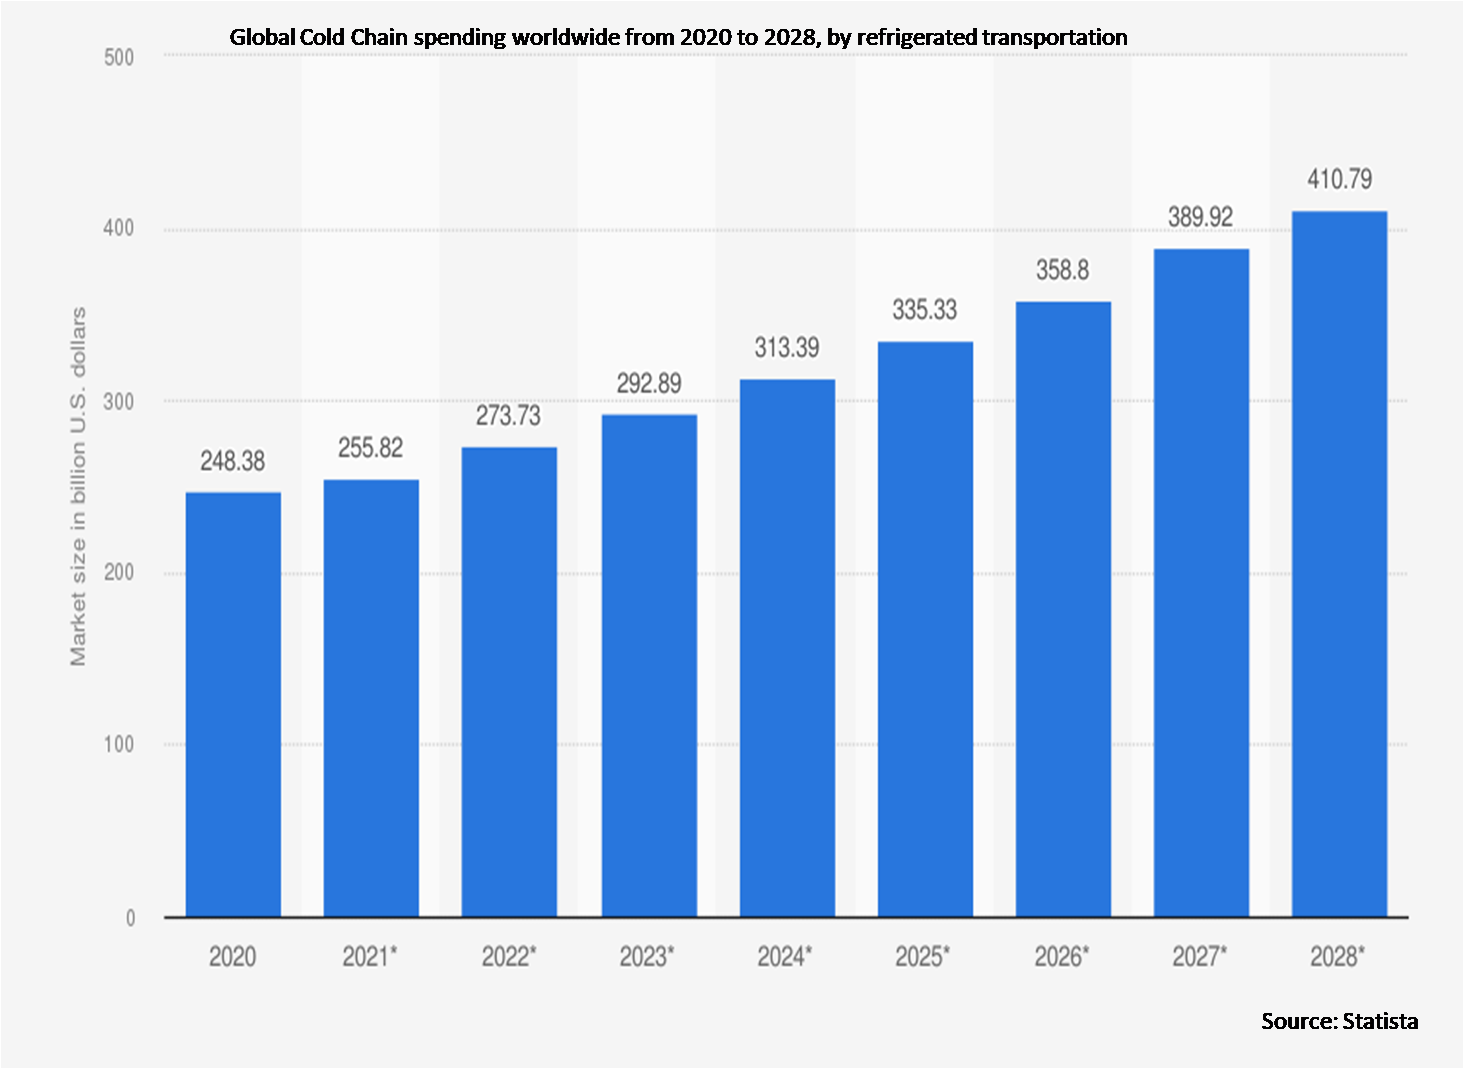
According to Stratistics MRC, the Global Cold Chain Market is accounted for $252.04 billion in 2021 and is expected to reach $484.93 billion by 2028 growing at a CAGR of 9.8% during the forecast period. The cold chain includes logistics planning to maintain the temperature at which perishable food products are stored through refrigeration or thermal packing. This leads to an increase in product life and helps maintain the standard quality of the product for a longer duration. It basically preserves the physical and biochemical properties of frozen and perishable food items. It also regulates the market price of off-season food and prevents product loss by minimizing wastes which eventually leads to higher profits for the manufacturers.
Market Dynamics:
Driver:
Increasing demand for perishable goods
Consumers are getting more aware of health and wellness, as well as the effect that food nutrients, especially protein, have on overall physical and mental growth and development. This has resulted in a change in the consumption pattern of perishable foods, such as dairy products, fruits and vegetables, and high-protein animal-based products. Emerging economies are witnessing a high demand for perishable food products. This can be attributed to the rapid urbanization, changing tastes and preferences, and the rising disposable income of consumers in these countries. The market potential for processed and frozen food products is also high in these countries due to their lower adoption rates. The consumption of ready-to-eat meals, such as frozen pizzas, desserts, and snacks, is rising steadily in these countries.
Restraint:
Concerns regarding greenhouse gas emissions
Cold chain development places a significant burden on the environment since refrigeration is energy-intensive and is a source of greenhouse gases. Keeping products cold throughout the transportation phase of the cold chain accounts for a significant consumption of hydrofluorocarbons (HFCs). Also, diesel-powered transportation refrigeration units consume up to 21% more power than non-refrigerated diesel-powered trucks. This has significant implications on climate change and hence has a negative impact on the growth of the cold chain market.
Opportunity:
Development of retail channels
The development of retail channels and chains in the form of supermarkets, hypermarkets, and convenience stores is a major factor driving the growth of the cold chain market. Also, retail chains have developed to an extent where some of the producers have their own in-house refrigerated warehousing facilities. Large food retail chains such as Walmart, Tesco, Spar, and 7-Eleven are expanding their outlets in developed countries and in emerging markets. The emergence of such large retailers and their expanding operations in international trade are creating growth opportunities for the refrigerated warehousing and refrigerated transportation market.
Threat:
Lack of appropriate infrastructure in developing economies
Cold chain service providers in developing economies do not have the resources or the technology required to build high-quality cold chain facilities. Lack of proper food storage, processing, and cold chain logistics, together with weak organization and implementation of controls for compliance with standards, remains a serious challenge in these countries. From procurement to delivery at retail, service providers face many challenges in a cold chain network. Countries in Asia Pacific and South America lack efficient transport infrastructure and are not well connected. The missing links in these networks continue to constrain route choice, while insufficient capacity and the poor quality of infrastructure add costs and time to the transit. The cold chain systems in these markets are not integrated and compatible for use for multiple perishable commodities, which poses a major challenge to market growth.
The frozen segment is expected to be the largest during the forecast period
Companies indulge in the freezing of the food products to enhance the shelf-life of the foods for making them inert. The freezing process slows down the biological and chemical reactions that promote the spoilage of the food. Frozen food locks in the nutrients in the food, making it more attractive than chilled foods. With the need for convenience, the demand for frozen products is growing among consumers. The increased demand for frozen foods is due to its consistent availability throughout the year in supermarkets, hypermarkets, and convenience stores.
The refrigerated transportation segment is expected to have the highest CAGR during the forecast period
Cold chain systems are crucial for supplying food, beverages, and healthcare products. Demand for high-cube refrigerated trailers, connected refrigerated trucks, insulated containers, and vehicles favoring cross-product transportation is expected to drive the transportation segment over the forecast period.
Region with largest share:
North America is projected to hold the largest market share owing to the significant growth opportunities for the companies planning to invest for a long haul. Increasing penetration of connected devices and a large consumer base are also expected to fuel market growth over the forecast period. The growth in demand of frozen chilled and frozen foods in western counties triggered the cold chain market in North America. Increasing demand of daily products, vegetables and fruits heading towards more export form one reason to another.
Region with highest CAGR:
Asia Pacific is projected to have the highest CAGR due to the economic developments of countries such as China, India, Japan, and Australia. The shift of industrialization and investments in Asia Pacific has grown substantially over the past decade, especially in China and India, contributing to rapid economic growth. Countries such as India, Japan, China, and South Korea have a strong demand for dairy and meat products, which has led to the strong demand for preserving the quality and nutritive element in the products, which drive the market for cold chain in the region. China is the major contributor to the Asia Pacific regional market. The market growth in China is attributed to factors, such as technological advancements in packaging, processing, and storage of seafood products. Rising demand and growing cold chain infrastructure development have made China a top market for cold chains. Currently, China is undergoing a rapid transition from a construction- & manufacturing-led economy to a consumer-led economy. Rising innovations in the pharmaceutical sector in China are also expected to boost the demand for cold chain solutions.

Key players in the market
Some of the key players profiled in the Cold Chain Market include Sonoco ThermoSafe, Agro Merchant Group, Cryopak Industries Inc., Hanson Logistics, Nordic Logistics, VersaCold, Logistics Services, Lineage Logistics, LLC, Americold Logistics LLC, Valor Industries, Cold Box Express, Inc, Burris Logistics, Inc., Softbox Systems Ltd, Cloverleaf Cold Storage, Wabash National, Swire Group, and Sofrigam .
Key developments:
In April 2020: Agro Merchants Group expanded its operations by adding more refrigerated storage space at its Nashville facility. This decision was taken to accommodate the increasing demand. The new storage facility will be maintained between 32 °F and 38 °F. It will enhance the focus on the storage and handling of frozen foods.
In January 2020: Americold Logistics acquired Nova Cold Logistics (Canada), as Nova Cold Logistics is an owner and operator of three temperature-controlled storage facilities in Canada. This decision will help in expanding the company’s position in Canada. Canada is a growing market with fragmented ownership of cold storage facilities.
In November 2019: Lineage Logistics signed a definitive agreement to acquire Emergent Cold (US). This acquisition will enable the company to strengthen its port presence in the US. Also, with this acquisition, Lineage Logistics will be able to enter into Australian, New Zealand, and Sri Lankan temperature-controlled logistics markets.
In June 2019: Hanson Logistics launched a new consumer e-commerce fulfilment program titled Pick, Pack, and Parcel. The company identified the growing demand for home delivery of groceries, including frozen and refrigerated foods, and started the new service. This will help food manufacturers to keep up with the market demand.
In January 2018: VersaCold Logistics Services entered into a definitive agreement to acquire Coastal Pacific Xpress (CPX) (Canada). CPX specializes in the shipping of perishable and ambient products throughout Canada and the US.
Temperatures Covered:
• Chilled
• Frozen
Types Covered:
• Monitoring Components
• Refrigerated Storage
• Refrigerated Transportation
Products Covered:
• Crates
• Insulated Containers & Boxes
• Labels
• Cold Packs
• Payload
• Temperature Controlled Pallet Shippers
• Corrugated Boxes
• Cold Chain Bags/Vaccine Bags
• Cryogenic Tanks
• Insulating Pouches
• Active Thermal Systems
• Hard Cased Thermal Boxes
Refrigerants Covered:
• Hydrocarbons
• Fluorocarbons
• Inorganics
Insulating Materials Covered:
• Vacuum Insulation Panels (VIP)
• Expanded Polystyrene Insulation (EPS)
• Poly Urethane Rigid Foam (PUR)
Technologies Covered:
• Blast Freezing
• Programmable Logic Controller (PLC)
• Cryogenic Systems
• Vapor Compression Systems
• Evaporating Cooling
• Eutectic Devices
• Air Blown Evaporators
Applications Covered:
• Food & Beverages
• Chemicals
• Healthcare/Pharmaceuticals
Regions Covered:
• North America
o US
o Canada
o Mexico
• Europe
o Germany
o UK
o Italy
o France
o Spain
o Rest of Europe
• Asia Pacific
o Japan
o China
o India
o Australia
o New Zealand
o South Korea
o Rest of Asia Pacific
• South America
o Argentina
o Brazil
o Chile
o Rest of South America
• Middle East & Africa
o Saudi Arabia
o UAE
o Qatar
o South Africa
o Rest of Middle East & Africa
What our report offers:
- Market share assessments for the regional and country-level segments
- Strategic recommendations for the new entrants
- Covers Market data for the years 2020, 2021, 2022, 2025, and 2028
- Market Trends (Drivers, Constraints, Opportunities, Threats, Challenges, Investment Opportunities, and recommendations)
- Strategic recommendations in key business segments based on the market estimations
- Competitive landscaping mapping the key common trends
- Company profiling with detailed strategies, financials, and recent developments
- Supply chain trends mapping the latest technological advancements
Free Customization Offerings:
All the customers of this report will be entitled to receive one of the following free customization options:
• Company Profiling
o Comprehensive profiling of additional market players (up to 3)
o SWOT Analysis of key players (up to 3)
• Regional Segmentation
o Market estimations, Forecasts and CAGR of any prominent country as per the client's interest (Note: Depends on feasibility check)
• Competitive Benchmarking
o Benchmarking of key players based on product portfolio, geographical presence, and strategic alliances
Table of Contents
1 Executive Summary
2 Preface
2.1 Abstract
2.2 Stake Holders
2.3 Research Scope
2.4 Research Methodology
2.4.1 Data Mining
2.4.2 Data Analysis
2.4.3 Data Validation
2.4.4 Research Approach
2.5 Research Sources
2.5.1 Primary Research Sources
2.5.2 Secondary Research Sources
2.5.3 Assumptions
3 Market Trend Analysis
3.1 Introduction
3.2 Drivers
3.3 Restraints
3.4 Opportunities
3.5 Threats
3.6 Product Analysis
3.7 Technology Analysis
3.8 Application Analysis
3.9 Emerging Markets
3.10 Impact of Covid-19
4 Porters Five Force Analysis
4.1 Bargaining power of suppliers
4.2 Bargaining power of buyers
4.3 Threat of substitutes
4.4 Threat of new entrants
4.5 Competitive rivalry
5 Global Cold Chain Market, By Temperature
5.1 Introduction
5.2 Chilled
5.3 Frozen
6 Global Cold Chain Market, By Type
6.1 Introduction
6.2 Monitoring Components
6.2.1 Hardware
6.2.1.1 Radio Frequency Identification Decices (RFID)
6.2.1.2 Sensors
6.2.1.3 Networking Devices
6.2.1.4 Telematics
6.2.2 Software
6.2.2.1 On-Premise
6.2.2.2 Cloud-Based
6.3 Refrigerated Storage
6.3.1 Refrigerated Containers
6.3.2 Warehouses
6.3.2.1 On-Grid
6.3.2.1.1 Walk-In Freezers
6.3.2.1.2 Walk-In Coolers
6.3.2.1.3 Deep Freezers
6.3.2.1.4 Ice-Lined Refrigerators
6.3.2.2 Off-Grid
6.3.2.2.1 Solar Powered Cold Boxes
6.3.2.2.2 Milk Coolers
6.3.2.2.3 Solar Chillers
6.3.2.2.4 Transportation Equipment
6.4 Refrigerated Transportation
6.4.1 Marine Transport
6.4.2 Rail Transport
6.4.3 Air Transport
6.4.4 Road Transport
6.4.4.1 Refrigerated Light Commercial Vehicles (Van)
6.4.4.2 Refrigerated Medium & Heavy Commercial Vehicles
6.4.4.2.1 Trucks
6.4.4.2.2 Trailers & Semi-trailers
7 Global Cold Chain Market, By Product
7.1 Introduction
7.2 Crates
7.2.1 Horticulture
7.2.2 Fishery
7.2.3 Dairy
7.3 Insulated Containers & Boxes
7.4 Labels
7.5 Cold Packs
7.6 Payload
7.6.1 Large (32 to 66 Liters)
7.6.2 Medium (21 to 29 Liters)
7.6.3 Small (10 to 17 Liters)
7.6.4 X-Small (3 to 8 Liters)
7.6.5 Petite (0.9 to 2.7 Liters)
7.7 Temperature Controlled Pallet Shippers
7.8 Corrugated Boxes
7.9 Cold Chain Bags/Vaccine Bags
7.10 Cryogenic Tanks
7.11 Insulating Pouches
7.12 Active Thermal Systems
7.13 Hard Cased Thermal Boxes
8 Global Cold Chain Market, By Refrigerant
8.1 Introduction
8.2 Hydrocarbons
8.3 Fluorocarbons
8.4 Inorganics
8.4.1 Carbondioxide
8.4.2 Ammonia
9 Global Cold Chain Market, By Insulating Material
9.1 Introduction
9.2 Vacuum Insulation Panels (VIP)
9.3 Expanded Polystyrene Insulation (EPS)
9.4 Poly Urethane Rigid Foam (PUR)
10 Global Cold Chain Market, By Technology
10.1 Introduction
10.2 Blast Freezing
10.3 Programmable Logic Controller (PLC)
10.4 Cryogenic Systems
10.5 Vapor Compression Systems
10.6 Evaporating Cooling
10.7 Eutectic Devices
10.8 Air Blown Evaporators
11 Global Cold Chain Market, By Application
11.1 Introduction
11.2 Food & Beverages
11.2.1 Dairy and Frozen Dessert
11.2.1.1 Milk
11.2.1.2 Butter
11.2.1.3 Cheese
11.2.1.4 Ice Cream
11.2.2 Bakery and Confectionery
11.2.3 Fruits and Vegetables
11.2.4 Fish, Poultry, Meat, and Seafood
11.2.5 Processed Food
11.2.6 Fruit Pulp & Concentrates
11.2.7 Ready-To-Eat Meals
11.2.8 Ready-To-Cook Foods
11.2.9 Sauces, Condiments, Salad Dressings, and Dips
11.3 Chemicals
11.4 Healthcare/Pharmaceuticals
11.4.1 Vaccines
11.4.2 Blood Banking
12 Global Cold Chain Market, By Geography
12.1 Introduction
12.2 North America
12.2.1 US
12.2.2 Canada
12.2.3 Mexico
12.3 Europe
12.3.1 Germany
12.3.2 UK
12.3.3 Italy
12.3.4 France
12.3.5 Spain
12.3.6 Rest of Europe
12.4 Asia Pacific
12.4.1 Japan
12.4.2 China
12.4.3 India
12.4.4 Australia
12.4.5 New Zealand
12.4.6 South Korea
12.4.7 Rest of Asia Pacific
12.5 South America
12.5.1 Argentina
12.5.2 Brazil
12.5.3 Chile
12.5.4 Rest of South America
12.6 Middle East & Africa
12.6.1 Saudi Arabia
12.6.2 UAE
12.6.3 Qatar
12.6.4 South Africa
12.6.5 Rest of Middle East & Africa
13 Key Developments
13.1 Agreements, Partnerships, Collaborations and Joint Ventures
13.2 Acquisitions & Mergers
13.3 New Product Launch
13.4 Expansions
13.5 Other Key Strategies
14 Company Profiling
14.1 Sonoco ThermoSafe
14.2 Agro Merchant Group
14.3 Cryopak Industries Inc.
14.4 Hanson Logistics
14.5 Nordic Logistics
14.6 VersaCold Logistics Services
14.7 Lineage Logistics, LLC
14.8 Americold Logistics LLC
14.9 Valor Industries
14.10 Cold Box Express, Inc
14.11 Burris Logistics, Inc.
14.12 Softbox Systems Ltd
14.13 Cloverleaf Cold Storage
14.14 Wabash National
14.15 Swire Group
14.16 Sofrigam
List of Tables
1 Global Cold Chain Market Outlook, By Region (2020-2028) ($MN)
2 Global Cold Chain Market Outlook, By Temperature (2020-2028) ($MN)
3 Global Cold Chain Market Outlook, By Chilled (2020-2028) ($MN)
4 Global Cold Chain Market Outlook, By Frozen (2020-2028) ($MN)
5 Global Cold Chain Market Outlook, By Type (2020-2028) ($MN)
6 Global Cold Chain Market Outlook, By Monitoring Components (2020-2028) ($MN)
7 Global Cold Chain Market Outlook, By Hardware (2020-2028) ($MN)
8 Global Cold Chain Market Outlook, By Software (2020-2028) ($MN)
9 Global Cold Chain Market Outlook, By Refrigerated Storage (2020-2028) ($MN)
10 Global Cold Chain Market Outlook, By Refrigerated Containers (2020-2028) ($MN)
11 Global Cold Chain Market Outlook, By Warehouses (2020-2028) ($MN)
12 Global Cold Chain Market Outlook, By Refrigerated Transportation (2020-2028) ($MN)
13 Global Cold Chain Market Outlook, By Marine Transport (2020-2028) ($MN)
14 Global Cold Chain Market Outlook, By Rail Transport (2020-2028) ($MN)
15 Global Cold Chain Market Outlook, By Air Transport (2020-2028) ($MN)
16 Global Cold Chain Market Outlook, By Road Transport (2020-2028) ($MN)
17 Global Cold Chain Market Outlook, By Product (2020-2028) ($MN)
18 Global Cold Chain Market Outlook, By Crates (2020-2028) ($MN)
19 Global Cold Chain Market Outlook, By Horticulture (2020-2028) ($MN)
20 Global Cold Chain Market Outlook, By Fishery (2020-2028) ($MN)
21 Global Cold Chain Market Outlook, By Dairy (2020-2028) ($MN)
22 Global Cold Chain Market Outlook, By Insulated Containers & Boxes (2020-2028) ($MN)
23 Global Cold Chain Market Outlook, By Labels (2020-2028) ($MN)
24 Global Cold Chain Market Outlook, By Cold Packs (2020-2028) ($MN)
25 Global Cold Chain Market Outlook, By Payload (2020-2028) ($MN)
26 Global Cold Chain Market Outlook, By Large (32 to 66 Liters) (2020-2028) ($MN)
27 Global Cold Chain Market Outlook, By Medium (21 to 29 Liters) (2020-2028) ($MN)
28 Global Cold Chain Market Outlook, By Small (10 to 17 Liters) (2020-2028) ($MN)
29 Global Cold Chain Market Outlook, By X-Small (3 to 8 Liters) (2020-2028) ($MN)
30 Global Cold Chain Market Outlook, By Petite (0.9 to 2.7 Liters) (2020-2028) ($MN)
31 Global Cold Chain Market Outlook, By Temperature Controlled Pallet Shippers (2020-2028) ($MN)
32 Global Cold Chain Market Outlook, By Corrugated Boxes (2020-2028) ($MN)
33 Global Cold Chain Market Outlook, By Cold Chain Bags/Vaccine Bags (2020-2028) ($MN)
34 Global Cold Chain Market Outlook, By Cryogenic Tanks (2020-2028) ($MN)
35 Global Cold Chain Market Outlook, By Insulating Pouches (2020-2028) ($MN)
36 Global Cold Chain Market Outlook, By Active Thermal Systems (2020-2028) ($MN)
37 Global Cold Chain Market Outlook, By Hard Cased Thermal Boxes (2020-2028) ($MN)
38 Global Cold Chain Market Outlook, By Refrigerant (2020-2028) ($MN)
39 Global Cold Chain Market Outlook, By Hydrocarbons (2020-2028) ($MN)
40 Global Cold Chain Market Outlook, By Fluorocarbons (2020-2028) ($MN)
41 Global Cold Chain Market Outlook, By Inorganics (2020-2028) ($MN)
42 Global Cold Chain Market Outlook, By Carbondioxide (2020-2028) ($MN)
43 Global Cold Chain Market Outlook, By Ammonia (2020-2028) ($MN)
44 Global Cold Chain Market Outlook, By Insulating Material (2020-2028) ($MN)
45 Global Cold Chain Market Outlook, By Vacuum Insulation Panels (VIP) (2020-2028) ($MN)
46 Global Cold Chain Market Outlook, By Expanded Polystyrene Insulation (EPS) (2020-2028) ($MN)
47 Global Cold Chain Market Outlook, By Poly Urethane Rigid Foam (PUR) (2020-2028) ($MN)
48 Global Cold Chain Market Outlook, By Technology (2020-2028) ($MN)
49 Global Cold Chain Market Outlook, By Blast Freezing (2020-2028) ($MN)
50 Global Cold Chain Market Outlook, By Programmable Logic Controller (PLC) (2020-2028) ($MN)
51 Global Cold Chain Market Outlook, By Cryogenic Systems (2020-2028) ($MN)
52 Global Cold Chain Market Outlook, By Vapor Compression Systems (2020-2028) ($MN)
53 Global Cold Chain Market Outlook, By Evaporating Cooling (2020-2028) ($MN)
54 Global Cold Chain Market Outlook, By Eutectic Devices (2020-2028) ($MN)
55 Global Cold Chain Market Outlook, By Air Blown Evaporators (2020-2028) ($MN)
56 Global Cold Chain Market Outlook, By Application (2020-2028) ($MN)
57 Global Cold Chain Market Outlook, By Food & Beverages (2020-2028) ($MN)
58 Global Cold Chain Market Outlook, By Dairy and Frozen Dessert (2020-2028) ($MN)
59 Global Cold Chain Market Outlook, By Bakery and Confectionery (2020-2028) ($MN)
60 Global Cold Chain Market Outlook, By Fruits and Vegetables (2020-2028) ($MN)
61 Global Cold Chain Market Outlook, By Fish, Poultry, Meat, and Seafood (2020-2028) ($MN)
62 Global Cold Chain Market Outlook, By Processed Food (2020-2028) ($MN)
63 Global Cold Chain Market Outlook, By Fruit Pulp & Concentrates (2020-2028) ($MN)
64 Global Cold Chain Market Outlook, By Ready-To-Eat Meals (2020-2028) ($MN)
65 Global Cold Chain Market Outlook, By Ready-To-Cook Foods (2020-2028) ($MN)
66 Global Cold Chain Market Outlook, By Sauces, Condiments, Salad Dressings, and Dips (2020-2028) ($MN)
67 Global Cold Chain Market Outlook, By Chemicals (2020-2028) ($MN)
68 Global Cold Chain Market Outlook, By Healthcare/Pharmaceuticals (2020-2028) ($MN)
69 Global Cold Chain Market Outlook, By Vaccines (2020-2028) ($MN)
70 Global Cold Chain Market Outlook, By Blood Banking (2020-2028) ($MN)
Note: Tables for North America, Europe, APAC, South America, and Middle East & Africa Regions are also represented in the same manner as above.
List of Figures
RESEARCH METHODOLOGY

We at ‘Stratistics’ opt for an extensive research approach which involves data mining, data validation, and data analysis. The various research sources include in-house repository, secondary research, competitor’s sources, social media research, client internal data, and primary research.
Our team of analysts prefers the most reliable and authenticated data sources in order to perform the comprehensive literature search. With access to most of the authenticated data bases our team highly considers the best mix of information through various sources to obtain extensive and accurate analysis.
Each report takes an average time of a month and a team of 4 industry analysts. The time may vary depending on the scope and data availability of the desired market report. The various parameters used in the market assessment are standardized in order to enhance the data accuracy.
Data Mining
The data is collected from several authenticated, reliable, paid and unpaid sources and is filtered depending on the scope & objective of the research. Our reports repository acts as an added advantage in this procedure. Data gathering from the raw material suppliers, distributors and the manufacturers is performed on a regular basis, this helps in the comprehensive understanding of the products value chain. Apart from the above mentioned sources the data is also collected from the industry consultants to ensure the objective of the study is in the right direction.
Market trends such as technological advancements, regulatory affairs, market dynamics (Drivers, Restraints, Opportunities and Challenges) are obtained from scientific journals, market related national & international associations and organizations.
Data Analysis
From the data that is collected depending on the scope & objective of the research the data is subjected for the analysis. The critical steps that we follow for the data analysis include:
- Product Lifecycle Analysis
- Competitor analysis
- Risk analysis
- Porters Analysis
- PESTEL Analysis
- SWOT Analysis
The data engineering is performed by the core industry experts considering both the Marketing Mix Modeling and the Demand Forecasting. The marketing mix modeling makes use of multiple-regression techniques to predict the optimal mix of marketing variables. Regression factor is based on a number of variables and how they relate to an outcome such as sales or profits.
Data Validation
The data validation is performed by the exhaustive primary research from the expert interviews. This includes telephonic interviews, focus groups, face to face interviews, and questionnaires to validate our research from all aspects. The industry experts we approach come from the leading firms, involved in the supply chain ranging from the suppliers, distributors to the manufacturers and consumers so as to ensure an unbiased analysis.
We are in touch with more than 15,000 industry experts with the right mix of consultants, CEO's, presidents, vice presidents, managers, experts from both supply side and demand side, executives and so on.
The data validation involves the primary research from the industry experts belonging to:
- Leading Companies
- Suppliers & Distributors
- Manufacturers
- Consumers
- Industry/Strategic Consultants
Apart from the data validation the primary research also helps in performing the fill gap research, i.e. providing solutions for the unmet needs of the research which helps in enhancing the reports quality.
For more details about research methodology, kindly write to us at info@strategymrc.com
Frequently Asked Questions
In case of any queries regarding this report, you can contact the customer service by filing the “Inquiry Before Buy” form available on the right hand side. You may also contact us through email: info@strategymrc.com or phone: +1-301-202-5929
Yes, the samples are available for all the published reports. You can request them by filling the “Request Sample” option available in this page.
Yes, you can request a sample with your specific requirements. All the customized samples will be provided as per the requirement with the real data masked.
All our reports are available in Digital PDF format. In case if you require them in any other formats, such as PPT, Excel etc you can submit a request through “Inquiry Before Buy” form available on the right hand side. You may also contact us through email: info@strategymrc.com or phone: +1-301-202-5929
We offer a free 15% customization with every purchase. This requirement can be fulfilled for both pre and post sale. You may send your customization requirements through email at info@strategymrc.com or call us on +1-301-202-5929.
We have 3 different licensing options available in electronic format.
- Single User Licence: Allows one person, typically the buyer, to have access to the ordered product. The ordered product cannot be distributed to anyone else.
- 2-5 User Licence: Allows the ordered product to be shared among a maximum of 5 people within your organisation.
- Corporate License: Allows the product to be shared among all employees of your organisation regardless of their geographical location.
All our reports are typically be emailed to you as an attachment.
To order any available report you need to register on our website. The payment can be made either through CCAvenue or PayPal payments gateways which accept all international cards.
We extend our support to 6 months post sale. A post sale customization is also provided to cover your unmet needs in the report.
Request Customization
We offer complimentary customization of up to 15% with every purchase. To share your customization requirements, feel free to email us at info@strategymrc.com or call us on +1-301-202-5929. .
Please Note: Customization within the 15% threshold is entirely free of charge. If your request exceeds this limit, we will conduct a feasibility assessment. Following that, a detailed quote and timeline will be provided.
WHY CHOOSE US ?

Assured Quality
Best in class reports with high standard of research integrity

24X7 Research Support
Continuous support to ensure the best customer experience.

Free Customization
Adding more values to your product of interest.

Safe & Secure Access
Providing a secured environment for all online transactions.

Trusted by 600+ Brands
Serving the most reputed brands across the world.