
Copper Interconnect Materials Market
Copper Interconnect Materials Market Forecasts to 2034 - Global Analysis By Type (Lead Frame Plating Solutions, Packaging Plating Solutions and Advanced/Niche Copper Plating Solutions), Technology, End User and By Geography

|
Years Covered |
2023-2034 |
|
Estimated Year Value (2026) |
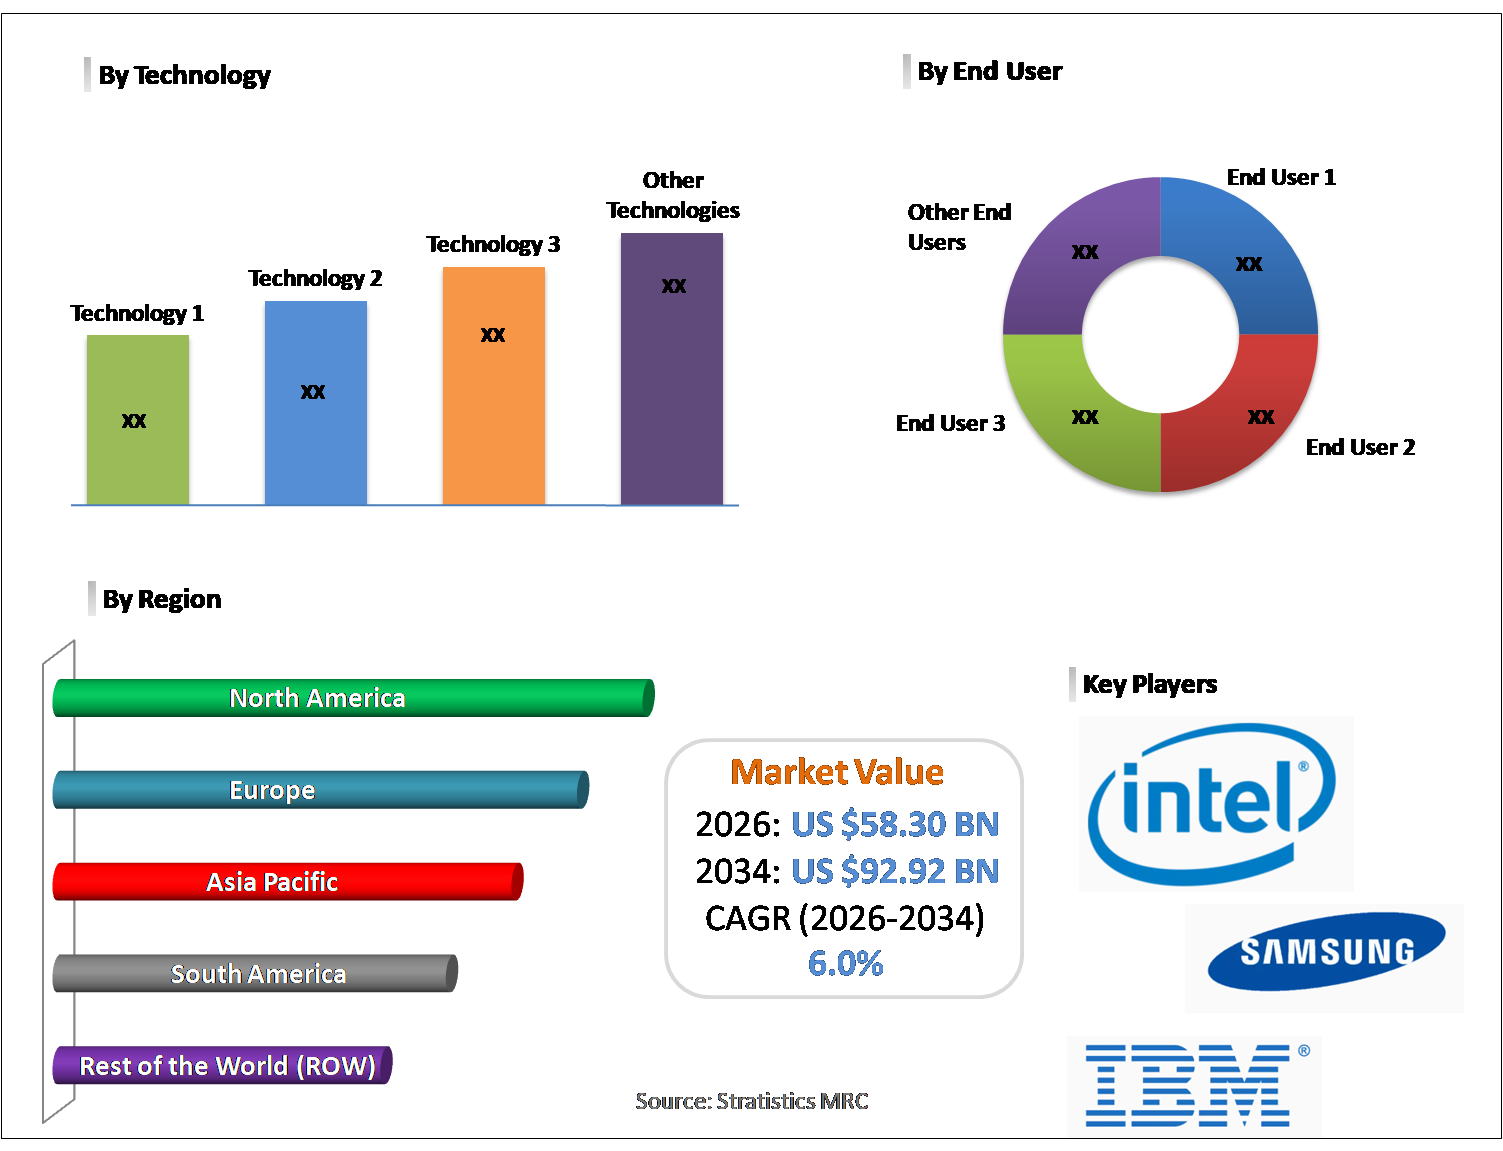
US $58.30 BN |
|
Projected Year Value (2034) |
US $92.92 BN |
|
CAGR (2026-2034) |
6.0% |
|
Regions Covered |
North America, Europe, Asia Pacific, South America, and Rest of the World (RoW) |
|
Countries Covered |
United States, Canada, Mexico, United Kingdom, Germany, France, Italy, Spain, Netherlands, Belgium, Sweden, Switzerland, Poland, Rest of Europe, China, Japan, India, South Korea, Australia, Indonesia, Thailand, Malaysia, Singapore, Vietnam, Rest of Asia Pacific, Brazil, Argentina, Colombia, Chile, Peru, Rest of South America, Saudi Arabia, United Arab Emirates, Qatar, Israel, Rest of Middle East, South Africa, Egypt, Morocco, and Rest of Africa. |
|
Largest Market |
Asia Pacific |
|
Highest Growing Market |
North America |
According to Stratistics MRC, the Global Copper Interconnect Materials Market is accounted for $58.30 billion in 2026 and is expected to reach $92.92 billion by 2034 growing at a CAGR of 6.0% during the forecast period. Copper interconnect materials play a crucial role in modern semiconductor fabrication by forming conductive pathways between various elements of integrated circuits. Their superior conductivity and strong resistance to electromigration make them more effective than traditional aluminum wiring, enabling quicker data transfer and better overall chip efficiency. Implementation involves sophisticated processes such as electrochemical deposition, supported by protective barrier and liner layers that restrict copper diffusion. With continuous miniaturization of electronic components, copper interconnects help maintain performance while lowering power usage. Current advancements aim to improve durability, reduce RC delays, and ensure seamless integration with advanced semiconductor technologies.
According to IEEE and semiconductor fabrication literature: Copper interconnects remain the dominant material in advanced semiconductor nodes due to their low resistivity (~1.7 μΩ•cm) and superior electromigration resistance compared to aluminum. This makes copper essential for logic and memory scaling in high-performance chips.
Market Dynamics:
Driver:
Rising demand for advanced semiconductor devices
Expanding demand for high-performance semiconductor components significantly fuels the copper interconnect materials market. The rapid proliferation of smart devices, cloud infrastructure, artificial intelligence systems, and advanced computing platforms increases the requirement for reliable and high-speed chips. Copper’s excellent conductivity and reduced electrical resistance enhance data transfer speeds and operational efficiency in integrated circuits. With ongoing miniaturization and the transition toward advanced fabrication nodes, copper interconnects help maintain signal integrity while lowering energy usage. Technological progress in electronics production and rising consumer expectations for faster devices continue to strengthen the need for advanced conductive interconnection materials globally.
Restraint:
High manufacturing complexity and integration challenges
One major restraint in the copper interconnect materials market is the intricate fabrication process and associated technical hurdles. Copper integration involves sophisticated plating, polishing, and deposition techniques that raise operational costs and manufacturing complexity. Its tendency to migrate into adjacent insulating layers requires protective barriers, adding further design and processing challenges. With continuous miniaturization of semiconductor nodes, ensuring consistency and long-term reliability becomes increasingly demanding. These requirements call for significant financial investment and advanced technological capabilities. Companies lacking sufficient resources or expertise may face adoption difficulties, which can hinder broader market expansion across developing semiconductor ecosystems.
Opportunity:
Expansion of advanced packaging technologies
The development of next-generation semiconductor packaging solutions creates strong growth prospects for the copper interconnect materials market. Emerging approaches such as multi-die stacking, chiplet integration and system-level packaging require efficient conductive pathways for optimal performance. Copper’s superior electrical and thermal characteristics support dense interconnections within compact structures. Rising demand for powerful yet space-efficient electronics encourages adoption of advanced packaging techniques. As chip designers focus on improved integration and functionality, the importance of dependable copper interconnect materials increases. This ongoing transformation in packaging technology offers substantial opportunities for expanded utilization in sophisticated semiconductor assemblies.
Threat:
Intensifying competition from alternative conductive materials
The growing availability of new interconnect technologies represents a considerable threat to the copper interconnect materials market. Materials like cobalt, ruthenium, and innovative carbon solutions are being explored to overcome challenges linked to extreme miniaturization. At advanced process nodes, copper may experience higher resistance and reliability concerns, reducing its relative efficiency. Should these alternatives prove more effective in performance, durability, and cost optimization, semiconductor manufacturers could adopt them in place of copper. Increased research focus and pilot deployments of substitute materials may gradually weaken copper’s market position in future semiconductor fabrication environments.
Covid-19 Impact:
The outbreak of COVID-19 produced both challenges and growth opportunities for the copper interconnect materials market. Early in the crisis, restrictions on movement, workforce limitations, and global logistics interruptions hindered semiconductor production and disrupted copper supply chains. Fabrication plant slowdowns temporarily reduced material consumption. Nevertheless, rising dependence on digital technologies, remote connectivity, and cloud services boosted demand for electronic devices and data processing systems. This shift increased semiconductor output in subsequent phases. As global conditions stabilized, renewed investments in chip fabrication and supply chain resilience contributed to market recovery, reinforcing long-term prospects for copper interconnect materials.
The lead frame plating solutions segment is expected to be the largest during the forecast period
The lead frame plating solutions segment is expected to account for the largest market share during the forecast period, primarily because of their broad application in semiconductor packaging. Lead frames form the foundational structure of many electronic components, enabling stable electrical connections and mechanical integrity. Copper plating improves electrical performance, durability, and resistance to environmental factors, supporting large-scale production requirements. Continuous demand from consumer electronics, automotive electronics, and industrial equipment reinforces their strong market presence. Their economic feasibility and seamless integration with conventional manufacturing techniques further strengthen their leading position within semiconductor packaging processes worldwide.
The electroplating segment is expected to have the highest CAGR during the forecast period
Over the forecast period, the electroplating segment is predicted to witness the highest growth rate because of its effectiveness in modern semiconductor manufacturing. The technique provides precise and consistent copper deposition, which is essential for complex, high-density interconnects architectures. With ongoing miniaturization, electroplating ensures reliable filling of fine features while maintaining strong electrical performance. Its scalability and economic efficiency make it favorable for mass production environments. Increasing requirements for advanced processors in computing, communication, and automotive electronics continue to boost the demand for electroplating technologies across semiconductor fabrication facilities.
Region with largest share:
During the forecast period, the Asia Pacific region is expected to hold the largest market share, supported by its extensive semiconductor fabrication and electronics manufacturing base. The region accommodates numerous wafer fabs, assembly facilities, and chip producers that rely heavily on copper-based interconnection solutions. Ongoing infrastructure expansion, policy incentives, and strategic investments in advanced manufacturing technologies enhance regional growth. Strong demand for smart phones, automotive electronics, and networking equipment further drives material consumption. A mature supply chain network combined with efficient production capabilities ensures sustained market leadership, positioning Asia-Pacific as the dominant regional contributor within the global copper interconnect materials industry.
Region with highest CAGR:
Over the forecast period, the North America region is anticipated to exhibit the highest CAGR, supported by expanding semiconductor production and strong policy backing. Significant investments in new fabrication plants and advanced manufacturing technologies are boosting regional capabilities. Growing requirements for AI-driven systems, cloud computing platforms, and next-generation processors increase demand for efficient copper interconnection materials. The region’s strong research ecosystem and technological leadership foster innovation in chip development. Initiatives aimed at securing supply chains and promoting local production further enhance growth momentum, positioning North America as the fastest-growing regional market.

Key players in the market
Some of the key players in Copper Interconnect Materials Market include Intel, Samsung, TSMC, GlobalFoundries, Applied Materials, Lam Research, JSR Corporation, Merck, Dow Chemical, IBM, ASE Group, SK Hynix, Micron, Tokyo Electron, KLA Corporation, MacDermid Alpha, JX Advanced Metals and Amkor Technology.
Key Developments:
In November 2025, IBM and Atruvia AG have sealed a long-term collaboration that paves the way for sustainable and state-of-the-art IT platforms for the banking of tomorrow. Atruvia will use IBM z17, which was announced earlier this year, as a cornerstone supports its mission critical operations including the core banking system.
In October 2025, Dow and MEGlobal have finalized an agreement for Dow to supply an additional equivalent to 100 KTA of ethylene from its Gulf Coast operations. The ethylene will serve as a key feedstock for MEGlobal’s ethylene glycol (EG) manufacturing facility co-located at Dow’s and MEGlobal’s Oyster Creek site.
In May 2025, Samsung Electronics announced that it has signed an agreement to acquire all shares of FläktGroup, a leading global HVAC solutions provider, for €1.5 billion from European investment firm Triton. With the global applied HVAC market experiencing rapid growth, the acquisition reinforces Samsung’s commitment to expanding and strengthening its HVAC business.
Types Covered:
• Lead Frame Plating Solutions
• Packaging Plating Solutions
• Advanced/Niche Copper Plating Solutions
Technologies Covered:
• Physical Vapor Deposition (PVD)
• Chemical Vapor Deposition (CVD)
• Electroplating
• Sputtering
End Users Covered:
• Semiconductor Foundries & IDMs
• Automotive Electronics
• Consumer Electronics
• Industrial Electronics
Regions Covered:
• North America
o United States
o Canada
o Mexico
• Europe
o United Kingdom
o Germany
o France
o Italy
o Spain
o Netherlands
o Belgium
o Sweden
o Switzerland
o Poland
o Rest of Europe
• Asia Pacific
o China
o Japan
o India
o South Korea
o Australia
o Indonesia
o Thailand
o Malaysia
o Singapore
o Vietnam
o Rest of Asia Pacific
• South America
o Brazil
o Argentina
o Colombia
o Chile
o Peru
o Rest of South America
• Rest of the World (RoW)
o Middle East
§ Saudi Arabia
§ United Arab Emirates
§ Qatar
§ Israel
§ Rest of Middle East
o Africa
§ South Africa
§ Egypt
§ Morocco
§ Rest of Africa
What our report offers:
- Market share assessments for the regional and country-level segments
- Strategic recommendations for the new entrants
- Covers Market data for the years 2023, 2024, 2025, 2026, 2027, 2028, 2030, 2032 and 2034
- Market Trends (Drivers, Constraints, Opportunities, Threats, Challenges, Investment Opportunities, and recommendations)
- Strategic recommendations in key business segments based on the market estimations
- Competitive landscaping mapping the key common trends
- Company profiling with detailed strategies, financials, and recent developments
- Supply chain trends mapping the latest technological advancements
Free Customization Offerings:
All the customers of this report will be entitled to receive one of the following free customization options:
• Company Profiling
o Comprehensive profiling of additional market players (up to 3)
o SWOT Analysis of key players (up to 3)
• Regional Segmentation
o Market estimations, Forecasts and CAGR of any prominent country as per the client's interest (Note: Depends on feasibility check)
• Competitive Benchmarking
o Benchmarking of key players based on product portfolio, geographical presence, and strategic alliances
Table of Contents
1 Executive Summary
1.1 Market Snapshot and Key Highlights
1.2 Growth Drivers, Challenges, and Opportunities
1.3 Competitive Landscape Overview
1.4 Strategic Insights and Recommendations
2 Research Framework
2.1 Study Objectives and Scope
2.2 Stakeholder Analysis
2.3 Research Assumptions and Limitations
2.4 Research Methodology
2.4.1 Data Collection (Primary and Secondary)
2.4.2 Data Modeling and Estimation Techniques
2.4.3 Data Validation and Triangulation
2.4.4 Analytical and Forecasting Approach
3 Market Dynamics and Trend Analysis
3.1 Market Definition and Structure
3.2 Key Market Drivers
3.3 Market Restraints and Challenges
3.4 Growth Opportunities and Investment Hotspots
3.5 Industry Threats and Risk Assessment
3.6 Technology and Innovation Landscape
3.7 Emerging and High-Growth Markets
3.8 Regulatory and Policy Environment
3.9 Impact of COVID-19 and Recovery Outlook
4 Competitive and Strategic Assessment
4.1 Porter's Five Forces Analysis
4.1.1 Supplier Bargaining Power
4.1.2 Buyer Bargaining Power
4.1.3 Threat of Substitutes
4.1.4 Threat of New Entrants
4.1.5 Competitive Rivalry
4.2 Market Share Analysis of Key Players
4.3 Product Benchmarking and Performance Comparison
5 Global Copper Interconnect Materials Market, By Type
5.1 Lead Frame Plating Solutions
5.2 Packaging Plating Solutions
5.3 Advanced/Niche Copper Plating Solutions
6 Global Copper Interconnect Materials Market, By Technology
6.1 Physical Vapor Deposition (PVD)
6.2 Chemical Vapor Deposition (CVD)
6.3 Electroplating
6.4 Sputtering
7 Global Copper Interconnect Materials Market, By End User
7.1 Semiconductor Foundries & IDMs
7.2 Automotive Electronics
7.3 Consumer Electronics
7.4 Industrial Electronics
8 Global Copper Interconnect Materials Market, By Geography
8.1 North America
8.1.1 United States
8.1.2 Canada
8.1.3 Mexico
8.2 Europe
8.2.1 United Kingdom
8.2.2 Germany
8.2.3 France
8.2.4 Italy
8.2.5 Spain
8.2.6 Netherlands
8.2.7 Belgium
8.2.8 Sweden
8.2.9 Switzerland
8.2.10 Poland
8.2.11 Rest of Europe
8.3 Asia Pacific
8.3.1 China
8.3.2 Japan
8.3.3 India
8.3.4 South Korea
8.3.5 Australia
8.3.6 Indonesia
8.3.7 Thailand
8.3.8 Malaysia
8.3.9 Singapore
8.3.10 Vietnam
8.3.11 Rest of Asia Pacific
8.4 South America
8.4.1 Brazil
8.4.2 Argentina
8.4.3 Colombia
8.4.4 Chile
8.4.5 Peru
8.4.6 Rest of South America
8.5 Rest of the World (RoW)
8.5.1 Middle East
8.5.1.1 Saudi Arabia
8.5.1.2 United Arab Emirates
8.5.1.3 Qatar
8.5.1.4 Israel
8.5.1.5 Rest of Middle East
8.5.2 Africa
8.5.2.1 South Africa
8.5.2.2 Egypt
8.5.2.3 Morocco
8.5.2.4 Rest of Africa
9 Strategic Market Intelligence
9.1 Industry Value Network and Supply Chain Assessment
9.2 White-Space and Opportunity Mapping
9.3 Product Evolution and Market Life Cycle Analysis
9.4 Channel, Distributor, and Go-to-Market Assessment
10 Industry Developments and Strategic Initiatives
10.1 Mergers and Acquisitions
10.2 Partnerships, Alliances, and Joint Ventures
10.3 New Product Launches and Certifications
10.4 Capacity Expansion and Investments
10.5 Other Strategic Initiatives
11 Company Profiles
11.1 Intel
11.2 Samsung
11.3 TSMC
11.4 GlobalFoundries
11.5 Applied Materials
11.6 Lam Research
11.7 JSR Corporation
11.8 Merck
11.9 Dow Chemical
11.10 IBM
11.11 ASE Group
11.12 SK Hynix
11.13 Micron
11.14 Tokyo Electron
11.15 KLA Corporation
11.16 MacDermid Alpha
11.17 JX Advanced Metals
11.18 Amkor Technology
List of Tables
1 Global Copper Interconnect Materials Market Outlook, By Region (2023-2034) ($MN)
2 Global Copper Interconnect Materials Market Outlook, By Type (2023-2034) ($MN)
3 Global Copper Interconnect Materials Market Outlook, By Lead Frame Plating Solutions (2023-2034) ($MN)
4 Global Copper Interconnect Materials Market Outlook, By Packaging Plating Solutions (2023-2034) ($MN)
5 Global Copper Interconnect Materials Market Outlook, By Advanced/Niche Copper Plating Solutions (2023-2034) ($MN)
6 Global Copper Interconnect Materials Market Outlook, By Technology (2023-2034) ($MN)
7 Global Copper Interconnect Materials Market Outlook, By Physical Vapor Deposition (PVD) (2023-2034) ($MN)
8 Global Copper Interconnect Materials Market Outlook, By Chemical Vapor Deposition (CVD) (2023-2034) ($MN)
9 Global Copper Interconnect Materials Market Outlook, By Electroplating (2023-2034) ($MN)
10 Global Copper Interconnect Materials Market Outlook, By Sputtering (2023-2034) ($MN)
11 Global Copper Interconnect Materials Market Outlook, By End User (2023-2034) ($MN)
12 Global Copper Interconnect Materials Market Outlook, By Semiconductor Foundries & IDMs (2023-2034) ($MN)
13 Global Copper Interconnect Materials Market Outlook, By Automotive Electronics (2023-2034) ($MN)
14 Global Copper Interconnect Materials Market Outlook, By Consumer Electronics (2023-2034) ($MN)
15 Global Copper Interconnect Materials Market Outlook, By Industrial Electronics (2023-2034) ($MN)
Note: Tables for North America, Europe, APAC, South America, and Rest of the World (RoW) Regions are also represented in the same manner as above.
List of Figures
RESEARCH METHODOLOGY

We at ‘Stratistics’ opt for an extensive research approach which involves data mining, data validation, and data analysis. The various research sources include in-house repository, secondary research, competitor’s sources, social media research, client internal data, and primary research.
Our team of analysts prefers the most reliable and authenticated data sources in order to perform the comprehensive literature search. With access to most of the authenticated data bases our team highly considers the best mix of information through various sources to obtain extensive and accurate analysis.
Each report takes an average time of a month and a team of 4 industry analysts. The time may vary depending on the scope and data availability of the desired market report. The various parameters used in the market assessment are standardized in order to enhance the data accuracy.
Data Mining
The data is collected from several authenticated, reliable, paid and unpaid sources and is filtered depending on the scope & objective of the research. Our reports repository acts as an added advantage in this procedure. Data gathering from the raw material suppliers, distributors and the manufacturers is performed on a regular basis, this helps in the comprehensive understanding of the products value chain. Apart from the above mentioned sources the data is also collected from the industry consultants to ensure the objective of the study is in the right direction.
Market trends such as technological advancements, regulatory affairs, market dynamics (Drivers, Restraints, Opportunities and Challenges) are obtained from scientific journals, market related national & international associations and organizations.
Data Analysis
From the data that is collected depending on the scope & objective of the research the data is subjected for the analysis. The critical steps that we follow for the data analysis include:
- Product Lifecycle Analysis
- Competitor analysis
- Risk analysis
- Porters Analysis
- PESTEL Analysis
- SWOT Analysis
The data engineering is performed by the core industry experts considering both the Marketing Mix Modeling and the Demand Forecasting. The marketing mix modeling makes use of multiple-regression techniques to predict the optimal mix of marketing variables. Regression factor is based on a number of variables and how they relate to an outcome such as sales or profits.
Data Validation
The data validation is performed by the exhaustive primary research from the expert interviews. This includes telephonic interviews, focus groups, face to face interviews, and questionnaires to validate our research from all aspects. The industry experts we approach come from the leading firms, involved in the supply chain ranging from the suppliers, distributors to the manufacturers and consumers so as to ensure an unbiased analysis.
We are in touch with more than 15,000 industry experts with the right mix of consultants, CEO's, presidents, vice presidents, managers, experts from both supply side and demand side, executives and so on.
The data validation involves the primary research from the industry experts belonging to:
- Leading Companies
- Suppliers & Distributors
- Manufacturers
- Consumers
- Industry/Strategic Consultants
Apart from the data validation the primary research also helps in performing the fill gap research, i.e. providing solutions for the unmet needs of the research which helps in enhancing the reports quality.
For more details about research methodology, kindly write to us at info@strategymrc.com
Frequently Asked Questions
In case of any queries regarding this report, you can contact the customer service by filing the “Inquiry Before Buy” form available on the right hand side. You may also contact us through email: info@strategymrc.com or phone: +1-301-202-5929
Yes, the samples are available for all the published reports. You can request them by filling the “Request Sample” option available in this page.
Yes, you can request a sample with your specific requirements. All the customized samples will be provided as per the requirement with the real data masked.
All our reports are available in Digital PDF format. In case if you require them in any other formats, such as PPT, Excel etc you can submit a request through “Inquiry Before Buy” form available on the right hand side. You may also contact us through email: info@strategymrc.com or phone: +1-301-202-5929
We offer a free 15% customization with every purchase. This requirement can be fulfilled for both pre and post sale. You may send your customization requirements through email at info@strategymrc.com or call us on +1-301-202-5929.
We have 3 different licensing options available in electronic format.
- Single User Licence: Allows one person, typically the buyer, to have access to the ordered product. The ordered product cannot be distributed to anyone else.
- 2-5 User Licence: Allows the ordered product to be shared among a maximum of 5 people within your organisation.
- Corporate License: Allows the product to be shared among all employees of your organisation regardless of their geographical location.
All our reports are typically be emailed to you as an attachment.
To order any available report you need to register on our website. The payment can be made either through CCAvenue or PayPal payments gateways which accept all international cards.
We extend our support to 6 months post sale. A post sale customization is also provided to cover your unmet needs in the report.
Request Customization
We offer complimentary customization of up to 15% with every purchase. To share your customization requirements, feel free to email us at info@strategymrc.com or call us on +1-301-202-5929. .
Please Note: Customization within the 15% threshold is entirely free of charge. If your request exceeds this limit, we will conduct a feasibility assessment. Following that, a detailed quote and timeline will be provided.
WHY CHOOSE US ?

Assured Quality
Best in class reports with high standard of research integrity

24X7 Research Support
Continuous support to ensure the best customer experience.

Free Customization
Adding more values to your product of interest.

Safe & Secure Access
Providing a secured environment for all online transactions.

Trusted by 600+ Brands
Serving the most reputed brands across the world.