
Der Management Ai Market
DER Management AI Market Forecasts to 2034 - Global Analysis By Sensor Type (Distributed Energy Resource Management Systems (DERMS), Virtual Power Plant (VPP) Platforms, Grid Optimization Software, Energy Forecasting Solutions, Asset Performance Management, Demand Response Optimization, and Microgrid Management), Component, Deployment Mode, Technology, Application, End User, and By Geography

|
Years Covered |
2023-2034 |
|
Estimated Year Value (2026) |
US $16.3 BN |
|
Projected Year Value (2034) |
US $,53.6 BN |
|
CAGR (2026- 2034) |
16% |
|
Regions Covered |
North America, Europe, Asia Pacific, South America, and Rest of the World (RoW) |
|
Countries Covered |
United States, Canada, Mexico, United Kingdom, Germany, France, Italy, Spain, Netherlands, Belgium, Sweden, Switzerland, Poland, Rest of Europe, China, Japan, India, South Korea, Australia, Indonesia, Thailand, Malaysia, Singapore, Vietnam, Rest of Asia Pacific, Brazil, Argentina, Colombia, Chile, Peru, Rest of South America, Saudi Arabia, United Arab Emirates, Qatar, Israel, Rest of Middle East, South Africa, Egypt, Morocco, and Rest of Africa. |
|
Largest Market |
North America |
|
Highest Growing Market |
Asia Pacific |
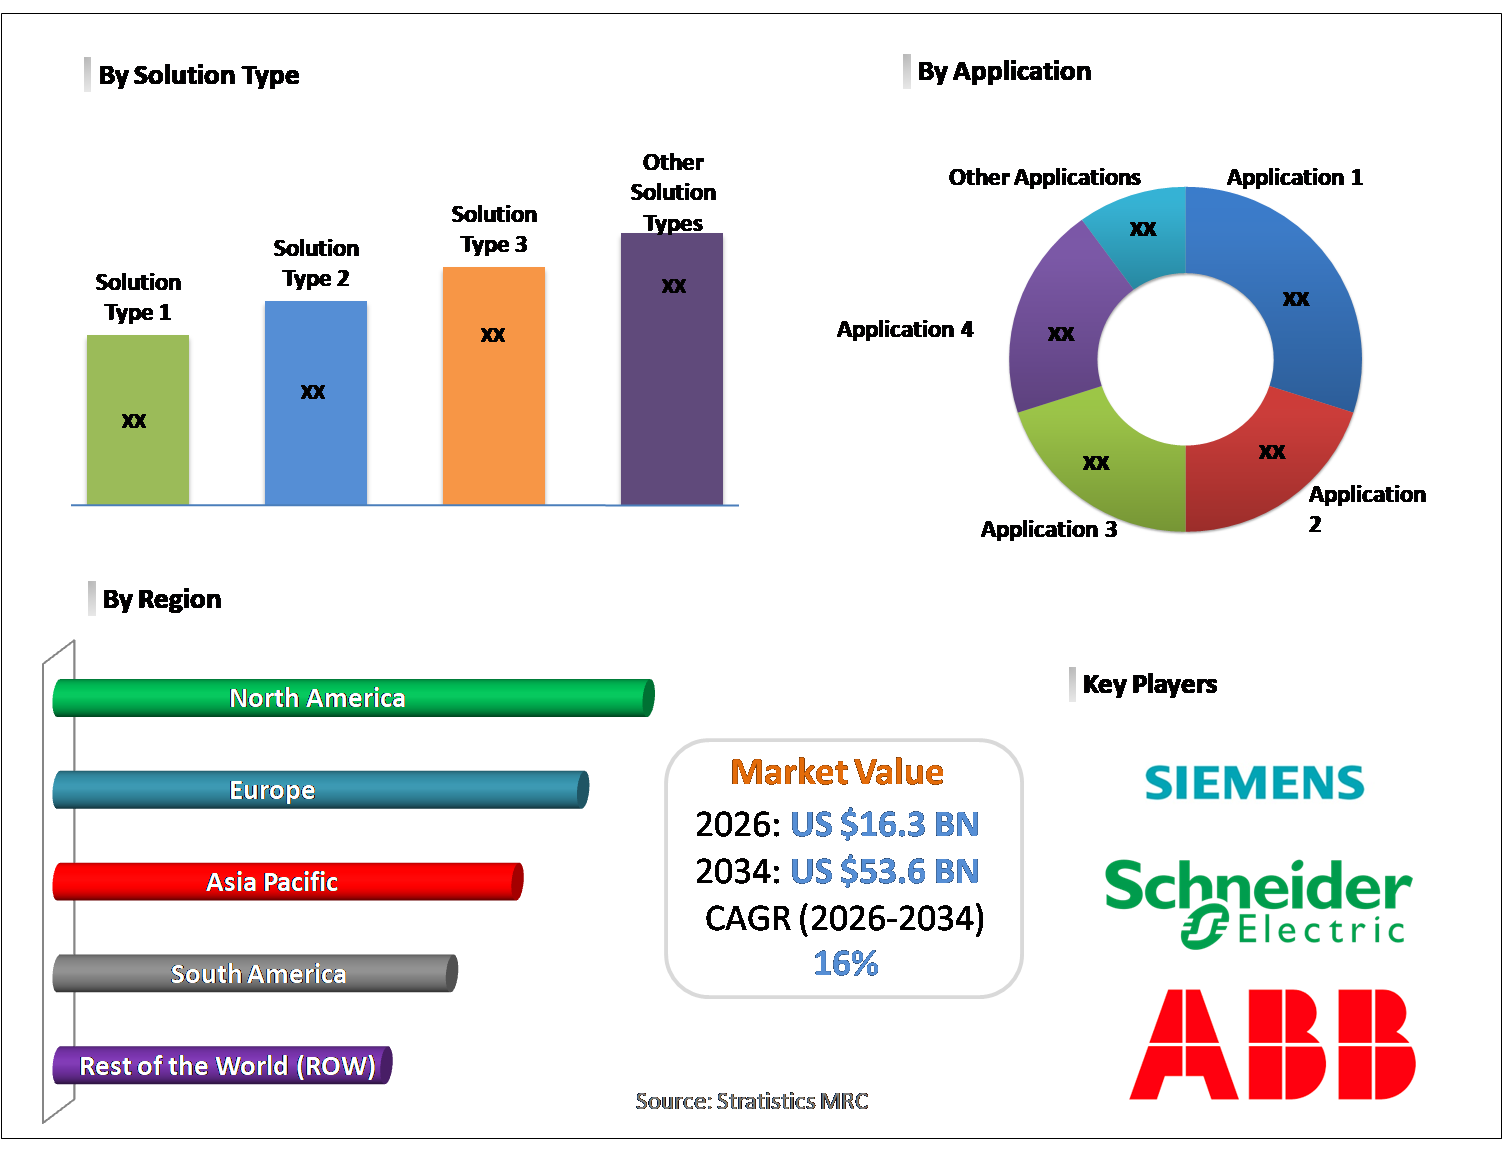
According to Stratistics MRC, the Global DER Management AI Market is accounted for $16.3 billion in 2026 and is expected to reach $53.6 billion by 2034 growing at a CAGR of 16.0% during the forecast period. DER management AI refers to artificial intelligence platforms and software systems that orchestrate and optimize distributed energy resources including solar panels, wind turbines, batteries, and electric vehicles across interconnected power networks. These solutions use machine learning, predictive analytics, and real-time grid data to coordinate the dispatch, charging, and output of decentralized assets for maximum economic and operational efficiency. DER management AI enables utilities, grid operators, and prosumers to better integrate renewable energy, manage grid stability, and participate in emerging virtual power plant and ancillary services markets.
Market Dynamics:
Driver:
Rapid growth of distributed renewable energy assets
The accelerating deployment of rooftop solar systems, behind-the-meter battery storage, electric vehicles, and other distributed energy resources is creating unprecedented complexity in local grid management. Utilities and grid operators require intelligent AI platforms to aggregate, forecast, and dispatch these distributed assets in real time to maintain grid balance, optimize asset utilization, and support renewable energy integration goals. The rapid scaling of DER portfolios globally is outpacing conventional grid management capabilities.
Restraint:
Complex integration with legacy grid infrastructure
Many distribution grid operators rely on aging legacy SCADA systems, manual dispatch processes, and siloed data management infrastructure designed for centralized one-directional power flow from large generation assets. Integrating modern AI-powered DER management platforms with these heterogeneous legacy environments requires extensive middleware development, data standardization efforts, and lengthy system validation processes. The cost and complexity of legacy integration work can extend project timelines.
Opportunity:
Virtual power plant market expansion globally
The emergence of virtual power plant platforms that aggregate distributed energy resources into coordinated grid-dispatchable assets represents a transformative commercial opportunity for DER management AI providers. VPP operators can monetize aggregated DER flexibility through wholesale energy markets, frequency regulation services, and capacity markets, creating new revenue streams for asset owners and platform operators. As electricity market rules evolve to enable broader DER participation in ancillary service markets.
Threat:
Regulatory and grid interconnection barriers
Regulatory frameworks governing DER interconnection, data sharing, market participation, and grid services vary enormously across jurisdictions, creating a fragmented and complex compliance environment for DER management platform providers. Utilities in many regions operate under cost-of-service regulatory models that do not incentivize investment in demand-side flexibility or DER optimization. Grid interconnection rules impose lengthy approval processes and technical requirements that discourage DER deployment and limit the scale of aggregatable assets, reducing available market opportunity and creating.
Covid-19 Impact:
The DER Management AI Market experienced accelerated digital adoption during the COVID-19 period as utilities prioritized grid resilience and remote energy orchestration. Spurred by fluctuations in electricity demand and increasing penetration of rooftop solar and distributed storage, AI-driven DER optimization platforms gained significant traction. Fueled by the need for real-time grid visibility and automated load balancing, energy providers invested in intelligent forecasting and predictive control solutions. This transition reinforced long-term deployment of AI-enabled distributed energy management frameworks across modern power networks.
The distributed energy resource management systems segment is expected to be the largest during the forecast period
The distributed energy resource management systems segment is expected to account for the largest market share during the forecast period, due to its central role in aggregating, monitoring, and optimizing decentralized energy assets. Propelled by increasing renewable energy integration and grid decentralization initiatives, DERMS platforms enable advanced load coordination and bidirectional energy flow management. Furthermore, utilities are leveraging AI-powered DERMS to enhance grid stability, improve demand response efficiency, and maximize distributed asset performance, strengthening its dominant market position.
The software segment is expected to have the highest CAGR during the forecast period
Over the forecast period, the software segment is predicted to witness the highest growth rate, driven by rapid advancements in cloud-based analytics, machine learning algorithms, and predictive grid optimization tools. Spurred by demand for scalable and interoperable energy management platforms, AI-driven software solutions facilitate real-time decision-making and seamless integration with smart grid infrastructure. Additionally, subscription-based deployment models and continuous feature enhancements are accelerating software adoption across utilities and independent power producers.
Region with largest share:
During the forecast period, the Asia Pacific region is expected to hold the largest market share owing to rapid renewable capacity expansion and strong government-backed smart grid initiatives. Propelled by increasing electricity demand and widespread adoption of distributed solar and battery storage systems, utilities across the region are integrating AI-enabled DER orchestration platforms. Moreover, large-scale grid modernization investments reinforce Asia Pacific’s leadership in DER management implementation.
Region with highest CAGR:
Over the forecast period, the North America region is anticipated to exhibit the highest CAGR, due to advanced grid digitalization strategies and strong regulatory support for distributed energy integration. Spurred by expanding virtual power plant projects and AI-based grid analytics deployment, utilities are enhancing distributed asset coordination capabilities. Furthermore, ongoing investments in energy storage, EV infrastructure, and demand response programs position North America as a high-growth hub in the DER Management AI landscape.

Key players in the market
Some of the key players in DER Management AI Market include Siemens AG, Schneider Electric SE, ABB Ltd., General Electric Company, Hitachi Energy, Oracle Corporation, IBM Corporation, Microsoft Corporation, Honeywell International Inc., Eaton Corporation plc, AutoGrid Systems, Inc., Enel X, Itron, Inc., Landis+Gyr, Toshiba Corporation, SunPower Corporation, Enphase Energy, Inc., C3.ai, Inc
Key Developments:
In February 2026, ABB introduced its AI‑powered DER control suite, combining IoT sensors and advanced analytics to optimize distributed assets, reduce grid congestion, and support industrial customers in transitioning toward sustainable energy systems.
In January 2026, Siemens launched its AI‑enabled DER orchestration platform, integrating digital twins and predictive analytics to optimize distributed energy resources, enhance grid flexibility, and support decarbonization across industrial and utility sectors.
In November 2025, GE unveiled hybrid DER management solutions, embedding AI algorithms into turbine and storage systems to improve efficiency, stabilize grids, and align with clean energy investment priorities worldwide.
Solution Types Covered:
• Distributed Energy Resource Management Systems (DERMS)
• Virtual Power Plant (VPP) Platforms
• Grid Optimization Software
• Energy Forecasting Solutions
• Asset Performance Management
• Demand Response Optimization
• Microgrid Management
Components Covered:
• Software
• Hardware
• Services
Deployment Modes Covered:
• On-Premise
• Cloud-Based
Technologies Covered:
• Machine Learning
• Predictive Analytics
• IoT Integration
• Edge Computing
Applications Covered:
• Solar PV Integration
• Wind Energy Management
• Energy Storage Optimization
• Electric Vehicle Integration
• Grid Stability Management
End Users Covered:
• Utilities
• Independent Power Producers
• Commercial & Industrial
• Microgrid Operators
Regions Covered:
• North America
o United States
o Canada
o Mexico
• Europe
o United Kingdom
o Germany
o France
o Italy
o Spain
o Netherlands
o Belgium
o Sweden
o Switzerland
o Poland
o Rest of Europe
• Asia Pacific
o China
o Japan
o India
o South Korea
o Australia
o Indonesia
o Thailand
o Malaysia
o Singapore
o Vietnam
o Rest of Asia Pacific
• South America
o Brazil
o Argentina
o Colombia
o Chile
o Peru
o Rest of South America
• Rest of the World (RoW)
o Middle East
§ Saudi Arabia
§ United Arab Emirates
§ Qatar
§ Israel
§ Rest of Middle East
o Africa
§ South Africa
§ Egypt
§ Morocco
§ Rest of Africa
What our report offers:
- Market share assessments for the regional and country-level segments
- Strategic recommendations for the new entrants
- Covers Market data for the years 2023, 2024, 2025, 2026, 2027, 2028, 2030, 2032 and 2034
- Market Trends (Drivers, Constraints, Opportunities, Threats, Challenges, Investment Opportunities, and recommendations)
- Strategic recommendations in key business segments based on the market estimations
- Competitive landscaping mapping the key common trends
- Company profiling with detailed strategies, financials, and recent developments
- Supply chain trends mapping the latest technological advancements
Free Customization Offerings:
All the customers of this report will be entitled to receive one of the following free customization options:
• Company Profiling
o Comprehensive profiling of additional market players (up to 3)
o SWOT Analysis of key players (up to 3)
• Regional Segmentation
o Market estimations, Forecasts and CAGR of any prominent country as per the client's interest (Note: Depends on feasibility check)
• Competitive Benchmarking
o Benchmarking of key players based on product portfolio, geographical presence, and strategic alliances
Table of Contents
1 Executive Summary
1.1 Market Snapshot and Key Highlights
1.2 Growth Drivers, Challenges, and Opportunities
1.3 Competitive Landscape Overview
1.4 Strategic Insights and Recommendations
2 Research Framework
2.1 Study Objectives and Scope
2.2 Stakeholder Analysis
2.3 Research Assumptions and Limitations
2.4 Research Methodology
2.4.1 Data Collection (Primary and Secondary)
2.4.2 Data Modeling and Estimation Techniques
2.4.3 Data Validation and Triangulation
2.4.4 Analytical and Forecasting Approach
3 Market Dynamics and Trend Analysis
3.1 Market Definition and Structure
3.2 Key Market Drivers
3.3 Market Restraints and Challenges
3.4 Growth Opportunities and Investment Hotspots
3.5 Industry Threats and Risk Assessment
3.6 Technology and Innovation Landscape
3.7 Emerging and High-Growth Markets
3.8 Regulatory and Policy Environment
3.9 Impact of COVID-19 and Recovery Outlook
4 Competitive and Strategic Assessment
4.1 Porter's Five Forces Analysis
4.1.1 Supplier Bargaining Power
4.1.2 Buyer Bargaining Power
4.1.3 Threat of Substitutes
4.1.4 Threat of New Entrants
4.1.5 Competitive Rivalry
4.2 Market Share Analysis of Key Players
4.3 Product Benchmarking and Performance Comparison
5 Global DER Management AI Market, By Solution Type
5.1 Distributed Energy Resource Management Systems (DERMS)
5.2 Virtual Power Plant (VPP) Platforms
5.3 Grid Optimization Software
5.4 Energy Forecasting Solutions
5.5 Asset Performance Management
5.6 Demand Response Optimization
5.7 Microgrid Management
6 Global DER Management AI Market, By Component
6.1 Software
6.2 Hardware
6.3 Services
7 Global DER Management AI Market, By Deployment Mode
7.1 On-Premise
7.2 Cloud-Based
8 Global DER Management AI Market, By Technology
8.1 Machine Learning
8.2 Predictive Analytics
8.3 IoT Integration
8.4 Edge Computing
9 Global DER Management AI Market, By Application
9.1 Solar PV Integration
9.2 Wind Energy Management
9.3 Energy Storage Optimization
9.4 Electric Vehicle Integration
9.5 Grid Stability Management
10 Global DER Management AI Market, By End User
10.1 Utilities
10.2 Independent Power Producers
10.3 Commercial & Industrial
10.4 Microgrid Operators
11 Global DER Management AI Market, By Geography
11.1 North America
11.1.1 United States
11.1.2 Canada
11.1.3 Mexico
11.2 Europe
11.2.1 United Kingdom
11.2.2 Germany
11.2.3 France
11.2.4 Italy
11.2.5 Spain
11.2.6 Netherlands
11.2.7 Belgium
11.2.8 Sweden
11.2.9 Switzerland
11.2.10 Poland
11.2.11 Rest of Europe
11.3 Asia Pacific
11.3.1 China
11.3.2 Japan
11.3.3 India
11.3.4 South Korea
11.3.5 Australia
11.3.6 Indonesia
11.3.7 Thailand
11.3.8 Malaysia
11.3.9 Singapore
11.3.10 Vietnam
11.3.11 Rest of Asia Pacific
11.4 South America
11.4.1 Brazil
11.4.2 Argentina
11.4.3 Colombia
11.4.4 Chile
11.4.5 Peru
11.4.6 Rest of South America
11.5 Rest of the World (RoW)
11.5.1 Middle East
11.5.1.1 Saudi Arabia
11.5.1.2 United Arab Emirates
11.5.1.3 Qatar
11.5.1.4 Israel
11.5.1.5 Rest of Middle East
11.5.2 Africa
11.5.2.1 South Africa
11.5.2.2 Egypt
11.5.2.3 Morocco
11.5.2.4 Rest of Africa
12 Strategic Market Intelligence
12.1 Industry Value Network and Supply Chain Assessment
12.2 White-Space and Opportunity Mapping
12.3 Product Evolution and Market Life Cycle Analysis
12.4 Channel, Distributor, and Go-to-Market Assessment
13 Industry Developments and Strategic Initiatives
13.1 Mergers and Acquisitions
13.2 Partnerships, Alliances, and Joint Ventures
13.3 New Product Launches and Certifications
13.4 Capacity Expansion and Investments
13.5 Other Strategic Initiatives
14 Company Profiles
14.1 Siemens AG
14.2 Schneider Electric SE
14.3 ABB Ltd.
14.4 General Electric Company
14.5 Hitachi Energy
14.6 Oracle Corporation
14.7 IBM Corporation
14.8 Microsoft Corporation
14.9 Honeywell International Inc.
14.10 Eaton Corporation plc
14.11 AutoGrid Systems, Inc.
14.12 Enel X
14.13 Itron, Inc.
14.14 Landis+Gyr
14.15 Toshiba Corporation
14.16 SunPower Corporation
14.17 Enphase Energy, Inc.
14.18 C3.ai, Inc.
List of Tables
1 Global DER Management AI Market Outlook, By Region (2023-2034) ($MN)
2 Global DER Management AI Market Outlook, By Solution Type (2023-2034) ($MN)
3 Global DER Management AI Market Outlook, By Distributed Energy Resource Management Systems (DERMS) (2023-2034) ($MN)
4 Global DER Management AI Market Outlook, By Virtual Power Plant (VPP) Platforms (2023-2034) ($MN)
5 Global DER Management AI Market Outlook, By Grid Optimization Software (2023-2034) ($MN)
6 Global DER Management AI Market Outlook, By Energy Forecasting Solutions (2023-2034) ($MN)
7 Global DER Management AI Market Outlook, By Asset Performance Management (2023-2034) ($MN)
8 Global DER Management AI Market Outlook, By Demand Response Optimization (2023-2034) ($MN)
9 Global DER Management AI Market Outlook, By Microgrid Management (2023-2034) ($MN)
10 Global DER Management AI Market Outlook, By Component (2023-2034) ($MN)
11 Global DER Management AI Market Outlook, By Software (2023-2034) ($MN)
12 Global DER Management AI Market Outlook, By Hardware (2023-2034) ($MN)
13 Global DER Management AI Market Outlook, By Services (2023-2034) ($MN)
14 Global DER Management AI Market Outlook, By Deployment Mode (2023-2034) ($MN)
15 Global DER Management AI Market Outlook, By On-Premise (2023-2034) ($MN)
16 Global DER Management AI Market Outlook, By Cloud-Based (2023-2034) ($MN)
17 Global DER Management AI Market Outlook, By Technology (2023-2034) ($MN)
18 Global DER Management AI Market Outlook, By Machine Learning (2023-2034) ($MN)
19 Global DER Management AI Market Outlook, By Predictive Analytics (2023-2034) ($MN)
20 Global DER Management AI Market Outlook, By IoT Integration (2023-2034) ($MN)
21 Global DER Management AI Market Outlook, By Edge Computing (2023-2034) ($MN)
22 Global DER Management AI Market Outlook, By Application (2023-2034) ($MN)
23 Global DER Management AI Market Outlook, By Solar PV Integration (2023-2034) ($MN)
24 Global DER Management AI Market Outlook, By Wind Energy Management (2023-2034) ($MN)
25 Global DER Management AI Market Outlook, By Energy Storage Optimization (2023-2034) ($MN)
26 Global DER Management AI Market Outlook, By Electric Vehicle Integration (2023-2034) ($MN)
27 Global DER Management AI Market Outlook, By Grid Stability Management (2023-2034) ($MN)
28 Global DER Management AI Market Outlook, By End User (2023-2034) ($MN)
29 Global DER Management AI Market Outlook, By Utilities (2023-2034) ($MN)
30 Global DER Management AI Market Outlook, By Independent Power Producers (2023-2034) ($MN)
31 Global DER Management AI Market Outlook, By Commercial & Industrial (2023-2034) ($MN)
32 Global DER Management AI Market Outlook, By Microgrid Operators (2023-2034) ($MN)
Note: Tables for North America, Europe, APAC, South America, and Rest of the World (RoW) Regions are also represented in the same manner as above.
List of Figures
RESEARCH METHODOLOGY

We at ‘Stratistics’ opt for an extensive research approach which involves data mining, data validation, and data analysis. The various research sources include in-house repository, secondary research, competitor’s sources, social media research, client internal data, and primary research.
Our team of analysts prefers the most reliable and authenticated data sources in order to perform the comprehensive literature search. With access to most of the authenticated data bases our team highly considers the best mix of information through various sources to obtain extensive and accurate analysis.
Each report takes an average time of a month and a team of 4 industry analysts. The time may vary depending on the scope and data availability of the desired market report. The various parameters used in the market assessment are standardized in order to enhance the data accuracy.
Data Mining
The data is collected from several authenticated, reliable, paid and unpaid sources and is filtered depending on the scope & objective of the research. Our reports repository acts as an added advantage in this procedure. Data gathering from the raw material suppliers, distributors and the manufacturers is performed on a regular basis, this helps in the comprehensive understanding of the products value chain. Apart from the above mentioned sources the data is also collected from the industry consultants to ensure the objective of the study is in the right direction.
Market trends such as technological advancements, regulatory affairs, market dynamics (Drivers, Restraints, Opportunities and Challenges) are obtained from scientific journals, market related national & international associations and organizations.
Data Analysis
From the data that is collected depending on the scope & objective of the research the data is subjected for the analysis. The critical steps that we follow for the data analysis include:
- Product Lifecycle Analysis
- Competitor analysis
- Risk analysis
- Porters Analysis
- PESTEL Analysis
- SWOT Analysis
The data engineering is performed by the core industry experts considering both the Marketing Mix Modeling and the Demand Forecasting. The marketing mix modeling makes use of multiple-regression techniques to predict the optimal mix of marketing variables. Regression factor is based on a number of variables and how they relate to an outcome such as sales or profits.
Data Validation
The data validation is performed by the exhaustive primary research from the expert interviews. This includes telephonic interviews, focus groups, face to face interviews, and questionnaires to validate our research from all aspects. The industry experts we approach come from the leading firms, involved in the supply chain ranging from the suppliers, distributors to the manufacturers and consumers so as to ensure an unbiased analysis.
We are in touch with more than 15,000 industry experts with the right mix of consultants, CEO's, presidents, vice presidents, managers, experts from both supply side and demand side, executives and so on.
The data validation involves the primary research from the industry experts belonging to:
- Leading Companies
- Suppliers & Distributors
- Manufacturers
- Consumers
- Industry/Strategic Consultants
Apart from the data validation the primary research also helps in performing the fill gap research, i.e. providing solutions for the unmet needs of the research which helps in enhancing the reports quality.
For more details about research methodology, kindly write to us at info@strategymrc.com
Frequently Asked Questions
In case of any queries regarding this report, you can contact the customer service by filing the “Inquiry Before Buy” form available on the right hand side. You may also contact us through email: info@strategymrc.com or phone: +1-301-202-5929
Yes, the samples are available for all the published reports. You can request them by filling the “Request Sample” option available in this page.
Yes, you can request a sample with your specific requirements. All the customized samples will be provided as per the requirement with the real data masked.
All our reports are available in Digital PDF format. In case if you require them in any other formats, such as PPT, Excel etc you can submit a request through “Inquiry Before Buy” form available on the right hand side. You may also contact us through email: info@strategymrc.com or phone: +1-301-202-5929
We offer a free 15% customization with every purchase. This requirement can be fulfilled for both pre and post sale. You may send your customization requirements through email at info@strategymrc.com or call us on +1-301-202-5929.
We have 3 different licensing options available in electronic format.
- Single User Licence: Allows one person, typically the buyer, to have access to the ordered product. The ordered product cannot be distributed to anyone else.
- 2-5 User Licence: Allows the ordered product to be shared among a maximum of 5 people within your organisation.
- Corporate License: Allows the product to be shared among all employees of your organisation regardless of their geographical location.
All our reports are typically be emailed to you as an attachment.
To order any available report you need to register on our website. The payment can be made either through CCAvenue or PayPal payments gateways which accept all international cards.
We extend our support to 6 months post sale. A post sale customization is also provided to cover your unmet needs in the report.
Request Customization
We offer complimentary customization of up to 15% with every purchase. To share your customization requirements, feel free to email us at info@strategymrc.com or call us on +1-301-202-5929. .
Please Note: Customization within the 15% threshold is entirely free of charge. If your request exceeds this limit, we will conduct a feasibility assessment. Following that, a detailed quote and timeline will be provided.
WHY CHOOSE US ?

Assured Quality
Best in class reports with high standard of research integrity

24X7 Research Support
Continuous support to ensure the best customer experience.

Free Customization
Adding more values to your product of interest.

Safe & Secure Access
Providing a secured environment for all online transactions.

Trusted by 600+ Brands
Serving the most reputed brands across the world.