
Distributed Generation Market
Distributed Generation Market Forecasts to 2028 - Global Analysis By Technology (Micro-hydropower, Fuel Cells, Solar PV, Micro-Turbines, Reciprocating Engines, Wind Turbines, Combustion Turbines and Other Technologies), Application (Off-Grid, On-Grid and Other Applications) End User (Industrial, Commercial, Residential and Other End Users) and By Geography

|
Years Covered |
2020-2028 |
|
Estimated Year Value (2022) |
US $298 BN |
|
Projected Year Value (2028) |
US $639 BN |
|
CAGR (2022 - 2028) |
13.5% |
|
Regions Covered |
North America, Europe, Asia Pacific, South America, and Middle East & Africa |
|
Countries Covered |
US, Canada, Mexico, Germany, UK, Italy, France, Spain, Japan, China, India, Australia, New Zealand, South Korea, Rest of Asia Pacific, South America, Argentina, Brazil, Chile, Middle East & Africa, Saudi Arabia, UAE, Qatar, and South Africa |
|
Largest Market |
Asia Pacific |
|
Highest Growing Market |
Europe |
According to Stratistics MRC, the Global Distributed Generation Market is accounted for $298 billion in 2022 and is expected to reach $639 billion by 2028 growing at a CAGR of 13.5% during the forecast period. Distributed generation which is also known as decentralized generation or on-site generation as the term describes refers to the generation of electricity for on-site usage on our own. It is mainly generated through the pollution free and environment friendly ways with the help of solar panels, wind turbines and many other similar methods. It majorly neglects the energy transmission required through the electric grid from a large, centralized power generation facilities such as a coal-fired or nuclear power plant. Since the power consumption across the globe has been drastically increased from commercial, industrial as well as residential applications it is necessary nowadays to encourage distributed generations to minimize and manage the centralized power loads.
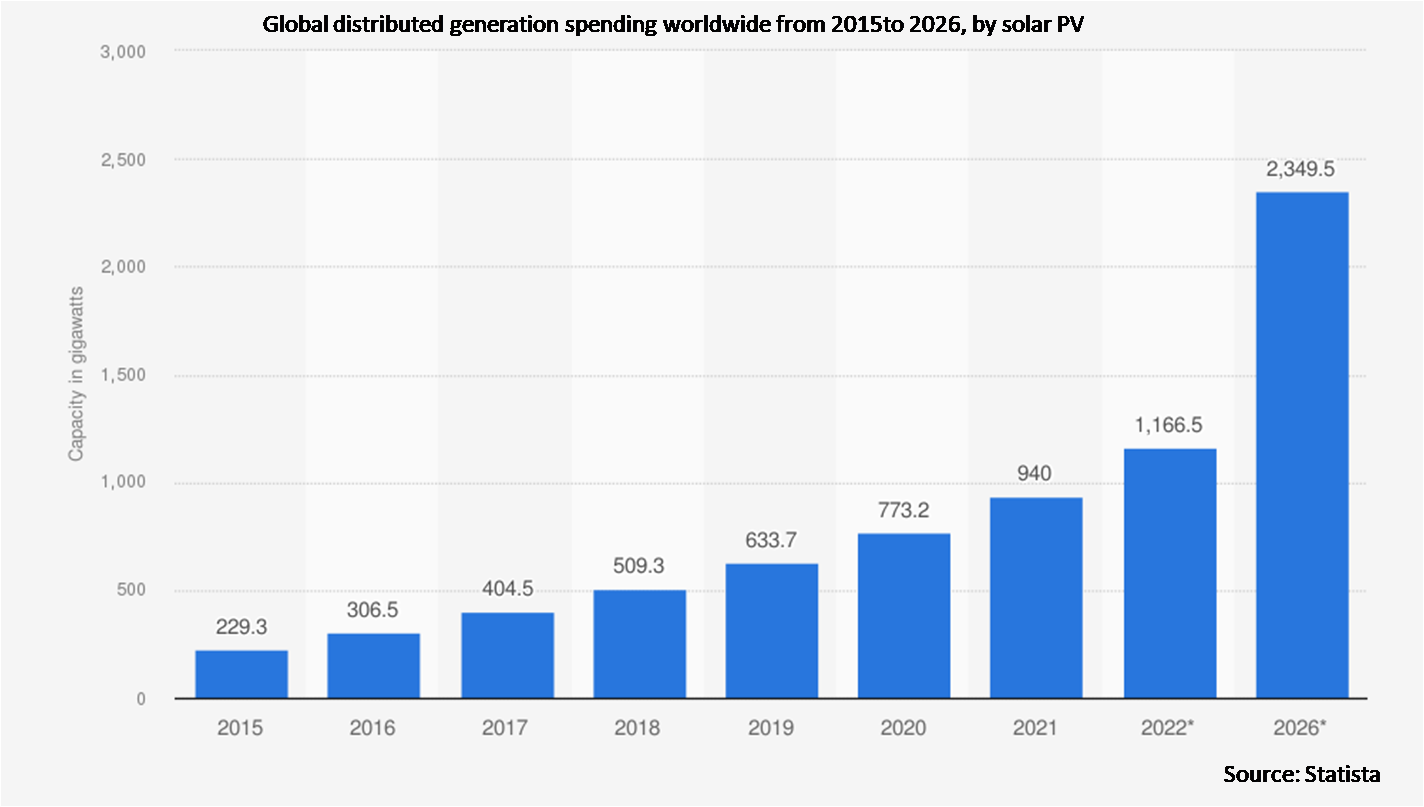
According to the China Photovoltaic Industry Association, newly installed distributed solar power capacity climbed 125% year on year to nearly 19.65 million kilowatts, accounting to roughly two thirds of china’s total newly added solar power capacity.
Market Dynamics:
Driver:
Growing demand for clean energy generation
The market is growing as people become more aware of clean energy resources. The industry is being driven by the rising demand for a distributed generation due to environmental benefits and the lower cost compared to traditional energy generation. Decentralized generating can assist in delivering reliable and clean energy to users while decreasing transmission losses. The centralized system currently dominates the global electricity distribution system. However, it is expected that there would be significant growth, owing primarily to developed economies.
Restraint:
Regular maintenance and troubleshooting
The lack of proper and regular maintenance may result in improper functioning of the distributed generation. The effects of distributed generation are short circuit levels are increased, load losses change, voltage profiles change along the network, voltage transients will appear, congestions can appear in system branches, power quality and reliability may be affected and the networks protections may not function properly. Furthermore, voltage regulation, sustained interruptions, harmonics, voltage sags are the factors restraining the growth of the market.
Opportunity:
Renewable sources of energy
Governments all around the world have devised enticing incentives to encourage the adoption of renewable energy sources, hence accelerating growth. Distributed generation is made up of a variety of energy sources, most of which are renewable. Solar, wind, fuel cells, hydro, biogas, biomass, and geothermal power are all examples of renewable energy sources. The global distributed generation market is projected to grow at a high rate during the forecast period, mainly due to the growing demand for clean energy generation and renewable sources of energy. Governments around the world have developed attractive incentives, rewarding the use of renewable sources of energy, which further drives the growth.
Threat:
High cost
The adoption of the distributed generation may offer huge advantages but there is a cost associated with the maintenance of the systems. The small and medium sector enterprises have financial limitations that restrict them to adopt the advanced and expensive distributed generation systems. The low financial capabilities of the SMEs may hamper the market growth during the forecast period.
Covid-19 Impact
The demand–supply gap, disruptions in raw material procurement, and price volatility are expected to hamper the growth of the industry during the COVID-19 pandemic. Due to a scarcity of resources in various parts of the world, the COVID-19 epidemic has impacted negatively on the manufacturing and industrial industries. Due to trade restrictions implemented in various sections of the country. The industry's top players are concerned about the market's prospects and are rethinking their strategies to meet the challenge.
The fuel cell segment is expected to be the largest during the forecast period
The fuel cell segment is estimated to have a lucrative growth, due to the improved adoption of the fuel cells in the distributed generation system owing to various benefits like high efficiency, lower emissions, and capability of converting chemical energy into electrical energy. Furthermore, as fuel cells have inherent benefits beyond than power generation, they can be used for energy storage and power flow regulation. Hence, these are the aspects driving the segment growth.
The commercial & industrial segment is expected to have the highest CAGR during the forecast period
The commercial & industrial segment is anticipated to witness the fastest CAGR growth during the forecast period, due to the reducing equipment costs and increased demand for the uninterrupted power supply. This is attributed to the increased government initiatives to promote the adoption of the renewable energy sources across the commercial and industrial sectors in the form of subsidies and incentives. Moreover, the increased efforts of the government to industrialize and urbanize the rural regions are supporting the growth of the segment.
Region with highest share:
Asia Pacific is projected to hold the largest market share during the forecast period owing to the increased adoption of renewable energy sources, rising investments in the industrialization and urbanization, rapidly growing infrastructural developments, and increasing government initiatives to encourage the deployment of renewable and green & clean energy sources. Moreover, with the growing industrialization, the demand for the efficient and uninterrupted power supply is growing significantly, which is fueling the growth of the market in region.
Region with highest CAGR:
Europe is projected to have the highest CAGR over the forecast period, owing to its higher energy efficiency. This is attributed to the strict government norms regarding the use of renewable energy. The increased awareness regarding the climate change and negative effects of carbon emission has resulted in the huge demand for the clean and green energy. The government has strict regulations regarding the industrial and commercial use of energy pertaining to the renewable sources, which has enhanced the growth of the market in region.

Key players in the market
Some of the key players profiled in the Distributed Generation Market include Huawei Technologies Co., Ltd., ABB Limited, Mitsubishi Heavy Industries Ltd., Siemens AG, Schneider Electric, FuelCell Energy, Inc., Canadian Solar Inc., Rolls-Royce Power Systems AG, Toyota Turbine and Systems Inc., Caterpillar, Inc., Capstone Green Energy Corporation, Bergey WindPower Company, SMA Solar Technology AG, Bloom Energy Corporation, Vestas Wind Systems A/S, Emergya Wind Technologies B.V., GE Power, Ansaldo Energia S.p.A., Flex Energy Solutions and Ameresco, Inc.
Key Developments:
In December 2020, Mitsubishi Heavy Industries Ltd and Vestas Wind Systems A/S of Denmark signed an agreement that formally ended their 50/50 MHI Vestas Offshore Wind A/S joint venture.
In July 2019, FuelCell Energy reported regarding its plan to re-launch sub-MW distributed generation system in European countries such as Germany, Spain, UK, and Italy.
In June 2019, Ameresco completed its project named 10MW Distributed Energy Security that involved a cost of US$91 million. This system has the capability to withstand seismic and storm conditions.
Technologies Covered:
• Micro-hydropower
• Fuel Cells
• Solar PV
• Micro-Turbines
• Reciprocating Engines
• Wind Turbines
• Combustion Turbines
• Other Technologies
Applications Covered:
• Off-Grid
• On-Grid
• Other Applications
End Users Covered:
• Industrial
• Commercial
• Residential
• Other End Users
Regions Covered:
• North America
o US
o Canada
o Mexico
• Europe
o Germany
o UK
o Italy
o France
o Spain
o Rest of Europe
• Asia Pacific
o Japan
o China
o India
o Australia
o New Zealand
o South Korea
o Rest of Asia Pacific
• South America
o Argentina
o Brazil
o Chile
o Rest of South America
• Middle East & Africa
o Saudi Arabia
o UAE
o Qatar
o South Africa
o Rest of Middle East & Africa
What our report offers:
- Market share assessments for the regional and country-level segments
- Strategic recommendations for the new entrants
- Covers Market data for the years 2020, 2021, 2022, 2025, and 2028
- Market Trends (Drivers, Constraints, Opportunities, Threats, Challenges, Investment Opportunities, and recommendations)
- Strategic recommendations in key business segments based on the market estimations
- Competitive landscaping mapping the key common trends
- Company profiling with detailed strategies, financials, and recent developments
- Supply chain trends mapping the latest technological advancements
Free Customization Offerings:
All the customers of this report will be entitled to receive one of the following free customization options:
• Company Profiling
o Comprehensive profiling of additional market players (up to 3)
o SWOT Analysis of key players (up to 3)
• Regional Segmentation
o Market estimations, Forecasts and CAGR of any prominent country as per the client's interest (Note: Depends on feasibility check)
• Competitive Benchmarking
o Benchmarking of key players based on product portfolio, geographical presence, and strategic alliances
Table of Contents
1 Executive Summary
2 Preface
2.1 Abstract
2.2 Stake Holders
2.3 Research Scope
2.4 Research Methodology
2.4.1 Data Mining
2.4.2 Data Analysis
2.4.3 Data Validation
2.4.4 Research Approach
2.5 Research Sources
2.5.1 Primary Research Sources
2.5.2 Secondary Research Sources
2.5.3 Assumptions
3 Market Trend Analysis
3.1 Introduction
3.2 Drivers
3.3 Restraints
3.4 Opportunities
3.5 Threats
3.6 Technology Analysis
3.7 Application Analysis
3.8 End User Analysis
3.9 Emerging Markets
3.10 Impact of Covid-19
4 Porters Five Force Analysis
4.1 Bargaining power of suppliers
4.2 Bargaining power of buyers
4.3 Threat of substitutes
4.4 Threat of new entrants
4.5 Competitive rivalry
5 Global Distributed Generation Market, By Technology
5.1 Introduction
5.2 Micro-hydropower
5.3 Fuel Cells
5.4 Solar PV
5.5 Micro-Turbines
5.6 Reciprocating Engines
5.7 Wind Turbines
5.8 Combustion Turbines
5.9 Other Technologies
6 Global Distributed Generation Market, By Application
6.1 Introduction
6.2 Off-Grid
6.3 On-Grid
6.4 Other Applications
7 Global Distributed Generation Market, By End User
7.1 Introduction
7.2 Industrial
7.3 Commercial
7.4 Residential
7.5 Other End Users
8 Global Distributed Generation Market, By Geography
8.1 Introduction
8.2 North America
8.2.1 US
8.2.2 Canada
8.2.3 Mexico
8.3 Europe
8.3.1 Germany
8.3.2 UK
8.3.3 Italy
8.3.4 France
8.3.5 Spain
8.3.6 Rest of Europe
8.4 Asia Pacific
8.4.1 Japan
8.4.2 China
8.4.3 India
8.4.4 Australia
8.4.5 New Zealand
8.4.6 South Korea
8.4.7 Rest of Asia Pacific
8.5 South America
8.5.1 Argentina
8.5.2 Brazil
8.5.3 Chile
8.5.4 Rest of South America
8.6 Middle East & Africa
8.6.1 Saudi Arabia
8.6.2 UAE
8.6.3 Qatar
8.6.4 South Africa
8.6.5 Rest of Middle East & Africa
9 Key Developments
9.1 Agreements, Partnerships, Collaborations and Joint Ventures
9.2 Acquisitions & Mergers
9.3 New Product Launch
9.4 Expansions
9.5 Other Key Strategies
10 Company Profiling
10.1 Huawei Technologies Co., Ltd.
10.2 ABB Limited
10.3 Mitsubishi Heavy Industries Ltd.
10.4 Siemens AG
10.5 Schneider Electric
10.6 FuelCell Energy, Inc.
10.7 Canadian Solar Inc.
10.8 Rolls-Royce Power Systems AG
10.9 Toyota Turbine and Systems Inc.
10.10 Caterpillar, Inc.
10.11 Capstone Green Energy Corporation
10.12 Bergey WindPower Company
10.13 SMA Solar Technology AG
10.14 Bloom Energy Corporation
10.15 Vestas Wind Systems A/S
10.16 Emergya Wind Technologies B.V.
10.17 GE Power
10.18 Ansaldo Energia S.p.A.
10.19 Flex Energy Solutions
10.20 Ameresco, Inc.
List of Tables
1 Global Distributed Generation Market Outlook, By Region (2020-2028) ($MN)
2 Global Distributed Generation Market Outlook, By Technology (2020-2028) ($MN)
3 Global Distributed Generation Market Outlook, By Micro-hydropower (2020-2028) ($MN)
4 Global Distributed Generation Market Outlook, By Fuel Cells (2020-2028) ($MN)
5 Global Distributed Generation Market Outlook, By Solar PV (2020-2028) ($MN)
6 Global Distributed Generation Market Outlook, By Micro-Turbines (2020-2028) ($MN)
7 Global Distributed Generation Market Outlook, By Reciprocating Engines (2020-2028) ($MN)
8 Global Distributed Generation Market Outlook, By Wind Turbines (2020-2028) ($MN)
9 Global Distributed Generation Market Outlook, By Combustion Turbines (2020-2028) ($MN)
10 Global Distributed Generation Market Outlook, By Other Technologies (2020-2028) ($MN)
11 Global Distributed Generation Market Outlook, By Application (2020-2028) ($MN)
12 Global Distributed Generation Market Outlook, By Off-Grid (2020-2028) ($MN)
13 Global Distributed Generation Market Outlook, By On-Grid (2020-2028) ($MN)
14 Global Distributed Generation Market Outlook, By Other Applications (2020-2028) ($MN)
15 Global Distributed Generation Market Outlook, By End User (2020-2028) ($MN)
16 Global Distributed Generation Market Outlook, By Industrial (2020-2028) ($MN)
17 Global Distributed Generation Market Outlook, By Commercial (2020-2028) ($MN)
18 Global Distributed Generation Market Outlook, By Residential (2020-2028) ($MN)
19 Global Distributed Generation Market Outlook, By Other End Users (2020-2028) ($MN)
20 North America Distributed Generation Market Outlook, By Country (2020-2028) ($MN)
21 North America Distributed Generation Market Outlook, By Technology (2020-2028) ($MN)
22 North America Distributed Generation Market Outlook, By Micro-hydropower (2020-2028) ($MN)
23 North America Distributed Generation Market Outlook, By Fuel Cells (2020-2028) ($MN)
24 North America Distributed Generation Market Outlook, By Solar PV (2020-2028) ($MN)
25 North America Distributed Generation Market Outlook, By Micro-Turbines (2020-2028) ($MN)
26 North America Distributed Generation Market Outlook, By Reciprocating Engines (2020-2028) ($MN)
27 North America Distributed Generation Market Outlook, By Wind Turbines (2020-2028) ($MN)
28 North America Distributed Generation Market Outlook, By Combustion Turbines (2020-2028) ($MN)
29 North America Distributed Generation Market Outlook, By Other Technologies (2020-2028) ($MN)
30 North America Distributed Generation Market Outlook, By Application (2020-2028) ($MN)
31 North America Distributed Generation Market Outlook, By Off-Grid (2020-2028) ($MN)
32 North America Distributed Generation Market Outlook, By On-Grid (2020-2028) ($MN)
33 North America Distributed Generation Market Outlook, By Other Applications (2020-2028) ($MN)
34 North America Distributed Generation Market Outlook, By End User (2020-2028) ($MN)
35 North America Distributed Generation Market Outlook, By Industrial (2020-2028) ($MN)
36 North America Distributed Generation Market Outlook, By Commercial (2020-2028) ($MN)
37 North America Distributed Generation Market Outlook, By Residential (2020-2028) ($MN)
38 North America Distributed Generation Market Outlook, By Other End Users (2020-2028) ($MN)
39 Europe Distributed Generation Market Outlook, By Country (2020-2028) ($MN)
40 Europe Distributed Generation Market Outlook, By Technology (2020-2028) ($MN)
41 Europe Distributed Generation Market Outlook, By Micro-hydropower (2020-2028) ($MN)
42 Europe Distributed Generation Market Outlook, By Fuel Cells (2020-2028) ($MN)
43 Europe Distributed Generation Market Outlook, By Solar PV (2020-2028) ($MN)
44 Europe Distributed Generation Market Outlook, By Micro-Turbines (2020-2028) ($MN)
45 Europe Distributed Generation Market Outlook, By Reciprocating Engines (2020-2028) ($MN)
46 Europe Distributed Generation Market Outlook, By Wind Turbines (2020-2028) ($MN)
47 Europe Distributed Generation Market Outlook, By Combustion Turbines (2020-2028) ($MN)
48 Europe Distributed Generation Market Outlook, By Other Technologies (2020-2028) ($MN)
49 Europe Distributed Generation Market Outlook, By Application (2020-2028) ($MN)
50 Europe Distributed Generation Market Outlook, By Off-Grid (2020-2028) ($MN)
51 Europe Distributed Generation Market Outlook, By On-Grid (2020-2028) ($MN)
52 Europe Distributed Generation Market Outlook, By Other Applications (2020-2028) ($MN)
53 Europe Distributed Generation Market Outlook, By End User (2020-2028) ($MN)
54 Europe Distributed Generation Market Outlook, By Industrial (2020-2028) ($MN)
55 Europe Distributed Generation Market Outlook, By Commercial (2020-2028) ($MN)
56 Europe Distributed Generation Market Outlook, By Residential (2020-2028) ($MN)
57 Europe Distributed Generation Market Outlook, By Other End Users (2020-2028) ($MN)
58 Asia Pacific Distributed Generation Market Outlook, By Country (2020-2028) ($MN)
59 Asia Pacific Distributed Generation Market Outlook, By Technology (2020-2028) ($MN)
60 Asia Pacific Distributed Generation Market Outlook, By Micro-hydropower (2020-2028) ($MN)
61 Asia Pacific Distributed Generation Market Outlook, By Fuel Cells (2020-2028) ($MN)
62 Asia Pacific Distributed Generation Market Outlook, By Solar PV (2020-2028) ($MN)
63 Asia Pacific Distributed Generation Market Outlook, By Micro-Turbines (2020-2028) ($MN)
64 Asia Pacific Distributed Generation Market Outlook, By Reciprocating Engines (2020-2028) ($MN)
65 Asia Pacific Distributed Generation Market Outlook, By Wind Turbines (2020-2028) ($MN)
66 Asia Pacific Distributed Generation Market Outlook, By Combustion Turbines (2020-2028) ($MN)
67 Asia Pacific Distributed Generation Market Outlook, By Other Technologies (2020-2028) ($MN)
68 Asia Pacific Distributed Generation Market Outlook, By Application (2020-2028) ($MN)
69 Asia Pacific Distributed Generation Market Outlook, By Off-Grid (2020-2028) ($MN)
70 Asia Pacific Distributed Generation Market Outlook, By On-Grid (2020-2028) ($MN)
71 Asia Pacific Distributed Generation Market Outlook, By Other Applications (2020-2028) ($MN)
72 Asia Pacific Distributed Generation Market Outlook, By End User (2020-2028) ($MN)
73 Asia Pacific Distributed Generation Market Outlook, By Industrial (2020-2028) ($MN)
74 Asia Pacific Distributed Generation Market Outlook, By Commercial (2020-2028) ($MN)
75 Asia Pacific Distributed Generation Market Outlook, By Residential (2020-2028) ($MN)
76 Asia Pacific Distributed Generation Market Outlook, By Other End Users (2020-2028) ($MN)
77 South America Distributed Generation Market Outlook, By Country (2020-2028) ($MN)
78 South America Distributed Generation Market Outlook, By Technology (2020-2028) ($MN)
79 South America Distributed Generation Market Outlook, By Micro-hydropower (2020-2028) ($MN)
80 South America Distributed Generation Market Outlook, By Fuel Cells (2020-2028) ($MN)
81 South America Distributed Generation Market Outlook, By Solar PV (2020-2028) ($MN)
82 South America Distributed Generation Market Outlook, By Micro-Turbines (2020-2028) ($MN)
83 South America Distributed Generation Market Outlook, By Reciprocating Engines (2020-2028) ($MN)
84 South America Distributed Generation Market Outlook, By Wind Turbines (2020-2028) ($MN)
85 South America Distributed Generation Market Outlook, By Combustion Turbines (2020-2028) ($MN)
86 South America Distributed Generation Market Outlook, By Other Technologies (2020-2028) ($MN)
87 South America Distributed Generation Market Outlook, By Application (2020-2028) ($MN)
88 South America Distributed Generation Market Outlook, By Off-Grid (2020-2028) ($MN)
89 South America Distributed Generation Market Outlook, By On-Grid (2020-2028) ($MN)
90 South America Distributed Generation Market Outlook, By Other Applications (2020-2028) ($MN)
91 South America Distributed Generation Market Outlook, By End User (2020-2028) ($MN)
92 South America Distributed Generation Market Outlook, By Industrial (2020-2028) ($MN)
93 South America Distributed Generation Market Outlook, By Commercial (2020-2028) ($MN)
94 South America Distributed Generation Market Outlook, By Residential (2020-2028) ($MN)
95 South America Distributed Generation Market Outlook, By Other End Users (2020-2028) ($MN)
96 Middle East & Africa Distributed Generation Market Outlook, By Country (2020-2028) ($MN)
97 Middle East & Africa Distributed Generation Market Outlook, By Technology (2020-2028) ($MN)
98 Middle East & Africa Distributed Generation Market Outlook, By Micro-hydropower (2020-2028) ($MN)
99 Middle East & Africa Distributed Generation Market Outlook, By Fuel Cells (2020-2028) ($MN)
100 Middle East & Africa Distributed Generation Market Outlook, By Solar PV (2020-2028) ($MN)
101 Middle East & Africa Distributed Generation Market Outlook, By Micro-Turbines (2020-2028) ($MN)
102 Middle East & Africa Distributed Generation Market Outlook, By Reciprocating Engines (2020-2028) ($MN)
103 Middle East & Africa Distributed Generation Market Outlook, By Wind Turbines (2020-2028) ($MN)
104 Middle East & Africa Distributed Generation Market Outlook, By Combustion Turbines (2020-2028) ($MN)
105 Middle East & Africa Distributed Generation Market Outlook, By Other Technologies (2020-2028) ($MN)
106 Middle East & Africa Distributed Generation Market Outlook, By Application (2020-2028) ($MN)
107 Middle East & Africa Distributed Generation Market Outlook, By Off-Grid (2020-2028) ($MN)
108 Middle East & Africa Distributed Generation Market Outlook, By On-Grid (2020-2028) ($MN)
109 Middle East & Africa Distributed Generation Market Outlook, By Other Applications (2020-2028) ($MN)
110 Middle East & Africa Distributed Generation Market Outlook, By End User (2020-2028) ($MN)
111 Middle East & Africa Distributed Generation Market Outlook, By Industrial (2020-2028) ($MN)
112 Middle East & Africa Distributed Generation Market Outlook, By Commercial (2020-2028) ($MN)
113 Middle East & Africa Distributed Generation Market Outlook, By Residential (2020-2028) ($MN)
114 Middle East & Africa Distributed Generation Market Outlook, By Other End Users (2020-2028) ($MN)
List of Figures
RESEARCH METHODOLOGY

We at ‘Stratistics’ opt for an extensive research approach which involves data mining, data validation, and data analysis. The various research sources include in-house repository, secondary research, competitor’s sources, social media research, client internal data, and primary research.
Our team of analysts prefers the most reliable and authenticated data sources in order to perform the comprehensive literature search. With access to most of the authenticated data bases our team highly considers the best mix of information through various sources to obtain extensive and accurate analysis.
Each report takes an average time of a month and a team of 4 industry analysts. The time may vary depending on the scope and data availability of the desired market report. The various parameters used in the market assessment are standardized in order to enhance the data accuracy.
Data Mining
The data is collected from several authenticated, reliable, paid and unpaid sources and is filtered depending on the scope & objective of the research. Our reports repository acts as an added advantage in this procedure. Data gathering from the raw material suppliers, distributors and the manufacturers is performed on a regular basis, this helps in the comprehensive understanding of the products value chain. Apart from the above mentioned sources the data is also collected from the industry consultants to ensure the objective of the study is in the right direction.
Market trends such as technological advancements, regulatory affairs, market dynamics (Drivers, Restraints, Opportunities and Challenges) are obtained from scientific journals, market related national & international associations and organizations.
Data Analysis
From the data that is collected depending on the scope & objective of the research the data is subjected for the analysis. The critical steps that we follow for the data analysis include:
- Product Lifecycle Analysis
- Competitor analysis
- Risk analysis
- Porters Analysis
- PESTEL Analysis
- SWOT Analysis
The data engineering is performed by the core industry experts considering both the Marketing Mix Modeling and the Demand Forecasting. The marketing mix modeling makes use of multiple-regression techniques to predict the optimal mix of marketing variables. Regression factor is based on a number of variables and how they relate to an outcome such as sales or profits.
Data Validation
The data validation is performed by the exhaustive primary research from the expert interviews. This includes telephonic interviews, focus groups, face to face interviews, and questionnaires to validate our research from all aspects. The industry experts we approach come from the leading firms, involved in the supply chain ranging from the suppliers, distributors to the manufacturers and consumers so as to ensure an unbiased analysis.
We are in touch with more than 15,000 industry experts with the right mix of consultants, CEO's, presidents, vice presidents, managers, experts from both supply side and demand side, executives and so on.
The data validation involves the primary research from the industry experts belonging to:
- Leading Companies
- Suppliers & Distributors
- Manufacturers
- Consumers
- Industry/Strategic Consultants
Apart from the data validation the primary research also helps in performing the fill gap research, i.e. providing solutions for the unmet needs of the research which helps in enhancing the reports quality.
For more details about research methodology, kindly write to us at info@strategymrc.com
Frequently Asked Questions
In case of any queries regarding this report, you can contact the customer service by filing the “Inquiry Before Buy” form available on the right hand side. You may also contact us through email: info@strategymrc.com or phone: +1-301-202-5929
Yes, the samples are available for all the published reports. You can request them by filling the “Request Sample” option available in this page.
Yes, you can request a sample with your specific requirements. All the customized samples will be provided as per the requirement with the real data masked.
All our reports are available in Digital PDF format. In case if you require them in any other formats, such as PPT, Excel etc you can submit a request through “Inquiry Before Buy” form available on the right hand side. You may also contact us through email: info@strategymrc.com or phone: +1-301-202-5929
We offer a free 15% customization with every purchase. This requirement can be fulfilled for both pre and post sale. You may send your customization requirements through email at info@strategymrc.com or call us on +1-301-202-5929.
We have 3 different licensing options available in electronic format.
- Single User Licence: Allows one person, typically the buyer, to have access to the ordered product. The ordered product cannot be distributed to anyone else.
- 2-5 User Licence: Allows the ordered product to be shared among a maximum of 5 people within your organisation.
- Corporate License: Allows the product to be shared among all employees of your organisation regardless of their geographical location.
All our reports are typically be emailed to you as an attachment.
To order any available report you need to register on our website. The payment can be made either through CCAvenue or PayPal payments gateways which accept all international cards.
We extend our support to 6 months post sale. A post sale customization is also provided to cover your unmet needs in the report.
Request Customization
We offer complimentary customization of up to 15% with every purchase. To share your customization requirements, feel free to email us at info@strategymrc.com or call us on +1-301-202-5929. .
Please Note: Customization within the 15% threshold is entirely free of charge. If your request exceeds this limit, we will conduct a feasibility assessment. Following that, a detailed quote and timeline will be provided.
WHY CHOOSE US ?

Assured Quality
Best in class reports with high standard of research integrity

24X7 Research Support
Continuous support to ensure the best customer experience.

Free Customization
Adding more values to your product of interest.

Safe & Secure Access
Providing a secured environment for all online transactions.

Trusted by 600+ Brands
Serving the most reputed brands across the world.