
E Bike Battery Market
E-bike Battery Market Forecasts to 2030 - Global Analysis By E-Bike Type (City/Commuter E-Bikes, Mountain E-Bikes, Road E-Bikes, Folding E-Bikes, Cargo E-Bikes and Other E-Bike Types), Battery Type, Battery Capacity, Battery Configuration, Sales Channel, End User and By Geography

|
Years Covered |
2022-2030 |
|
Estimated Year Value (2024) |
US $47.62 BN |
|
Projected Year Value (2030) |
US $75.61 BN |
|
CAGR (2024 - 2030) |
8.2% |
|
Regions Covered |
North America, Europe, Asia Pacific, South America, and Middle East & Africa |
|
Countries Covered |
US, Canada, Mexico, Germany, UK, Italy, France, Spain, Japan, China, India, Australia, New Zealand, South Korea, Rest of Asia Pacific, South America, Argentina, Brazil, Chile, Middle East & Africa, Saudi Arabia, UAE, Qatar, and South Africa |
|
Largest Market |
Asia Pacific |
|
Highest Growing Market |
North America |
According to Stratistics MRC, the Global E-bike Battery Market is accounted for $47.62 billion in 2024 and is expected to reach $75.61 billion by 2030 growing at a CAGR of 8.2% during the forecast period. An E-bike battery is a rechargeable power source used to fuel electric bicycles. These batteries store electrical energy, which powers the e-bike's motor, assisting with propulsion and improving efficiency. E-bike batteries contribute to energy efficiency and lower environmental impact compared to traditional gasoline-powered vehicles, making them an essential component in sustainable personal transportation.
According to the China Bicycle Association (CBA), over 350 million electric motorcycles were on Chinese roads in 2022.
Market Dynamics:
Driver:
Increasing consumer preference for eco-friendly transportation
As concerns about climate change and environmental impact rise, consumers seek alternatives to traditional fossil fuel-powered vehicles. E-bikes, which offer zero emissions and reduced carbon footprints, meet this demand effectively. Their energy efficiency, combined with advancements in battery technology and supportive government policies, enhances their appeal. This growing awareness and preference drive higher adoption rates, expanding the e-bike market and accelerating its growth as a sustainable transportation solution.
Restraint:
Insufficient charging infrastructure
Insufficient charging infrastructure for e-bike batteries stems from inadequate investment and development in charging stations, particularly in rural or less-developed areas. This lack of infrastructure limits e-bike usability and convenience, deterring potential buyers who may worry about charging accessibility. It also affects the range and practicality of e-bikes, as riders may face difficulties finding suitable charging points during longer trips. As a result, the limited infrastructure impedes widespread adoption and growth of the e-bike market.
Opportunity:
Global market penetration
Global market penetration expands access to diverse consumer bases and increasing product visibility. As e-bike manufacturers enter new regions and markets, they tap into previously underserved areas, boosting sales and brand recognition. This expansion is supported by growing infrastructure, local partnerships, and targeted marketing strategies that cater to regional preferences and needs. This dynamic approach accelerates e-bike adoption, enhances market growth, and contributes to the broader acceptance of sustainable transportation solutions worldwide.
Threat:
Technological challenges
Technological challenges in e-bike batteries include issues such as energy density, battery lifespan, and safety concerns like thermal runaway. Low energy density impacts the range and performance of e-bikes, while limited battery lifespan affects long-term usability. Safety concerns pose risks to consumer confidence. These challenges result in higher costs for research and development, which can make e-bikes more expensive and less accessible.
Covid-19 Impact
The covid-19 pandemic initially disrupted the e-bike battery market due to supply chain interruptions and manufacturing halts. However, it also accelerated demand for e-bikes as consumers sought safer, personal transportation methods. The increased focus on health, environmental sustainability, and reduced reliance on public transport drove e-bike adoption. While supply chain issues posed challenges, the overall market experienced growth as people sought more convenient and eco-friendly travel options during and after the pandemic.
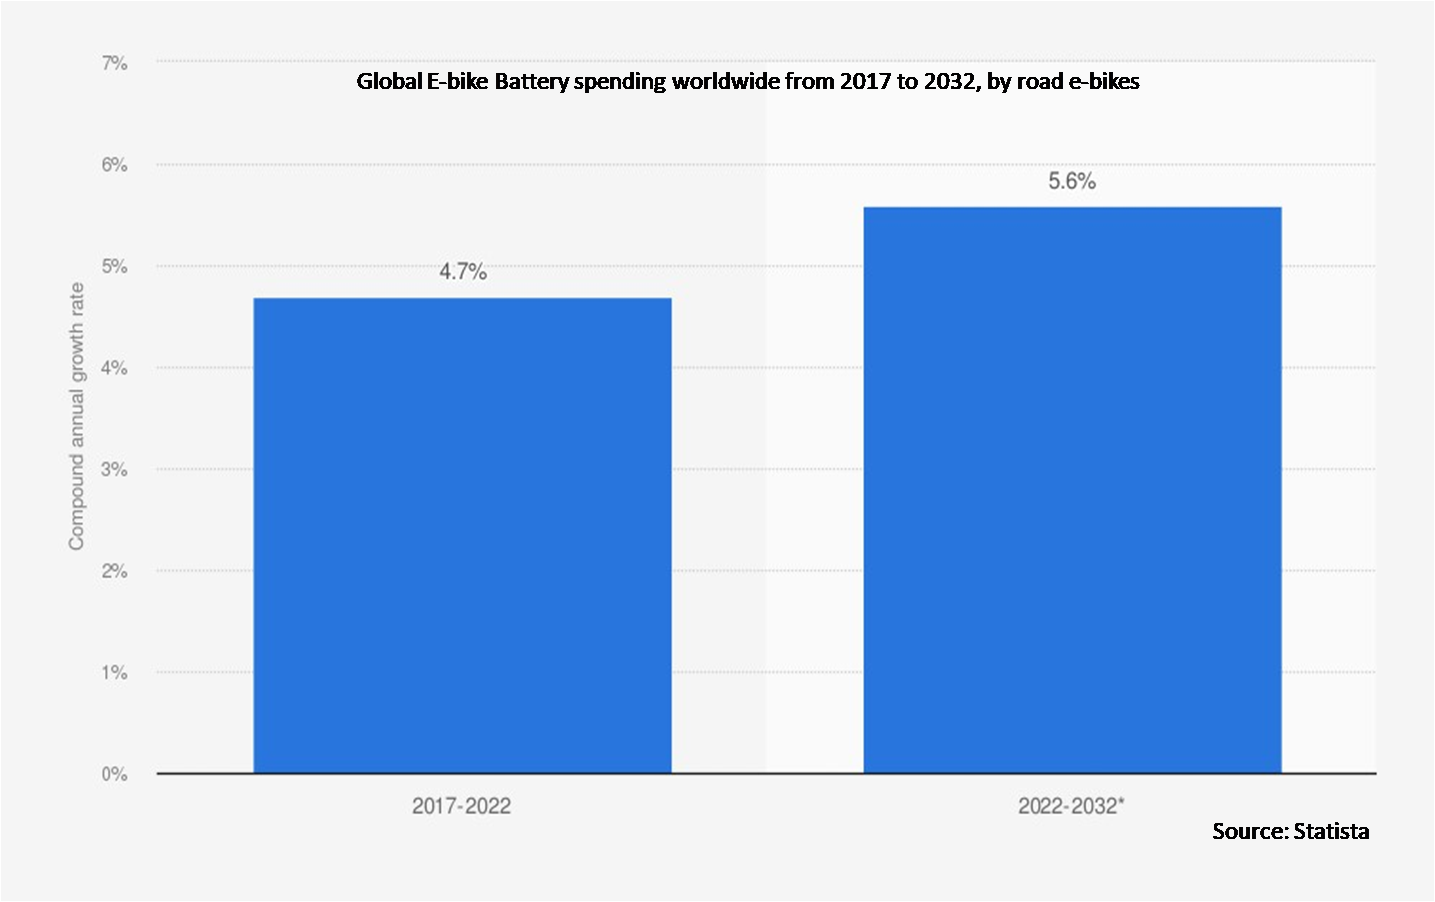
The road e-bikes segment is expected to be the largest during the forecast period
The road e-bikes segment is estimated to register the largest market share. Road e-bikes are designed for high-speed, efficient, and long-distance travel on paved surfaces. They feature lightweight frames, aerodynamic designs, and powerful motors that assist riders in achieving faster speeds and covering greater distances with less effort. Ideal for commuters and enthusiasts, road e-bikes offer enhanced performance and comfort, combining the advantages of traditional road bikes with the added boost of electric assistance. Their growing popularity reflects the increasing demand for efficient, eco-friendly transportation solutions.
The personal use segment is expected to have the highest CAGR during the forecast period
The personal use segment is anticipated to witness the highest CAGR during the forecast period. E-bikes in personal use applications provide a convenient, eco-friendly alternative for daily commuting, leisure rides, and short-distance travel. They offer electric assistance to make pedalling easier and reduce travel time, enhancing comfort and efficiency. Ideal for navigating urban environments, e-bikes help avoid traffic congestion and reduce reliance on fossil fuels. Their growing popularity is driven by their affordability, ease of use, and positive environmental impact, making them a preferred choice for personal transportation needs.
Region with largest share:
Asia Pacific is expected to have the largest market share during the forecast period driven by the increasing popularity of e-bikes, rising urbanization, and supportive government policies promoting green transportation. Countries like China, Japan, and India are key markets due to their large population bases and growing focus on sustainable transport solutions. The region's rapidly evolving infrastructure and rising consumer awareness of environmental issues further contribute to the market's positive outlook.
Region with highest CAGR:
North America is projected to witness the highest CAGR over the forecast period, owing to rising consumer interest in sustainable and efficient transportation options. Increased awareness of environmental benefits and advancements in battery technology are driving growth. The U.S. and Canada are seeing a surge in e-bike adoption, supported by favorable government policies and incentives. The growing urban population and the push for healthier lifestyles are also contributing to market expansion. Enhanced charging infrastructure and improved battery performance further support the positive market trajectory in the region.

Key players in the market
Some of the key players profiled in the E-bike Battery Market include Bosch, Shimano, Panasonic, LG Chem, Samsung SDI, Yamaha, Stromer, BionX, Celltech, EVE Energy Corporation, Amperex Technology Limited (ATL), Kokam, Sanyo, Odyssey Battery, Xiaomi and Okaya Batteries.
Key Developments:
In May 2024, Okaya's premium brand Ferrato launched its first product - an electric bike. Named as the ""Disruptor"", the electric bike costed as low as Rs 1.4 lakh in Delhi after including EV subsidies. The bike claims a range of 129 km on a single charge. Its PMSM center motor chain-driven system boasts a peak power of 6.37 kW with a top speed of 95 km/h in three dynamic drive modes - Eco, City, and Sports.
In July 2023, Stromer, a prominent e-bike manufacturer, has introduced a groundbreaking advancement in battery technology with the unveiling of the first solid-state battery for the e-bike industry. Stromer’s adoption of this technology positions it as a leader in innovation within the e-bike industry.
E-Bike Types Covered:
• City/Commuter E-Bikes
• Mountain E-Bikes
• Road E-Bikes
• Folding E-Bikes
• Cargo E-Bikes
• Other E-Bike Types
Battery Types Covered:
• Lithium-Ion (Li-Ion)
• Lithium Iron Phosphate (LiFePO4)
• Nickel-Metal Hydride (NiMH)
• Lead-Acid
• Other Battery Types
Battery Capacities Covered:
• Less Than 300 Wh
• 300 Wh to 500 Wh
• 500 Wh to 700 Wh
• More Than 700 Wh
Battery Configurations Covered:
• Removable Batteries
• Integrated Batteries
Sales Channels Covered:
• Online Sales
• Retail Stores
• OEM (Original Equipment Manufacturer)
• Other Sales Channels
End Users Covered:
• Personal Use
• Commercial Use
• Industrial Use
Regions Covered:
• North America
o US
o Canada
o Mexico
• Europe
o Germany
o UK
o Italy
o France
o Spain
o Rest of Europe
• Asia Pacific
o Japan
o China
o India
o Australia
o New Zealand
o South Korea
o Rest of Asia Pacific
• South America
o Argentina
o Brazil
o Chile
o Rest of South America
• Middle East & Africa
o Saudi Arabia
o UAE
o Qatar
o South Africa
o Rest of Middle East & Africa
What our report offers:
- Market share assessments for the regional and country-level segments
- Strategic recommendations for the new entrants
- Covers Market data for the years 2022, 2023, 2024, 2026, and 2030
- Market Trends (Drivers, Constraints, Opportunities, Threats, Challenges, Investment Opportunities, and recommendations)
- Strategic recommendations in key business segments based on the market estimations
- Competitive landscaping mapping the key common trends
- Company profiling with detailed strategies, financials, and recent developments
- Supply chain trends mapping the latest technological advancements
Free Customization Offerings:
All the customers of this report will be entitled to receive one of the following free customization options:
• Company Profiling
o Comprehensive profiling of additional market players (up to 3)
o SWOT Analysis of key players (up to 3)
• Regional Segmentation
o Market estimations, Forecasts and CAGR of any prominent country as per the client's interest (Note: Depends on feasibility check)
• Competitive Benchmarking
o Benchmarking of key players based on product portfolio, geographical presence, and strategic alliances
Table of Contents
1 Executive Summary
2 Preface
2.1 Abstract
2.2 Stake Holders
2.3 Research Scope
2.4 Research Methodology
2.4.1 Data Mining
2.4.2 Data Analysis
2.4.3 Data Validation
2.4.4 Research Approach
2.5 Research Sources
2.5.1 Primary Research Sources
2.5.2 Secondary Research Sources
2.5.3 Assumptions
3 Market Trend Analysis
3.1 Introduction
3.2 Drivers
3.3 Restraints
3.4 Opportunities
3.5 Threats
3.6 End User Analysis
3.7 Emerging Markets
3.8 Impact of Covid-19
4 Porters Five Force Analysis
4.1 Bargaining power of suppliers
4.2 Bargaining power of buyers
4.3 Threat of substitutes
4.4 Threat of new entrants
4.5 Competitive rivalry
5 Global E-bike Battery Market, By E-Bike Type
5.1 Introduction
5.2 City/Commuter E-Bikes
5.3 Mountain E-Bikes
5.4 Road E-Bikes
5.5 Folding E-Bikes
5.6 Cargo E-Bikes
5.7 Other E-Bike Types
6 Global E-bike Battery Market, By Battery Type
6.1 Introduction
6.2 Lithium-Ion (Li-Ion)
6.3 Lithium Iron Phosphate (LiFePO4)
6.4 Nickel-Metal Hydride (NiMH)
6.5 Lead-Acid
6.6 Other Battery Types
7 Global E-bike Battery Market, By Battery Capacity
7.1 Introduction
7.2 Less Than 300 Wh
7.3 300 Wh to 500 Wh
7.4 500 Wh to 700 Wh
7.5 More Than 700 Wh
8 Global E-bike Battery Market, By Battery Configuration
8.1 Introduction
8.2 Removable Batteries
8.3 Integrated Batteries
9 Global E-bike Battery Market, By Sales Channel
9.1 Introduction
9.2 Online Sales
9.3 Retail Stores
9.4 OEM (Original Equipment Manufacturer)
9.5 Other Sales Channels
10 Global E-bike Battery Market, By End User
10.1 Introduction
10.2 Personal Use
10.3 Commercial Use
10.4 Industrial Use
11 Global E-bike Battery Market, By Geography
11.1 Introduction
11.2 North America
11.2.1 US
11.2.2 Canada
11.2.3 Mexico
11.3 Europe
11.3.1 Germany
11.3.2 UK
11.3.3 Italy
11.3.4 France
11.3.5 Spain
11.3.6 Rest of Europe
11.4 Asia Pacific
11.4.1 Japan
11.4.2 China
11.4.3 India
11.4.4 Australia
11.4.5 New Zealand
11.4.6 South Korea
11.4.7 Rest of Asia Pacific
11.5 South America
11.5.1 Argentina
11.5.2 Brazil
11.5.3 Chile
11.5.4 Rest of South America
11.6 Middle East & Africa
11.6.1 Saudi Arabia
11.6.2 UAE
11.6.3 Qatar
11.6.4 South Africa
11.6.5 Rest of Middle East & Africa
12 Key Developments
12.1 Agreements, Partnerships, Collaborations and Joint Ventures
12.2 Acquisitions & Mergers
12.3 New Product Launch
12.4 Expansions
12.5 Other Key Strategies
13 Company Profiling
13.1 Bosch
13.2 Shimano
13.3 Panasonic
13.4 LG Chem
13.5 Samsung SDI
13.6 Yamaha
13.7 Stromer
13.8 BionX
13.9 Celltech
13.10 EVE Energy Corporation
13.11 Amperex Technology Limited (ATL)
13.12 Kokam
13.13 Sanyo
13.14 Odyssey Battery
13.15 Xiaomi
13.16 Okaya Batteries
List of Tables
1 Global E-bike Battery Market Outlook, By Region (2022-2030) ($MN)
2 Global E-bike Battery Market Outlook, By E-Bike Type (2022-2030) ($MN)
3 Global E-bike Battery Market Outlook, By City/Commuter E-Bikes (2022-2030) ($MN)
4 Global E-bike Battery Market Outlook, By Mountain E-Bikes (2022-2030) ($MN)
5 Global E-bike Battery Market Outlook, By Road E-Bikes (2022-2030) ($MN)
6 Global E-bike Battery Market Outlook, By Folding E-Bikes (2022-2030) ($MN)
7 Global E-bike Battery Market Outlook, By Cargo E-Bikes (2022-2030) ($MN)
8 Global E-bike Battery Market Outlook, By Other E-Bike Types (2022-2030) ($MN)
9 Global E-bike Battery Market Outlook, By Battery Type (2022-2030) ($MN)
10 Global E-bike Battery Market Outlook, By Lithium-Ion (Li-Ion) (2022-2030) ($MN)
11 Global E-bike Battery Market Outlook, By Lithium Iron Phosphate (LiFePO4) (2022-2030) ($MN)
12 Global E-bike Battery Market Outlook, By Nickel-Metal Hydride (NiMH) (2022-2030) ($MN)
13 Global E-bike Battery Market Outlook, By Lead-Acid (2022-2030) ($MN)
14 Global E-bike Battery Market Outlook, By Other Battery Types (2022-2030) ($MN)
15 Global E-bike Battery Market Outlook, By Battery Capacity (2022-2030) ($MN)
16 Global E-bike Battery Market Outlook, By Less Than 300 Wh (2022-2030) ($MN)
17 Global E-bike Battery Market Outlook, By 300 Wh to 500 Wh (2022-2030) ($MN)
18 Global E-bike Battery Market Outlook, By 500 Wh to 700 Wh (2022-2030) ($MN)
19 Global E-bike Battery Market Outlook, By More Than 700 Wh (2022-2030) ($MN)
20 Global E-bike Battery Market Outlook, By Battery Configuration (2022-2030) ($MN)
21 Global E-bike Battery Market Outlook, By Removable Batteries (2022-2030) ($MN)
22 Global E-bike Battery Market Outlook, By Integrated Batteries (2022-2030) ($MN)
23 Global E-bike Battery Market Outlook, By Sales Channel (2022-2030) ($MN)
24 Global E-bike Battery Market Outlook, By Online Sales (2022-2030) ($MN)
25 Global E-bike Battery Market Outlook, By Retail Stores (2022-2030) ($MN)
26 Global E-bike Battery Market Outlook, By OEM (Original Equipment Manufacturer) (2022-2030) ($MN)
27 Global E-bike Battery Market Outlook, By Other Sales Channels (2022-2030) ($MN)
28 Global E-bike Battery Market Outlook, By End User (2022-2030) ($MN)
29 Global E-bike Battery Market Outlook, By Personal Use (2022-2030) ($MN)
30 Global E-bike Battery Market Outlook, By Commercial Use (2022-2030) ($MN)
31 Global E-bike Battery Market Outlook, By Industrial Use (2022-2030) ($MN)
Note: Tables for North America, Europe, APAC, South America, and Middle East & Africa Regions are also represented in the same manner as above.
List of Figures
RESEARCH METHODOLOGY

We at ‘Stratistics’ opt for an extensive research approach which involves data mining, data validation, and data analysis. The various research sources include in-house repository, secondary research, competitor’s sources, social media research, client internal data, and primary research.
Our team of analysts prefers the most reliable and authenticated data sources in order to perform the comprehensive literature search. With access to most of the authenticated data bases our team highly considers the best mix of information through various sources to obtain extensive and accurate analysis.
Each report takes an average time of a month and a team of 4 industry analysts. The time may vary depending on the scope and data availability of the desired market report. The various parameters used in the market assessment are standardized in order to enhance the data accuracy.
Data Mining
The data is collected from several authenticated, reliable, paid and unpaid sources and is filtered depending on the scope & objective of the research. Our reports repository acts as an added advantage in this procedure. Data gathering from the raw material suppliers, distributors and the manufacturers is performed on a regular basis, this helps in the comprehensive understanding of the products value chain. Apart from the above mentioned sources the data is also collected from the industry consultants to ensure the objective of the study is in the right direction.
Market trends such as technological advancements, regulatory affairs, market dynamics (Drivers, Restraints, Opportunities and Challenges) are obtained from scientific journals, market related national & international associations and organizations.
Data Analysis
From the data that is collected depending on the scope & objective of the research the data is subjected for the analysis. The critical steps that we follow for the data analysis include:
- Product Lifecycle Analysis
- Competitor analysis
- Risk analysis
- Porters Analysis
- PESTEL Analysis
- SWOT Analysis
The data engineering is performed by the core industry experts considering both the Marketing Mix Modeling and the Demand Forecasting. The marketing mix modeling makes use of multiple-regression techniques to predict the optimal mix of marketing variables. Regression factor is based on a number of variables and how they relate to an outcome such as sales or profits.
Data Validation
The data validation is performed by the exhaustive primary research from the expert interviews. This includes telephonic interviews, focus groups, face to face interviews, and questionnaires to validate our research from all aspects. The industry experts we approach come from the leading firms, involved in the supply chain ranging from the suppliers, distributors to the manufacturers and consumers so as to ensure an unbiased analysis.
We are in touch with more than 15,000 industry experts with the right mix of consultants, CEO's, presidents, vice presidents, managers, experts from both supply side and demand side, executives and so on.
The data validation involves the primary research from the industry experts belonging to:
- Leading Companies
- Suppliers & Distributors
- Manufacturers
- Consumers
- Industry/Strategic Consultants
Apart from the data validation the primary research also helps in performing the fill gap research, i.e. providing solutions for the unmet needs of the research which helps in enhancing the reports quality.
For more details about research methodology, kindly write to us at info@strategymrc.com
Frequently Asked Questions
In case of any queries regarding this report, you can contact the customer service by filing the “Inquiry Before Buy” form available on the right hand side. You may also contact us through email: info@strategymrc.com or phone: +1-301-202-5929
Yes, the samples are available for all the published reports. You can request them by filling the “Request Sample” option available in this page.
Yes, you can request a sample with your specific requirements. All the customized samples will be provided as per the requirement with the real data masked.
All our reports are available in Digital PDF format. In case if you require them in any other formats, such as PPT, Excel etc you can submit a request through “Inquiry Before Buy” form available on the right hand side. You may also contact us through email: info@strategymrc.com or phone: +1-301-202-5929
We offer a free 15% customization with every purchase. This requirement can be fulfilled for both pre and post sale. You may send your customization requirements through email at info@strategymrc.com or call us on +1-301-202-5929.
We have 3 different licensing options available in electronic format.
- Single User Licence: Allows one person, typically the buyer, to have access to the ordered product. The ordered product cannot be distributed to anyone else.
- 2-5 User Licence: Allows the ordered product to be shared among a maximum of 5 people within your organisation.
- Corporate License: Allows the product to be shared among all employees of your organisation regardless of their geographical location.
All our reports are typically be emailed to you as an attachment.
To order any available report you need to register on our website. The payment can be made either through CCAvenue or PayPal payments gateways which accept all international cards.
We extend our support to 6 months post sale. A post sale customization is also provided to cover your unmet needs in the report.
Request Customization
We offer complimentary customization of up to 15% with every purchase. To share your customization requirements, feel free to email us at info@strategymrc.com or call us on +1-301-202-5929. .
Please Note: Customization within the 15% threshold is entirely free of charge. If your request exceeds this limit, we will conduct a feasibility assessment. Following that, a detailed quote and timeline will be provided.
WHY CHOOSE US ?

Assured Quality
Best in class reports with high standard of research integrity

24X7 Research Support
Continuous support to ensure the best customer experience.

Free Customization
Adding more values to your product of interest.

Safe & Secure Access
Providing a secured environment for all online transactions.

Trusted by 600+ Brands
Serving the most reputed brands across the world.