
Electric Utility Vehicle Market
Electric Utility Vehicle Market Forecasts to 2032 - Global Analysis By Vehicle Type (Golf Carts, Shuttle Vehicles, Industrial Utility Vehicles, Commercial Utility Vehicles, Military Utility Vehicles and Other Vehicle Types), Propulsion Type, Battery Type, Drive Type, Payload, Range per Charge, Application, End User and By Geography

|
Years Covered |
2024-2032 |
|
Estimated Year Value (2025) |
US $22.2 BN |
|
Projected Year Value (2032) |
US $32.5 BN |
|
CAGR (2025-2032) |
5.6% |
|
Regions Covered |
North America, Europe, Asia Pacific, South America, and Middle East & Africa |
|
Countries Covered |
US, Canada, Mexico, Germany, UK, Italy, France, Spain, Japan, China, India, Australia, New Zealand, South Korea, Rest of Asia Pacific, South America, Argentina, Brazil, Chile, Middle East & Africa, Saudi Arabia, UAE, Qatar, and South Africa |
|
Largest Market |
North America |
|
Highest Growing Market |
Asia Pacific |
According to Stratistics MRC, the Global Electric Utility Vehicle Market is accounted for $22.2 billion in 2025 and is expected to reach $32.5 billion by 2032, growing at a CAGR of 5.6% during the forecast period. A vehicle that is powered by electricity, usually from batteries, and intended for specific utility uses rather than general passenger transportation is known as an electric utility vehicle (EUV). These vehicles are used for hauling, carrying equipment, and moving people within a certain region in various industries, including municipal services, construction, agriculture, and logistics. Benefits of their electric drivetrain include fewer operating costs and pollutants.
According to data from the Ministry of Heavy Industries, around 0.52 million EVs were registered in India over the past three years, with Uttar Pradesh leading in total EV sales in 2023, followed by Karnataka and Tamil Nadu.
Market Dynamics:
Driver:
Lower operating costs
The reduced operational expenses of electric utility vehicles (EUVs) are a major catalyst for market expansion. These necessitate reduced maintenance relative to internal combustion engine (ICE) vehicles owing to a diminished number of moving components and the absence of oil change requirements. Moreover, electricity as an energy source is typically more economical than gasoline or diesel, thereby decreasing operational expenses. This cost-effectiveness is especially attractive to enterprises and governments that depend on fleets, allowing them to realize long-term savings while adhering to environmental objectives.
Restraint:
Battery limitations
Contemporary battery technologies frequently encounter constraints related to restricted driving range, protracted charge durations, and performance deterioration over time. These challenges may impede the use of EUVs, particularly in applications necessitating prolonged working hours or demanding activities. Moreover, the substantial upfront expenses associated with sophisticated batteries such as lithium-ion may dissuade prospective purchasers, especially in price-sensitive sectors.
Opportunity:
Expansion of charging infrastructure
The proliferation of charging infrastructure presents a substantial opportunity for the electric utility vehicle sector. As governments and commercial organizations invest in the development of extensive and efficient charging networks, range anxiety among consumers decreases, promoting further use of electric utility vehicles (EUVs). Furthermore, advancements like rapid-charging stations and battery-swapping technology improve convenience and operational efficacy. This advancement not only assists current EUV users but also entices new clientele by mitigating a principal obstacle to EV adoption.
Threat:
Competition from conventional vehicles
Competition from traditional vehicles continues to pose a threat to the electric utility vehicle market. Conventional internal combustion engine automobiles typically exhibit reduced initial expenses and possess a well-established refueling infrastructure, rendering them more attainable for specific clients. Moreover, developments in internal combustion engine technology designed to enhance fuel efficiency and diminish pollutants may pose additional challenges to the adoption of electric utility vehicles.
Covid-19 Impact:
The Covid-19 epidemic has varied impacts on the electric utility vehicle market. In the short term, supply chain interruptions and diminished consumer expenditure resulted in a decline in the production and sales of EUVs worldwide. The epidemic underscored the significance of sustainable transportation solutions as governments prioritized green recovery activities. The heightened awareness of environmental advantages following the epidemic has stimulated investments in electric vehicles (EUVs) and charging infrastructure. As economies rebound, these elements are anticipated to propel sustained expansion in the market.
The battery electric vehicle (BEV) segment is expected to be the largest during the forecast period
The battery electric vehicle (BEV) segment is expected to account for the largest market share during the forecast period because of its zero-emission characteristics and the growing customer preference for sustainable alternatives. Improvements in battery technologies have increased vehicle range and reduced costs, rendering BEVs more accessible to a broader demographic. Furthermore, governmental incentives, including tax credits and subsidies, have markedly enhanced the global adoption of battery electric vehicles (BEVs). The increasing accessibility of charging infrastructure enhances this tendency by mitigating range anxiety among consumers. As a result, BEVs are poised to retain their dominant position in the electric utility vehicle market.
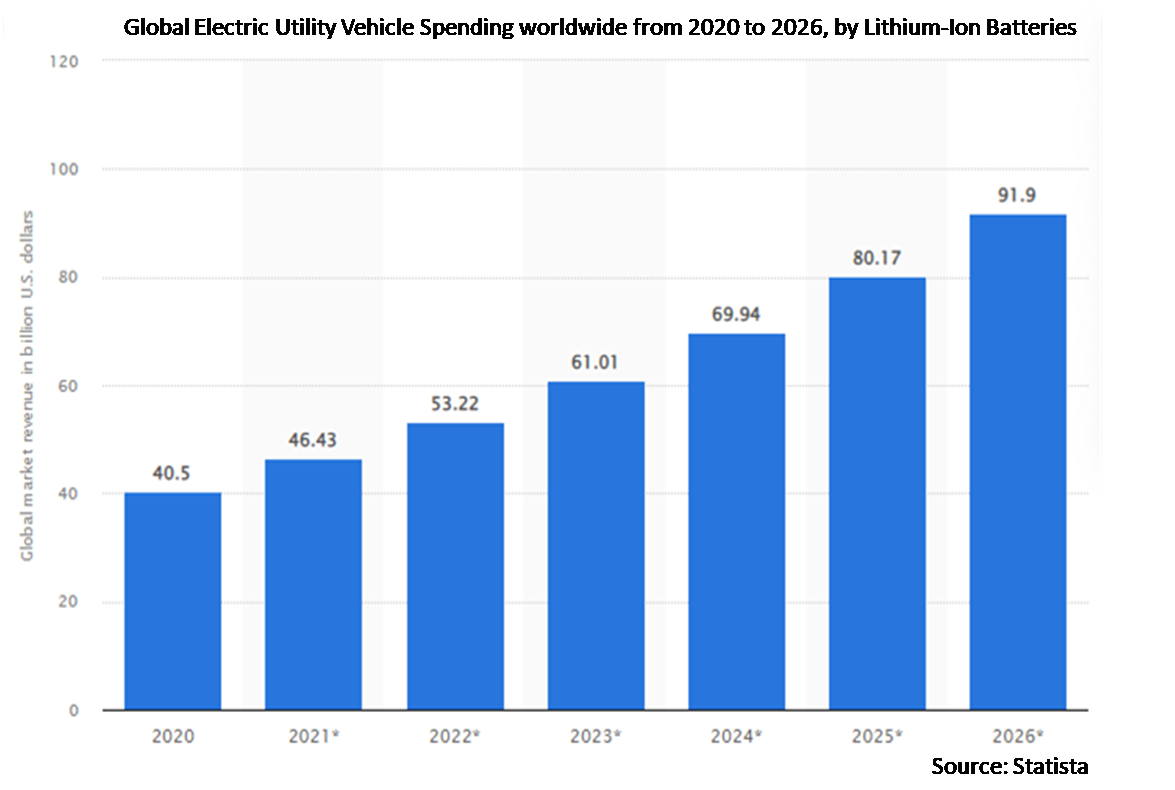
The lithium-ion batteries segment is expected to have the highest CAGR during the forecast period
Over the forecast period, the lithium-ion batteries segment is predicted to witness the highest growth rate due to their greater energy density, extended longevity, and decreasing production costs relative to other battery types. Due to their ability to meet high performance standards and maintain efficiency, these batteries find extensive use in various applications. Moreover, continuous advancements in lithium-ion technology seek to enhance safety features and minimize environmental impact, accelerating their utilization in electric utility cars. The global demand for high-performance batteries is increasing, positioning this sector for significant expansion.
Region with largest share:
During the forecast period, the North America region is expected to hold the largest market share attributable to strong governmental policies that advocate for electric mobility via incentives like tax credits and rebates. The region's established automotive sector has adopted electrification through substantial expenditures in electric vehicle production and infrastructure development. Furthermore, increasing consumer awareness regarding environmental sustainability has propelled demand for EUVs in both commercial and municipal sectors. Advancements in battery technology are decreasing costs and enhancing performance, positioning North America as a pivotal contributor to the global electric utility vehicle industry.
Region with highest CAGR:
Over the forecast period, the Asia Pacific region is anticipated to exhibit the highest CAGR, owing to robust governmental support for electric vehicle (EV) adoption via subsidies and infrastructure expenditures. China spearheads this expansion with its comprehensive manufacturing capabilities and policy-oriented activities designed to mitigate emissions. Countries such as India and Japan are making substantial contributions by promoting domestic electric vehicle manufacture and enhancing charging infrastructure. The region's supremacy in battery production enhances its status as a global leader in electric vehicle development. This confluence of circumstances establishes Asia Pacific as a swiftly expanding market for electric utility vehicles.

Key players in the market
Some of the key players in Electric Utility Vehicle Market include Polaris Inc., Club Car LLC, Toyota Industries Corporation, John Deere, Textron Inc., Addax Motors, Alke, BYD Company Limited, Columbia Vehicle Group Inc., HISUN Motors, Marshell Green Power, Star EV Corporation, Yamaha Motors, Hyster-Yale, Inc., and Landmaster.
Key Developments:
In December 2024, John Deere has launched its new diesel Gator XUV 875M utility vehicle. The new Gator model’s key features include a 22.8hp engine with a fuel tank volume of 42.4 litres, a seating capacity for three (suitable for off-road use), a cargo box capacity of 454kg, and fully independent suspension with 203/229mm travel (front/rear). The Gator XUV 875M builds on the reliability of previous models with an updated rear suspension design and tuned shock absorbers to enhance comfort.
In February 2024, Polaris is launching an electric version of its heavy-duty Pro XD utility vehicle for applications in construction, equipment rental and industry. The Pro XD Kinetic vehicle – a heavier duty version of its Ranger electric utility truck – uses a 14.9kWh Lithium-Ion battery to provide 140lb-ft (190Nm) of instant torque and the ability to tow up to 2,500lbs (1,133kg) and haul up to 1,250lbs (566kg). It has a range of up to 45 miles (72.4km) on a single charge. The vehicle will make its deput at the ARA Show for the rental sector in New Orleans, USA, on 19 to 21 February.
In March 2023, Club Car, a world-leading manufacturer of small-wheel, zero-emissions electric vehicles, is rolling out its latest street-legal electric vehicle, the Club Car Urban LSV and XR that are now available through our commercial distributor network in North America. The new urban platform expands Club Car’s leading electric vehicle portfolio, which has been prominent in commercial markets for decades.
Vehicle Types Covered:
• Golf Carts
• Shuttle Vehicles
• Industrial Utility Vehicles
• Commercial Utility Vehicles
• Military Utility Vehicles
• Other Vehicle Types
Propulsion Types Covered:
• Battery Electric Vehicle (BEV)
• Hybrid Electric Vehicle (HEV)
Battery Types Covered:
• Lithium-Ion Batteries
• Lead-Acid Batteries
• Nickel-Metal Hydride (NiMH) Batteries
• Other Battery Types
Drive Types Covered:
• 2WD
• 4WD
• AWD
Payloads Covered:
• Up to 500 kg
• 500 - 1000 kg
• Above 1000 kg
Range per Charges Covered:
• Less than 50 km
• 50-100 km
• 100-200 km
• Above 200 km
Applications Covered:
• Agriculture
• Construction
• Last-Mile Delivery
• Mining
• Tourism and Hospitality
• Municipal Services
• Other Applications
End Users Covered:
• Commercial
• Individual Users
• Government and Public Sector
• Industrial
Regions Covered:
• North America
o US
o Canada
o Mexico
• Europe
o Germany
o UK
o Italy
o France
o Spain
o Rest of Europe
• Asia Pacific
o Japan
o China
o India
o Australia
o New Zealand
o South Korea
o Rest of Asia Pacific
• South America
o Argentina
o Brazil
o Chile
o Rest of South America
• Middle East & Africa
o Saudi Arabia
o UAE
o Qatar
o South Africa
o Rest of Middle East & Africa
What our report offers:
- Market share assessments for the regional and country-level segments
- Strategic recommendations for the new entrants
- Covers Market data for the years 2024, 2025, 2026, 2028, and 2032
- Market Trends (Drivers, Constraints, Opportunities, Threats, Challenges, Investment Opportunities, and recommendations)
- Strategic recommendations in key business segments based on the market estimations
- Competitive landscaping mapping the key common trends
- Company profiling with detailed strategies, financials, and recent developments
- Supply chain trends mapping the latest technological advancements
Free Customization Offerings:
All the customers of this report will be entitled to receive one of the following free customization options:
• Company Profiling
o Comprehensive profiling of additional market players (up to 3)
o SWOT Analysis of key players (up to 3)
• Regional Segmentation
o Market estimations, Forecasts and CAGR of any prominent country as per the client's interest (Note: Depends on feasibility check)
• Competitive Benchmarking
o Benchmarking of key players based on product portfolio, geographical presence, and strategic alliances
Table of Contents
1 Executive Summary
2 Preface
2.1 Abstract
2.2 Stake Holders
2.3 Research Scope
2.4 Research Methodology
2.4.1 Data Mining
2.4.2 Data Analysis
2.4.3 Data Validation
2.4.4 Research Approach
2.5 Research Sources
2.5.1 Primary Research Sources
2.5.2 Secondary Research Sources
2.5.3 Assumptions
3 Market Trend Analysis
3.1 Introduction
3.2 Drivers
3.3 Restraints
3.4 Opportunities
3.5 Threats
3.6 Application Analysis
3.7 End User Analysis
3.8 Emerging Markets
3.9 Impact of Covid-19
4 Porters Five Force Analysis
4.1 Bargaining power of suppliers
4.2 Bargaining power of buyers
4.3 Threat of substitutes
4.4 Threat of new entrants
4.5 Competitive rivalry
5 Global Electric Utility Vehicle Market, By Vehicle Type
5.1 Introduction
5.2 Golf Carts
5.3 Shuttle Vehicles
5.4 Industrial Utility Vehicles
5.5 Commercial Utility Vehicles
5.6 Military Utility Vehicles
5.7 Other Vehicle Types
6 Global Electric Utility Vehicle Market, By Propulsion Type
6.1 Introduction
6.2 Battery Electric Vehicle (BEV)
6.3 Hybrid Electric Vehicle (HEV)
7 Global Electric Utility Vehicle Market, By Battery Type
7.1 Introduction
7.2 Lithium-Ion Batteries
7.3 Lead-Acid Batteries
7.4 Nickel-Metal Hydride (NiMH) Batteries
7.5 Other Battery Types
8 Global Electric Utility Vehicle Market, By Drive Type
8.1 Introduction
8.2 2WD
8.3 4WD
8.4 AWD
9 Global Electric Utility Vehicle Market, By Payload
9.1 Introduction
9.2 Up to 500 kg
9.3 500 - 1000 kg
9.4 Above 1000 kg
10 Global Electric Utility Vehicle Market, By Range per Charge
10.1 Introduction
10.2 Less than 50 km
10.3 50-100 km
10.4 100-200 km
10.5 Above 200 km
11 Global Electric Utility Vehicle Market, By Application
11.1 Introduction
11.2 Agriculture
11.3 Construction
11.4 Last-Mile Delivery
11.5 Mining
11.6 Tourism and Hospitality
11.7 Municipal Services
11.7.1 Waste Management
11.7.2 Internal Transport Services
11.7.3 Street Cleaning and Maintenance
11.8 Other Applications
12 Global Electric Utility Vehicle Market, By End User
12.1 Introduction
12.2 Commercial
12.3 Individual Users
12.4 Government and Public Sector
12.5 Industrial
13 Global Electric Utility Vehicle Market, By Geography
13.1 Introduction
13.2 North America
13.2.1 US
13.2.2 Canada
13.2.3 Mexico
13.3 Europe
13.3.1 Germany
13.3.2 UK
13.3.3 Italy
13.3.4 France
13.3.5 Spain
13.3.6 Rest of Europe
13.4 Asia Pacific
13.4.1 Japan
13.4.2 China
13.4.3 India
13.4.4 Australia
13.4.5 New Zealand
13.4.6 South Korea
13.4.7 Rest of Asia Pacific
13.5 South America
13.5.1 Argentina
13.5.2 Brazil
13.5.3 Chile
13.5.4 Rest of South America
13.6 Middle East & Africa
13.6.1 Saudi Arabia
13.6.2 UAE
13.6.3 Qatar
13.6.4 South Africa
13.6.5 Rest of Middle East & Africa
14 Key Developments
14.1 Agreements, Partnerships, Collaborations and Joint Ventures
14.2 Acquisitions & Mergers
14.3 New Product Launch
14.4 Expansions
14.5 Other Key Strategies
15 Company Profiling
15.1 Polaris Inc.
15.2 Club Car LLC
15.3 Toyota Industries Corporation
15.4 John Deere
15.5 Textron Inc.
15.6 Addax Motors
15.7 Alke
15.8 BYD Company Limited
15.9 Columbia Vehicle Group Inc.
15.10 HISUN Motors
15.11 Marshell Green Power
15.12 Star EV Corporation
15.13 Yamaha Motors
15.14 Hyster-Yale, Inc.
15.15 Landmaster
List of Tables
1 Global Electric Utility Vehicle Market Outlook, By Region (2024-2032) ($MN)
2 Global Electric Utility Vehicle Market Outlook, By Vehicle Type (2024-2032) ($MN)
3 Global Electric Utility Vehicle Market Outlook, By Golf Carts (2024-2032) ($MN)
4 Global Electric Utility Vehicle Market Outlook, By Shuttle Vehicles (2024-2032) ($MN)
5 Global Electric Utility Vehicle Market Outlook, By Industrial Utility Vehicles (2024-2032) ($MN)
6 Global Electric Utility Vehicle Market Outlook, By Commercial Utility Vehicles (2024-2032) ($MN)
7 Global Electric Utility Vehicle Market Outlook, By Military Utility Vehicles (2024-2032) ($MN)
8 Global Electric Utility Vehicle Market Outlook, By Other Vehicle Types (2024-2032) ($MN)
9 Global Electric Utility Vehicle Market Outlook, By Propulsion Type (2024-2032) ($MN)
10 Global Electric Utility Vehicle Market Outlook, By Battery Electric Vehicle (BEV) (2024-2032) ($MN)
11 Global Electric Utility Vehicle Market Outlook, By Hybrid Electric Vehicle (HEV) (2024-2032) ($MN)
12 Global Electric Utility Vehicle Market Outlook, By Battery Type (2024-2032) ($MN)
13 Global Electric Utility Vehicle Market Outlook, By Lithium-Ion Batteries (2024-2032) ($MN)
14 Global Electric Utility Vehicle Market Outlook, By Lead-Acid Batteries (2024-2032) ($MN)
15 Global Electric Utility Vehicle Market Outlook, By Nickel-Metal Hydride (NiMH) Batteries (2024-2032) ($MN)
16 Global Electric Utility Vehicle Market Outlook, By Other Battery Types (2024-2032) ($MN)
17 Global Electric Utility Vehicle Market Outlook, By Drive Type (2024-2032) ($MN)
18 Global Electric Utility Vehicle Market Outlook, By 2WD (2024-2032) ($MN)
19 Global Electric Utility Vehicle Market Outlook, By 4WD (2024-2032) ($MN)
20 Global Electric Utility Vehicle Market Outlook, By AWD (2024-2032) ($MN)
21 Global Electric Utility Vehicle Market Outlook, By Payload (2024-2032) ($MN)
22 Global Electric Utility Vehicle Market Outlook, By Up to 500 kg (2024-2032) ($MN)
23 Global Electric Utility Vehicle Market Outlook, By 500 - 1000 kg (2024-2032) ($MN)
24 Global Electric Utility Vehicle Market Outlook, By Above 1000 kg (2024-2032) ($MN)
25 Global Electric Utility Vehicle Market Outlook, By Range per Charge (2024-2032) ($MN)
26 Global Electric Utility Vehicle Market Outlook, By Less than 50 km (2024-2032) ($MN)
27 Global Electric Utility Vehicle Market Outlook, By 50-100 km (2024-2032) ($MN)
28 Global Electric Utility Vehicle Market Outlook, By 100-200 km (2024-2032) ($MN)
29 Global Electric Utility Vehicle Market Outlook, By Above 200 km (2024-2032) ($MN)
30 Global Electric Utility Vehicle Market Outlook, By Application (2024-2032) ($MN)
31 Global Electric Utility Vehicle Market Outlook, By Agriculture (2024-2032) ($MN)
32 Global Electric Utility Vehicle Market Outlook, By Construction (2024-2032) ($MN)
33 Global Electric Utility Vehicle Market Outlook, By Last-Mile Delivery (2024-2032) ($MN)
34 Global Electric Utility Vehicle Market Outlook, By Mining (2024-2032) ($MN)
35 Global Electric Utility Vehicle Market Outlook, By Tourism and Hospitality (2024-2032) ($MN)
36 Global Electric Utility Vehicle Market Outlook, By Municipal Services (2024-2032) ($MN)
37 Global Electric Utility Vehicle Market Outlook, By Waste Management (2024-2032) ($MN)
38 Global Electric Utility Vehicle Market Outlook, By Internal Transport Services (2024-2032) ($MN)
39 Global Electric Utility Vehicle Market Outlook, By Street Cleaning and Maintenance (2024-2032) ($MN)
40 Global Electric Utility Vehicle Market Outlook, By Other Applications (2024-2032) ($MN)
41 Global Electric Utility Vehicle Market Outlook, By End User (2024-2032) ($MN)
42 Global Electric Utility Vehicle Market Outlook, By Commercial (2024-2032) ($MN)
43 Global Electric Utility Vehicle Market Outlook, By Individual Users (2024-2032) ($MN)
44 Global Electric Utility Vehicle Market Outlook, By Government and Public Sector (2024-2032) ($MN)
45 Global Electric Utility Vehicle Market Outlook, By Industrial (2024-2032) ($MN)
Note: Tables for North America, Europe, APAC, South America, and Middle East & Africa Regions are also represented in the same manner as above.
List of Figures
RESEARCH METHODOLOGY

We at ‘Stratistics’ opt for an extensive research approach which involves data mining, data validation, and data analysis. The various research sources include in-house repository, secondary research, competitor’s sources, social media research, client internal data, and primary research.
Our team of analysts prefers the most reliable and authenticated data sources in order to perform the comprehensive literature search. With access to most of the authenticated data bases our team highly considers the best mix of information through various sources to obtain extensive and accurate analysis.
Each report takes an average time of a month and a team of 4 industry analysts. The time may vary depending on the scope and data availability of the desired market report. The various parameters used in the market assessment are standardized in order to enhance the data accuracy.
Data Mining
The data is collected from several authenticated, reliable, paid and unpaid sources and is filtered depending on the scope & objective of the research. Our reports repository acts as an added advantage in this procedure. Data gathering from the raw material suppliers, distributors and the manufacturers is performed on a regular basis, this helps in the comprehensive understanding of the products value chain. Apart from the above mentioned sources the data is also collected from the industry consultants to ensure the objective of the study is in the right direction.
Market trends such as technological advancements, regulatory affairs, market dynamics (Drivers, Restraints, Opportunities and Challenges) are obtained from scientific journals, market related national & international associations and organizations.
Data Analysis
From the data that is collected depending on the scope & objective of the research the data is subjected for the analysis. The critical steps that we follow for the data analysis include:
- Product Lifecycle Analysis
- Competitor analysis
- Risk analysis
- Porters Analysis
- PESTEL Analysis
- SWOT Analysis
The data engineering is performed by the core industry experts considering both the Marketing Mix Modeling and the Demand Forecasting. The marketing mix modeling makes use of multiple-regression techniques to predict the optimal mix of marketing variables. Regression factor is based on a number of variables and how they relate to an outcome such as sales or profits.
Data Validation
The data validation is performed by the exhaustive primary research from the expert interviews. This includes telephonic interviews, focus groups, face to face interviews, and questionnaires to validate our research from all aspects. The industry experts we approach come from the leading firms, involved in the supply chain ranging from the suppliers, distributors to the manufacturers and consumers so as to ensure an unbiased analysis.
We are in touch with more than 15,000 industry experts with the right mix of consultants, CEO's, presidents, vice presidents, managers, experts from both supply side and demand side, executives and so on.
The data validation involves the primary research from the industry experts belonging to:
- Leading Companies
- Suppliers & Distributors
- Manufacturers
- Consumers
- Industry/Strategic Consultants
Apart from the data validation the primary research also helps in performing the fill gap research, i.e. providing solutions for the unmet needs of the research which helps in enhancing the reports quality.
For more details about research methodology, kindly write to us at info@strategymrc.com
Frequently Asked Questions
In case of any queries regarding this report, you can contact the customer service by filing the “Inquiry Before Buy” form available on the right hand side. You may also contact us through email: info@strategymrc.com or phone: +1-301-202-5929
Yes, the samples are available for all the published reports. You can request them by filling the “Request Sample” option available in this page.
Yes, you can request a sample with your specific requirements. All the customized samples will be provided as per the requirement with the real data masked.
All our reports are available in Digital PDF format. In case if you require them in any other formats, such as PPT, Excel etc you can submit a request through “Inquiry Before Buy” form available on the right hand side. You may also contact us through email: info@strategymrc.com or phone: +1-301-202-5929
We offer a free 15% customization with every purchase. This requirement can be fulfilled for both pre and post sale. You may send your customization requirements through email at info@strategymrc.com or call us on +1-301-202-5929.
We have 3 different licensing options available in electronic format.
- Single User Licence: Allows one person, typically the buyer, to have access to the ordered product. The ordered product cannot be distributed to anyone else.
- 2-5 User Licence: Allows the ordered product to be shared among a maximum of 5 people within your organisation.
- Corporate License: Allows the product to be shared among all employees of your organisation regardless of their geographical location.
All our reports are typically be emailed to you as an attachment.
To order any available report you need to register on our website. The payment can be made either through CCAvenue or PayPal payments gateways which accept all international cards.
We extend our support to 6 months post sale. A post sale customization is also provided to cover your unmet needs in the report.
Request Customization
We offer complimentary customization of up to 15% with every purchase. To share your customization requirements, feel free to email us at info@strategymrc.com or call us on +1-301-202-5929. .
Please Note: Customization within the 15% threshold is entirely free of charge. If your request exceeds this limit, we will conduct a feasibility assessment. Following that, a detailed quote and timeline will be provided.
WHY CHOOSE US ?

Assured Quality
Best in class reports with high standard of research integrity

24X7 Research Support
Continuous support to ensure the best customer experience.

Free Customization
Adding more values to your product of interest.

Safe & Secure Access
Providing a secured environment for all online transactions.

Trusted by 600+ Brands
Serving the most reputed brands across the world.