
Electric Vehicle Fluids Market
Electric Vehicle Fluids Market Forecasts to 2030 - Global Analysis By Product Type (Battery Coolants, Motor Coolants, Transmission Fluids, Brake Fluids, Dielectric Fluids and Greases), Vehicle Type (Passenger Vehicles, Commercial Vehicles and Two-Wheelers), Propulsion Type, Fill Type and By Geography

|
Years Covered |
2022-2030 |
|
Estimated Year Value (2024) |
US $934.6 MN |
|
Projected Year Value (2030) |
US $4449.1 MN |
|
CAGR (2024-2030) |
29.7% |
|
Regions Covered |
North America, Europe, Asia Pacific, South America, and Middle East & Africa |
|
Countries Covered |
US, Canada, Mexico, Germany, UK, Italy, France, Spain, Japan, China, India, Australia, New Zealand, South Korea, Rest of Asia Pacific, South America, Argentina, Brazil, Chile, Middle East & Africa, Saudi Arabia, UAE, Qatar, and South Africa |
|
Largest Market |
Asia Pacific |
|
Highest Growing Market |
Asia Pacific |
According to Stratistics MRC, the Global Electric Vehicle Fluids Market is accounted for $934.6 million in 2024 and is expected to reach $4449.1 million by 2030 growing at a CAGR of 29.7% during the forecast period. Specialized liquids known as electric vehicle fluids are essential to the longevity and functionality of electric vehicles (EVs). EVs have different cooling and lubrication requirements than internal combustion engines. These fluids include lubricants for gears and bearings in the drivetrain, which ensure smooth operation; brake fluids for hydraulic braking systems; specialized greases for different components; and coolants for batteries and motors, which control heat produced by electrical components. To guarantee safe and effective EV performance, these fluids frequently have particular electrical characteristics and material compatibility requirements.
According to the China Association of Automobile Manufacturers (CAAM), China continues to solidify its position as the world's leading automotive production hub. The production of battery-powered electric vehicles (EVs) in July 2022 surged by 117.3% compared to the same period in the previous year. This significant increase culminated in the production and sale of approximately 617,000 units within the month.
Market Dynamics:
Driver:
Growth in electric vehicle adoption
The increasing adoption of electric vehicles (EVs) due to environmental concerns, government incentives, and advancements in battery technology drives the demand for specialized EV fluids. These fluids, including battery coolants and e-transmission fluids, are essential for optimizing EV performance, ensuring thermal management, and extending vehicle lifespan. As EV production and sales rise globally, especially in regions like Asia Pacific and Europe, the need for efficient and durable fluids tailored to EV-specific requirements continues to grow, significantly boosting the market.
Restraint:
Limited EV infrastructure
Inadequate charging networks discourage potential buyers, slowing EV adoption rates and consequently reducing demand for EV fluids. This challenge is particularly pronounced in developing regions where infrastructure development lags. Additionally, the lack of standardized fluid requirements across various EV models complicates production and distribution, further hindering market growth.
Opportunity:
Expansion of EV models
The expansion of diverse EV models across segments such as passenger cars, commercial vehicles, and two-wheelers presents significant opportunities for the electric vehicle fluids market. Manufacturers are increasingly developing specialized fluids to cater to the unique requirements of different vehicle types. With automakers launching new models to meet growing consumer demand and government mandates for zero-emission vehicles, the need for advanced cooling, lubrication, and transmission fluids is expected to surge, driving market growth.
Threat:
High cost of electric vehicles
The high upfront cost of electric vehicles remains a major threat to the market. While governments provide subsidies and incentives to promote EV adoption, affordability remains a barrier for many consumers. This limits the overall penetration of EVs in price-sensitive markets, thereby constraining the demand for specialized EV fluids. Additionally, economic uncertainties and inflationary pressures can further deter consumers from transitioning to EVs, impacting market growth.
Covid-19 Impact:
The COVID-19 pandemic disrupted the electric vehicle fluids market due to halted manufacturing operations and supply chain interruptions. Reduced vehicle production and sales during lockdowns impacted demand for EV fluids. However, post-pandemic recovery efforts saw renewed investments in sustainable mobility solutions. Governments' focus on green recovery initiatives accelerated EV adoption, indirectly boosting demand for specialized fluids. The pandemic highlighted the importance of resilient supply chains and innovation in fluid technologies to support future growth.
The battery coolants segment is expected to be the largest during the forecast period
The battery coolants segment is expected to account for the largest market share during the forecast period due to its critical role in maintaining optimal battery temperature and ensuring thermal management in electric vehicles. These coolants enhance battery efficiency by preventing overheating or freezing, thereby extending battery life and improving overall performance. The segment’s growth is driven by advancements in coolant formulations tailored for high-performance batteries used in modern EVs. As battery technology evolves with higher energy densities, the demand for advanced cooling solutions continues to rise.
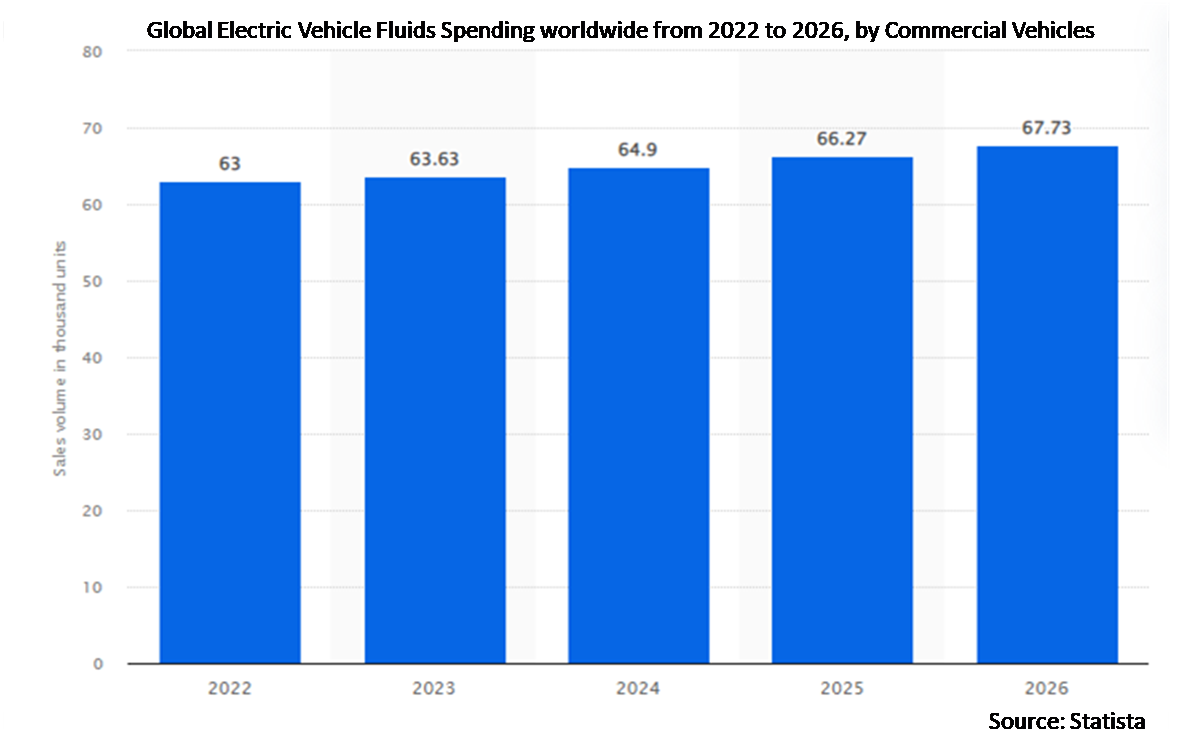
The commercial vehicles segment is expected to have the highest CAGR during the forecast period
Over the forecast period, the commercial vehicles segment is predicted to witness the highest growth rate due to increasing electrification of buses, trucks, and delivery vans driven by stringent emission regulations. These vehicles require robust thermal management systems due to their heavy-duty operations and extended usage hours. Specialized fluids designed for high-performance cooling and lubrication are essential for ensuring efficiency and durability. The growing adoption of electric commercial fleets by logistics companies further accelerates this segment’s growth.
Region with largest share:
During the forecast period, the Asia Pacific region is expected to hold the largest market share due to its leadership in EV production and sales, particularly in countries like China, Japan, and South Korea. Government initiatives promoting e-mobility through subsidies and investments in charging infrastructure drive regional growth. The presence of major automakers and fluid manufacturers further strengthens Asia Pacific’s dominance. Rising consumer awareness about sustainable transportation solutions also contributes significantly to the region’s leading position.
Region with highest CAGR:
Over the forecast period, the Asia Pacific region is anticipated to exhibit the highest CAGR due to rapid industrialization and increasing investments in EV manufacturing infrastructure. Countries like India are emerging as key players with growing domestic production capabilities supported by favorable government policies. The region’s expanding middle-class population drives demand for affordable electric mobility solutions, boosting fluid consumption across various vehicle types. Continuous advancements in battery technology further enhance Asia Pacific's growth trajectory.

Key players in the market
Some of the key players in Electric Vehicle Fluids Market include ExxonMobil Corporation, Shell plc, TotalEnergies SE, BP plc, FUCHS Petrolub AG, Valvoline Inc., PETRONAS, ENEOS Corporation, Repsol S.A., PTT Public Company Limited, Castrol Limited, Aramco, Lubrizol Corporation, Afton Chemical Corporation, Gulf Oil Lubricants India Limited, 3M Company, Electrolube Limited and Kluber Lubrication München GmbH & Co. KG.
Key Developments:
In November 2024, bp opened its first Gigahub™ in the Southern Hemisphere, located at New Zealand’s Christchurch Airport. New Zealand Prime Minister Christopher Luxon was on hand to officially open the hub, which has 12 fast EV charge points.
In October 2024, Aramco, a global integrated energy and chemicals company, and ENOWA, NEOM’s energy and Water Company, have signed a joint development agreement to construct and establish a first-of-its-kind synthetic electro fuel (e-fuel) demonstration plant. It will be located in ENOWA’s Hydrogen Innovation and Development Center (HIDC) and aims to demonstrate technical feasibility and commercial viability by producing 35 barrels per day of low-carbon, synthetic gasoline from renewable-based hydrogen and captured carbon dioxide (CO2).
Product Types Covered:
• Battery Coolants
• Motor Coolants
• Transmission Fluids
• Brake Fluids
• Dielectric Fluids
• Greases
Vehicle Types Covered:
• Passenger Vehicles
• Commercial Vehicles
• Two-Wheelers
Propulsion Types Covered:
• Battery Electric Vehicles (BEVs)
• Plug-in Hybrid Electric Vehicles (PHEVs)
• Hybrid Electric Vehicles (HEVs)
Fill Types Covered:
• First Fill
• Service Fill
Regions Covered:
• North America
o US
o Canada
o Mexico
• Europe
o Germany
o UK
o Italy
o France
o Spain
o Rest of Europe
• Asia Pacific
o Japan
o China
o India
o Australia
o New Zealand
o South Korea
o Rest of Asia Pacific
• South America
o Argentina
o Brazil
o Chile
o Rest of South America
• Middle East & Africa
o Saudi Arabia
o UAE
o Qatar
o South Africa
o Rest of Middle East & Africa
What our report offers:
- Market share assessments for the regional and country-level segments
- Strategic recommendations for the new entrants
- Covers Market data for the years 2022, 2023, 2024, 2026, and 2030
- Market Trends (Drivers, Constraints, Opportunities, Threats, Challenges, Investment Opportunities, and recommendations)
- Strategic recommendations in key business segments based on the market estimations
- Competitive landscaping mapping the key common trends
- Company profiling with detailed strategies, financials, and recent developments
- Supply chain trends mapping the latest technological advancements
Free Customization Offerings:
All the customers of this report will be entitled to receive one of the following free customization options:
• Company Profiling
o Comprehensive profiling of additional market players (up to 3)
o SWOT Analysis of key players (up to 3)
• Regional Segmentation
o Market estimations, Forecasts and CAGR of any prominent country as per the client's interest (Note: Depends on feasibility check)
• Competitive Benchmarking
Benchmarking of key players based on product portfolio, geographical presence, and strategic alliances
Table of Contents
1 Executive Summary
2 Preface
2.1 Abstract
2.2 Stake Holders
2.3 Research Scope
2.4 Research Methodology
2.4.1 Data Mining
2.4.2 Data Analysis
2.4.3 Data Validation
2.4.4 Research Approach
2.5 Research Sources
2.5.1 Primary Research Sources
2.5.2 Secondary Research Sources
2.5.3 Assumptions
3 Market Trend Analysis
3.1 Introduction
3.2 Drivers
3.3 Restraints
3.4 Opportunities
3.5 Threats
3.6 Product Analysis
3.7 Emerging Markets
3.8 Impact of Covid-19
4 Porters Five Force Analysis
4.1 Bargaining power of suppliers
4.2 Bargaining power of buyers
4.3 Threat of substitutes
4.4 Threat of new entrants
4.5 Competitive rivalry
5 Global Electric Vehicle Fluids Market, By Product Type
5.1 Introduction
5.2 Battery Coolants
5.3 Motor Coolants
5.4 Transmission Fluids
5.5 Brake Fluids
5.6 Dielectric Fluids
5.7 Greases
6 Global Electric Vehicle Fluids Market, By Vehicle Type
6.1 Introduction
6.2 Passenger Vehicles
6.3 Commercial Vehicles
6.3.1 Light Commercial Vehicles
6.3.2 Heavy Commercial Vehicles
6.4 Two-Wheelers
7 Global Electric Vehicle Fluids Market, By Propulsion Type
7.1 Introduction
7.2 Battery Electric Vehicles (BEVs)
7.3 Plug-in Hybrid Electric Vehicles (PHEVs)
7.4 Hybrid Electric Vehicles (HEVs)
8 Global Electric Vehicle Fluids Market, By Fill Type
8.1 Introduction
8.2 First Fill
8.3 Service Fill
9 Global Electric Vehicle Fluids Market, By Geography
9.1 Introduction
9.2 North America
9.2.1 US
9.2.2 Canada
9.2.3 Mexico
9.3 Europe
9.3.1 Germany
9.3.2 UK
9.3.3 Italy
9.3.4 France
9.3.5 Spain
9.3.6 Rest of Europe
9.4 Asia Pacific
9.4.1 Japan
9.4.2 China
9.4.3 India
9.4.4 Australia
9.4.5 New Zealand
9.4.6 South Korea
9.4.7 Rest of Asia Pacific
9.5 South America
9.5.1 Argentina
9.5.2 Brazil
9.5.3 Chile
9.5.4 Rest of South America
9.6 Middle East & Africa
9.6.1 Saudi Arabia
9.6.2 UAE
9.6.3 Qatar
9.6.4 South Africa
9.6.5 Rest of Middle East & Africa
10 Key Developments
10.1 Agreements, Partnerships, Collaborations and Joint Ventures
10.2 Acquisitions & Mergers
10.3 New Product Launch
10.4 Expansions
10.5 Other Key Strategies
11 Company Profiling
11.1 ExxonMobil Corporation
11.2 Shell plc
11.3 TotalEnergies SE
11.4 BP plc
11.5 FUCHS Petrolub AG
11.6 Valvoline Inc.
11.7 PETRONAS
11.8 ENEOS Corporation
11.9 Repsol S.A.
11.10 PTT Public Company Limited
11.11 Castrol Limited
11.12 Aramco
11.13 Lubrizol Corporation
11.14 Afton Chemical Corporation
11.15 Gulf Oil Lubricants India Limited
11.16 3M Company
11.17 Electrolube Limited
11.18 Kluber Lubrication München GmbH & Co. KG
List of Tables
1 Global Electric Vehicle Fluids Market Outlook, By Region (2022-2030) ($MN)
2 Global Electric Vehicle Fluids Market Outlook, By Product Type (2022-2030) ($MN)
3 Global Electric Vehicle Fluids Market Outlook, By Battery Coolants (2022-2030) ($MN)
4 Global Electric Vehicle Fluids Market Outlook, By Motor Coolants (2022-2030) ($MN)
5 Global Electric Vehicle Fluids Market Outlook, By Transmission Fluids (2022-2030) ($MN)
6 Global Electric Vehicle Fluids Market Outlook, By Brake Fluids (2022-2030) ($MN)
7 Global Electric Vehicle Fluids Market Outlook, By Dielectric Fluids (2022-2030) ($MN)
8 Global Electric Vehicle Fluids Market Outlook, By Greases (2022-2030) ($MN)
9 Global Electric Vehicle Fluids Market Outlook, By Vehicle Type (2022-2030) ($MN)
10 Global Electric Vehicle Fluids Market Outlook, By Passenger Vehicles (2022-2030) ($MN)
11 Global Electric Vehicle Fluids Market Outlook, By Commercial Vehicles (2022-2030) ($MN)
12 Global Electric Vehicle Fluids Market Outlook, By Light Commercial Vehicles (2022-2030) ($MN)
13 Global Electric Vehicle Fluids Market Outlook, By Heavy Commercial Vehicles (2022-2030) ($MN)
14 Global Electric Vehicle Fluids Market Outlook, By Two-Wheelers (2022-2030) ($MN)
15 Global Electric Vehicle Fluids Market Outlook, By Propulsion Type (2022-2030) ($MN)
16 Global Electric Vehicle Fluids Market Outlook, By Battery Electric Vehicles (BEVs) (2022-2030) ($MN)
17 Global Electric Vehicle Fluids Market Outlook, By Plug-in Hybrid Electric Vehicles (PHEVs) (2022-2030) ($MN)
18 Global Electric Vehicle Fluids Market Outlook, By Hybrid Electric Vehicles (HEVs) (2022-2030) ($MN)
19 Global Electric Vehicle Fluids Market Outlook, By Fill Type (2022-2030) ($MN)
20 Global Electric Vehicle Fluids Market Outlook, By First Fill (2022-2030) ($MN)
21 Global Electric Vehicle Fluids Market Outlook, By Service Fill (2022-2030) ($MN)
22 North America Electric Vehicle Fluids Market Outlook, By Country (2022-2030) ($MN)
23 North America Electric Vehicle Fluids Market Outlook, By Product Type (2022-2030) ($MN)
24 North America Electric Vehicle Fluids Market Outlook, By Battery Coolants (2022-2030) ($MN)
25 North America Electric Vehicle Fluids Market Outlook, By Motor Coolants (2022-2030) ($MN)
26 North America Electric Vehicle Fluids Market Outlook, By Transmission Fluids (2022-2030) ($MN)
27 North America Electric Vehicle Fluids Market Outlook, By Brake Fluids (2022-2030) ($MN)
28 North America Electric Vehicle Fluids Market Outlook, By Dielectric Fluids (2022-2030) ($MN)
29 North America Electric Vehicle Fluids Market Outlook, By Greases (2022-2030) ($MN)
30 North America Electric Vehicle Fluids Market Outlook, By Vehicle Type (2022-2030) ($MN)
31 North America Electric Vehicle Fluids Market Outlook, By Passenger Vehicles (2022-2030) ($MN)
32 North America Electric Vehicle Fluids Market Outlook, By Commercial Vehicles (2022-2030) ($MN)
33 North America Electric Vehicle Fluids Market Outlook, By Light Commercial Vehicles (2022-2030) ($MN)
34 North America Electric Vehicle Fluids Market Outlook, By Heavy Commercial Vehicles (2022-2030) ($MN)
35 North America Electric Vehicle Fluids Market Outlook, By Two-Wheelers (2022-2030) ($MN)
36 North America Electric Vehicle Fluids Market Outlook, By Propulsion Type (2022-2030) ($MN)
37 North America Electric Vehicle Fluids Market Outlook, By Battery Electric Vehicles (BEVs) (2022-2030) ($MN)
38 North America Electric Vehicle Fluids Market Outlook, By Plug-in Hybrid Electric Vehicles (PHEVs) (2022-2030) ($MN)
39 North America Electric Vehicle Fluids Market Outlook, By Hybrid Electric Vehicles (HEVs) (2022-2030) ($MN)
40 North America Electric Vehicle Fluids Market Outlook, By Fill Type (2022-2030) ($MN)
41 North America Electric Vehicle Fluids Market Outlook, By First Fill (2022-2030) ($MN)
42 North America Electric Vehicle Fluids Market Outlook, By Service Fill (2022-2030) ($MN)
43 Europe Electric Vehicle Fluids Market Outlook, By Country (2022-2030) ($MN)
44 Europe Electric Vehicle Fluids Market Outlook, By Product Type (2022-2030) ($MN)
45 Europe Electric Vehicle Fluids Market Outlook, By Battery Coolants (2022-2030) ($MN)
46 Europe Electric Vehicle Fluids Market Outlook, By Motor Coolants (2022-2030) ($MN)
47 Europe Electric Vehicle Fluids Market Outlook, By Transmission Fluids (2022-2030) ($MN)
48 Europe Electric Vehicle Fluids Market Outlook, By Brake Fluids (2022-2030) ($MN)
49 Europe Electric Vehicle Fluids Market Outlook, By Dielectric Fluids (2022-2030) ($MN)
50 Europe Electric Vehicle Fluids Market Outlook, By Greases (2022-2030) ($MN)
51 Europe Electric Vehicle Fluids Market Outlook, By Vehicle Type (2022-2030) ($MN)
52 Europe Electric Vehicle Fluids Market Outlook, By Passenger Vehicles (2022-2030) ($MN)
53 Europe Electric Vehicle Fluids Market Outlook, By Commercial Vehicles (2022-2030) ($MN)
54 Europe Electric Vehicle Fluids Market Outlook, By Light Commercial Vehicles (2022-2030) ($MN)
55 Europe Electric Vehicle Fluids Market Outlook, By Heavy Commercial Vehicles (2022-2030) ($MN)
56 Europe Electric Vehicle Fluids Market Outlook, By Two-Wheelers (2022-2030) ($MN)
57 Europe Electric Vehicle Fluids Market Outlook, By Propulsion Type (2022-2030) ($MN)
58 Europe Electric Vehicle Fluids Market Outlook, By Battery Electric Vehicles (BEVs) (2022-2030) ($MN)
59 Europe Electric Vehicle Fluids Market Outlook, By Plug-in Hybrid Electric Vehicles (PHEVs) (2022-2030) ($MN)
60 Europe Electric Vehicle Fluids Market Outlook, By Hybrid Electric Vehicles (HEVs) (2022-2030) ($MN)
61 Europe Electric Vehicle Fluids Market Outlook, By Fill Type (2022-2030) ($MN)
62 Europe Electric Vehicle Fluids Market Outlook, By First Fill (2022-2030) ($MN)
63 Europe Electric Vehicle Fluids Market Outlook, By Service Fill (2022-2030) ($MN)
64 Asia Pacific Electric Vehicle Fluids Market Outlook, By Country (2022-2030) ($MN)
65 Asia Pacific Electric Vehicle Fluids Market Outlook, By Product Type (2022-2030) ($MN)
66 Asia Pacific Electric Vehicle Fluids Market Outlook, By Battery Coolants (2022-2030) ($MN)
67 Asia Pacific Electric Vehicle Fluids Market Outlook, By Motor Coolants (2022-2030) ($MN)
68 Asia Pacific Electric Vehicle Fluids Market Outlook, By Transmission Fluids (2022-2030) ($MN)
69 Asia Pacific Electric Vehicle Fluids Market Outlook, By Brake Fluids (2022-2030) ($MN)
70 Asia Pacific Electric Vehicle Fluids Market Outlook, By Dielectric Fluids (2022-2030) ($MN)
71 Asia Pacific Electric Vehicle Fluids Market Outlook, By Greases (2022-2030) ($MN)
72 Asia Pacific Electric Vehicle Fluids Market Outlook, By Vehicle Type (2022-2030) ($MN)
73 Asia Pacific Electric Vehicle Fluids Market Outlook, By Passenger Vehicles (2022-2030) ($MN)
74 Asia Pacific Electric Vehicle Fluids Market Outlook, By Commercial Vehicles (2022-2030) ($MN)
75 Asia Pacific Electric Vehicle Fluids Market Outlook, By Light Commercial Vehicles (2022-2030) ($MN)
76 Asia Pacific Electric Vehicle Fluids Market Outlook, By Heavy Commercial Vehicles (2022-2030) ($MN)
77 Asia Pacific Electric Vehicle Fluids Market Outlook, By Two-Wheelers (2022-2030) ($MN)
78 Asia Pacific Electric Vehicle Fluids Market Outlook, By Propulsion Type (2022-2030) ($MN)
79 Asia Pacific Electric Vehicle Fluids Market Outlook, By Battery Electric Vehicles (BEVs) (2022-2030) ($MN)
80 Asia Pacific Electric Vehicle Fluids Market Outlook, By Plug-in Hybrid Electric Vehicles (PHEVs) (2022-2030) ($MN)
81 Asia Pacific Electric Vehicle Fluids Market Outlook, By Hybrid Electric Vehicles (HEVs) (2022-2030) ($MN)
82 Asia Pacific Electric Vehicle Fluids Market Outlook, By Fill Type (2022-2030) ($MN)
83 Asia Pacific Electric Vehicle Fluids Market Outlook, By First Fill (2022-2030) ($MN)
84 Asia Pacific Electric Vehicle Fluids Market Outlook, By Service Fill (2022-2030) ($MN)
85 South America Electric Vehicle Fluids Market Outlook, By Country (2022-2030) ($MN)
86 South America Electric Vehicle Fluids Market Outlook, By Product Type (2022-2030) ($MN)
87 South America Electric Vehicle Fluids Market Outlook, By Battery Coolants (2022-2030) ($MN)
88 South America Electric Vehicle Fluids Market Outlook, By Motor Coolants (2022-2030) ($MN)
89 South America Electric Vehicle Fluids Market Outlook, By Transmission Fluids (2022-2030) ($MN)
90 South America Electric Vehicle Fluids Market Outlook, By Brake Fluids (2022-2030) ($MN)
91 South America Electric Vehicle Fluids Market Outlook, By Dielectric Fluids (2022-2030) ($MN)
92 South America Electric Vehicle Fluids Market Outlook, By Greases (2022-2030) ($MN)
93 South America Electric Vehicle Fluids Market Outlook, By Vehicle Type (2022-2030) ($MN)
94 South America Electric Vehicle Fluids Market Outlook, By Passenger Vehicles (2022-2030) ($MN)
95 South America Electric Vehicle Fluids Market Outlook, By Commercial Vehicles (2022-2030) ($MN)
96 South America Electric Vehicle Fluids Market Outlook, By Light Commercial Vehicles (2022-2030) ($MN)
97 South America Electric Vehicle Fluids Market Outlook, By Heavy Commercial Vehicles (2022-2030) ($MN)
98 South America Electric Vehicle Fluids Market Outlook, By Two-Wheelers (2022-2030) ($MN)
99 South America Electric Vehicle Fluids Market Outlook, By Propulsion Type (2022-2030) ($MN)
100 South America Electric Vehicle Fluids Market Outlook, By Battery Electric Vehicles (BEVs) (2022-2030) ($MN)
101 South America Electric Vehicle Fluids Market Outlook, By Plug-in Hybrid Electric Vehicles (PHEVs) (2022-2030) ($MN)
102 South America Electric Vehicle Fluids Market Outlook, By Hybrid Electric Vehicles (HEVs) (2022-2030) ($MN)
103 South America Electric Vehicle Fluids Market Outlook, By Fill Type (2022-2030) ($MN)
104 South America Electric Vehicle Fluids Market Outlook, By First Fill (2022-2030) ($MN)
105 South America Electric Vehicle Fluids Market Outlook, By Service Fill (2022-2030) ($MN)
106 Middle East & Africa Electric Vehicle Fluids Market Outlook, By Country (2022-2030) ($MN)
107 Middle East & Africa Electric Vehicle Fluids Market Outlook, By Product Type (2022-2030) ($MN)
108 Middle East & Africa Electric Vehicle Fluids Market Outlook, By Battery Coolants (2022-2030) ($MN)
109 Middle East & Africa Electric Vehicle Fluids Market Outlook, By Motor Coolants (2022-2030) ($MN)
110 Middle East & Africa Electric Vehicle Fluids Market Outlook, By Transmission Fluids (2022-2030) ($MN)
111 Middle East & Africa Electric Vehicle Fluids Market Outlook, By Brake Fluids (2022-2030) ($MN)
112 Middle East & Africa Electric Vehicle Fluids Market Outlook, By Dielectric Fluids (2022-2030) ($MN)
113 Middle East & Africa Electric Vehicle Fluids Market Outlook, By Greases (2022-2030) ($MN)
114 Middle East & Africa Electric Vehicle Fluids Market Outlook, By Vehicle Type (2022-2030) ($MN)
115 Middle East & Africa Electric Vehicle Fluids Market Outlook, By Passenger Vehicles (2022-2030) ($MN)
116 Middle East & Africa Electric Vehicle Fluids Market Outlook, By Commercial Vehicles (2022-2030) ($MN)
117 Middle East & Africa Electric Vehicle Fluids Market Outlook, By Light Commercial Vehicles (2022-2030) ($MN)
118 Middle East & Africa Electric Vehicle Fluids Market Outlook, By Heavy Commercial Vehicles (2022-2030) ($MN)
119 Middle East & Africa Electric Vehicle Fluids Market Outlook, By Two-Wheelers (2022-2030) ($MN)
120 Middle East & Africa Electric Vehicle Fluids Market Outlook, By Propulsion Type (2022-2030) ($MN)
121 Middle East & Africa Electric Vehicle Fluids Market Outlook, By Battery Electric Vehicles (BEVs) (2022-2030) ($MN)
122 Middle East & Africa Electric Vehicle Fluids Market Outlook, By Plug-in Hybrid Electric Vehicles (PHEVs) (2022-2030) ($MN)
123 Middle East & Africa Electric Vehicle Fluids Market Outlook, By Hybrid Electric Vehicles (HEVs) (2022-2030) ($MN)
124 Middle East & Africa Electric Vehicle Fluids Market Outlook, By Fill Type (2022-2030) ($MN)
125 Middle East & Africa Electric Vehicle Fluids Market Outlook, By First Fill (2022-2030) ($MN)
126 Middle East & Africa Electric Vehicle Fluids Market Outlook, By Service Fill (2022-2030) ($MN)
List of Figures
RESEARCH METHODOLOGY

We at ‘Stratistics’ opt for an extensive research approach which involves data mining, data validation, and data analysis. The various research sources include in-house repository, secondary research, competitor’s sources, social media research, client internal data, and primary research.
Our team of analysts prefers the most reliable and authenticated data sources in order to perform the comprehensive literature search. With access to most of the authenticated data bases our team highly considers the best mix of information through various sources to obtain extensive and accurate analysis.
Each report takes an average time of a month and a team of 4 industry analysts. The time may vary depending on the scope and data availability of the desired market report. The various parameters used in the market assessment are standardized in order to enhance the data accuracy.
Data Mining
The data is collected from several authenticated, reliable, paid and unpaid sources and is filtered depending on the scope & objective of the research. Our reports repository acts as an added advantage in this procedure. Data gathering from the raw material suppliers, distributors and the manufacturers is performed on a regular basis, this helps in the comprehensive understanding of the products value chain. Apart from the above mentioned sources the data is also collected from the industry consultants to ensure the objective of the study is in the right direction.
Market trends such as technological advancements, regulatory affairs, market dynamics (Drivers, Restraints, Opportunities and Challenges) are obtained from scientific journals, market related national & international associations and organizations.
Data Analysis
From the data that is collected depending on the scope & objective of the research the data is subjected for the analysis. The critical steps that we follow for the data analysis include:
- Product Lifecycle Analysis
- Competitor analysis
- Risk analysis
- Porters Analysis
- PESTEL Analysis
- SWOT Analysis
The data engineering is performed by the core industry experts considering both the Marketing Mix Modeling and the Demand Forecasting. The marketing mix modeling makes use of multiple-regression techniques to predict the optimal mix of marketing variables. Regression factor is based on a number of variables and how they relate to an outcome such as sales or profits.
Data Validation
The data validation is performed by the exhaustive primary research from the expert interviews. This includes telephonic interviews, focus groups, face to face interviews, and questionnaires to validate our research from all aspects. The industry experts we approach come from the leading firms, involved in the supply chain ranging from the suppliers, distributors to the manufacturers and consumers so as to ensure an unbiased analysis.
We are in touch with more than 15,000 industry experts with the right mix of consultants, CEO's, presidents, vice presidents, managers, experts from both supply side and demand side, executives and so on.
The data validation involves the primary research from the industry experts belonging to:
- Leading Companies
- Suppliers & Distributors
- Manufacturers
- Consumers
- Industry/Strategic Consultants
Apart from the data validation the primary research also helps in performing the fill gap research, i.e. providing solutions for the unmet needs of the research which helps in enhancing the reports quality.
For more details about research methodology, kindly write to us at info@strategymrc.com
Frequently Asked Questions
In case of any queries regarding this report, you can contact the customer service by filing the “Inquiry Before Buy” form available on the right hand side. You may also contact us through email: info@strategymrc.com or phone: +1-301-202-5929
Yes, the samples are available for all the published reports. You can request them by filling the “Request Sample” option available in this page.
Yes, you can request a sample with your specific requirements. All the customized samples will be provided as per the requirement with the real data masked.
All our reports are available in Digital PDF format. In case if you require them in any other formats, such as PPT, Excel etc you can submit a request through “Inquiry Before Buy” form available on the right hand side. You may also contact us through email: info@strategymrc.com or phone: +1-301-202-5929
We offer a free 15% customization with every purchase. This requirement can be fulfilled for both pre and post sale. You may send your customization requirements through email at info@strategymrc.com or call us on +1-301-202-5929.
We have 3 different licensing options available in electronic format.
- Single User Licence: Allows one person, typically the buyer, to have access to the ordered product. The ordered product cannot be distributed to anyone else.
- 2-5 User Licence: Allows the ordered product to be shared among a maximum of 5 people within your organisation.
- Corporate License: Allows the product to be shared among all employees of your organisation regardless of their geographical location.
All our reports are typically be emailed to you as an attachment.
To order any available report you need to register on our website. The payment can be made either through CCAvenue or PayPal payments gateways which accept all international cards.
We extend our support to 6 months post sale. A post sale customization is also provided to cover your unmet needs in the report.
Request Customization
We offer complimentary customization of up to 15% with every purchase. To share your customization requirements, feel free to email us at info@strategymrc.com or call us on +1-301-202-5929. .
Please Note: Customization within the 15% threshold is entirely free of charge. If your request exceeds this limit, we will conduct a feasibility assessment. Following that, a detailed quote and timeline will be provided.
WHY CHOOSE US ?

Assured Quality
Best in class reports with high standard of research integrity

24X7 Research Support
Continuous support to ensure the best customer experience.

Free Customization
Adding more values to your product of interest.

Safe & Secure Access
Providing a secured environment for all online transactions.

Trusted by 600+ Brands
Serving the most reputed brands across the world.