
Extended Reality Xr Training Market
Extended Reality (XR) Training Market Forecasts to 2034 – Global Analysis By Component (Hardware, Software and Services), Training Type, Technology, Deployment Mode, Application, End User and By Geography

Market Dynamics:
Driver:
Workforce Safety and Compliance Requirements
The expanding regulatory emphasis on workplace safety and the substantial costs associated with industrial accidents are primary forces driving extended reality training adoption. Manufacturing, energy, and construction enterprises increasingly recognize that immersive simulation reduces the risk exposure inherent in training new workers on live equipment, particularly during the critical first ninety days of employment when injury rates are highest. This recognition fuels demand for XR platforms that deliver repeatable, assessable practice scenarios without physical hazards. Vendors respond by expanding scenario libraries for high-risk environments and integrating assessment tools that document competency attainment for regulatory compliance purposes, thereby reinforcing institutional commitment to immersive training infrastructure.
Restraint:
Hardware Fragmentation and Content Interoperability
The absence of standardized hardware platforms and content formats constrains extended reality training deployment across multi-site enterprises. Organizations operating diverse device fleets encounter compatibility challenges when attempting to distribute training modules across different head-mounted display manufacturers and operating systems, while content developed for one platform often requires substantial reengineering for another. This fragmentation increases total cost of ownership and complicates enterprise-wide rollout strategies, particularly for organizations with existing mixed device inventories. Smaller training departments and vocational institutions with limited technical resources are disproportionately affected, as they lack the capacity to manage heterogeneous hardware ecosystems and custom integration work required to achieve consistent instructional delivery.
Opportunity:
AI-Driven Scenario Generation
Artificial intelligence presents a substantial opportunity to overcome the content bottleneck that has historically limited extended reality training scalability. AI-assisted authoring tools can generate varied procedural scenarios from reference materials, operational documentation, or captured expert demonstrations, reducing the time and specialized expertise required to produce effective immersive training content. This capability enables enterprises to maintain current scenario libraries without dedicated three-dimensional modeling teams and allows training programs to adapt rapidly to new equipment, procedures, or regulatory requirements. For vendors, AI-driven content creation lowers the marginal cost of expanding application coverage, creating pathways to address long-tail training needs that previously could not justify custom development investment.
Threat:
Proof-of-Value Scrutiny and Budget Consolidation
Extended reality training investments face increasing scrutiny as enterprises demand rigorous evidence linking immersive programs to measurable operational outcomes. While pilot deployments often generate enthusiasm, transitioning to sustained funding requires demonstrating return on investment through reduced training time, lower incident rates, or improved productivity metrics that withstand finance department review. Economic pressure may prompt organizations to consolidate learning technology budgets, potentially favoring established learning management systems over immersive solutions that require separate infrastructure and support. This scrutiny is particularly acute in sectors with thin margins or cyclical spending patterns, where discretionary technology investments are vulnerable to deferral during periods of financial uncertainty.
Covid-19 Impact:
The pandemic initially disrupted extended reality training deployments as enterprises froze discretionary spending and restricted site access for hardware installation. Mid-pandemic, remote work and travel limitations accelerated interest in immersive simulation as an alternative to in-person training at facilities and live equipment. Post-pandemic, hybrid workforce models normalized distributed training delivery, embedding XR pilots within broader digital transformation strategies and establishing immersive simulation as a permanent component of enterprise learning infrastructure rather than an experimental initiative.
The hardware segment is expected to be the largest during the forecast period
The hardware segment is expected to account for the largest market share during the forecast period, due to the necessity of head-mounted displays and tracking peripherals as foundational infrastructure for any extended reality training program. Enterprises must procure physical devices before accessing software platforms or content libraries, concentrating capital expenditure at the hardware layer during initial deployment phases. While software and services revenues grow as installed bases expand and recurring subscription models mature, hardware remains the dominant revenue category throughout the forecast horizon, as replacement cycles and multi-site rollouts sustain demand for headsets, controllers, and sensing equipment across industrial and enterprise training environments.
The simulation-based training segment is expected to have the highest CAGR during the forecast period
Over the forecast period, the simulation-based training segment is predicted to witness the highest growth rate, driven by enterprise demand for realistic, repeatable practice environments in high-risk operational contexts. Simulation-based approaches enable learners to rehearse emergency procedures, equipment failures, and hazardous maintenance tasks without exposure to physical danger, which in turn reduces training-related incidents and accelerates competency development. Scalability advantages relative to live equipment access and instructor-dependent sessions further drive adoption, thereby positioning simulation-based training as the fastest-growing training type within the extended reality landscape. Regulatory pressure for documented competency assessment reinforces this trajectory across manufacturing, energy, and defense sectors.
Region with largest share:
During the forecast period, the North America region is expected to hold the largest market share, due to the concentration of leading technology vendors, mature enterprise training infrastructure, and substantial defense and aerospace simulation spending across the United States and Canada. The region benefits from widespread adoption of extended reality in manufacturing, healthcare, and military training applications, supported by established procurement frameworks and venture funding for immersive technology startups. Major companies including Microsoft, Meta, Apple, and Google maintain headquarters and primary research operations in the region, while defense simulation requirements and occupational safety regulations reinforce sustained investment in immersive training infrastructure throughout the forecast period.
Region with highest CAGR:
Over the forecast period, the Asia Pacific region is anticipated to exhibit the highest CAGR, due to rapid industrial automation, expanding manufacturing capacity, and government initiatives promoting digital skills development across China, Japan, and Southeast Asian markets. The region’s concentration of electronics manufacturing, automotive production, and energy infrastructure creates substantial demand for safety and technical training solutions that can be delivered at scale across dispersed facilities. Key countries including China and India are implementing national workforce development programs that incorporate immersive technology, while local vendors and international providers expand regional presence in order to capture growth opportunities across these rapidly industrializing economies.
Key players in the market
Some of the key players in Extended Reality (XR) Training Market include Microsoft Corporation, Meta Platforms, Inc., Apple Inc., Google LLC, HTC Corporation, Sony Group Corporation, Samsung Electronics Co., Ltd., Lenovo Group Limited, PTC Inc., Unity Technologies, Epic Games, Inc., EON Reality, Inc., Strivr Labs, Inc., Talespin Reality Labs, Inc., Virti Inc., PIXO VR, and ENGAGE XR Holdings plc.
Key Developments:
In October 2026, Hololight released Stream 2026.1.0.0, updating its remote-rendering platform with improved three-dimensional object stability on Meta Quest, image tracking alignment for Apple Vision Pro, and automatic session reconnection capabilities for enterprise training deployments.
In September 2026, Adaptive Immersion presented field data at the Global XR Summit demonstrating that procedural XR training for defense and aviation maintenance roles can deliver up to $10 million annually in improved job performance value for a 1,000-operator cohort.
In September 2026, Korea Education Group signed a tripartite memorandum of understanding with Virtualware and GlobePoint to deploy the VIROO platform across Korean vocational education programs, covering digital academies, industry-linked learning, and higher education applications.
Component Types Covered:
• Hardware
• Software
• Services
Training Types Covered:
• Technical and Skills Training
• Safety and Compliance Training
• Soft Skills and Behavioral Training
• Onboarding and Orientation Training
• Simulation-Based Training
• Other Training Types
Technologies Covered:
• Virtual Reality (VR)
• Augmented Reality (AR)
• Mixed Reality (MR)
Deployment Modes Covered:
• Cloud-Based
• On-Premises
Applications Covered:
• Industrial and Manufacturing Training
• Healthcare and Medical Training
• Aerospace and Defense Training
• Automotive Training
• Education and Academic Training
• Retail and Customer Service Training
• Other Applications
End Users Covered:
• Manufacturing Enterprises
• Healthcare Organizations
• Aerospace and Defense Organizations
• Educational Institutions
• Corporate Enterprises
• Government and Public Sector Organizations
• Other End Users
Regions Covered:
• North America
o United States
o Canada
o Mexico
• Europe
o United Kingdom
o Germany
o France
o Italy
o Spain
o Netherlands
o Belgium
o Sweden
o Switzerland
o Poland
o Rest of Europe
• Asia Pacific
o China
o Japan
o India
o South Korea
o Australia
o Indonesia
o Thailand
o Malaysia
o Singapore
o Vietnam
o Rest of Asia Pacific
• South America
o Brazil
o Argentina
o Colombia
o Chile
o Peru
o Rest of South America
• Rest of the World (RoW)
o Middle East
§ Saudi Arabia
§ United Arab Emirates
§ Qatar
§ Israel
§ Rest of Middle East
o Africa
§ South Africa
§ Egypt
§ Morocco
§ Rest of Africa
What our report offers:
- Market share assessments for the regional and country-level segments
- Strategic recommendations for the new entrants
- Covers Market data for the years 2023, 2024, 2025, 2026, 2027, 2028, 2030, 2032 and 2034
- Market Trends (Drivers, Constraints, Opportunities, Threats, Challenges, Investment Opportunities, and recommendations)
- Strategic recommendations in key business segments based on the market estimations
- Competitive landscaping mapping the key common trends
- Company profiling with detailed strategies, financials, and recent developments
- Supply chain trends mapping the latest technological advancements
Free Customization Offerings:
All the customers of this report will be entitled to receive one of the following free customization options:
• Company Profiling
o Comprehensive profiling of additional market players (up to 3)
o SWOT Analysis of key players (up to 3)
• Regional Segmentation
o Market estimations, Forecasts and CAGR of any prominent country as per the client's interest (Note: Depends on feasibility check)
• Competitive Benchmarking
o Benchmarking of key players based on product portfolio, geographical presence, and strategic alliances
Table of Contents
1 Executive Summary1.1 Market Snapshot and Key Highlights
1.2 Growth Drivers, Challenges, and Opportunities
1.3 Competitive Landscape Overview
1.4 Strategic Insights and Recommendations
2 Research Framework
2.1 Study Objectives and Scope
2.2 Stakeholder Analysis
2.3 Research Assumptions and Limitations
2.4 Research Methodology
2.4.1 Data Collection (Primary and Secondary)
2.4.2 Data Modeling and Estimation Techniques
2.4.3 Data Validation and Triangulation
2.4.4 Analytical and Forecasting Approach
3 Market Dynamics and Trend Analysis
3.1 Market Definition and Structure
3.2 Key Market Drivers
3.3 Market Restraints and Challenges
3.4 Growth Opportunities and Investment Hotspots
3.5 Industry Threats and Risk Assessment
3.6 Technology and Innovation Landscape
3.7 Emerging and High-Growth Markets
3.8 Regulatory and Policy Environment
3.9 Impact of COVID-19 and Recovery Outlook
4 Competitive and Strategic Assessment
4.1 Porter's Five Forces Analysis
4.1.1 Supplier Bargaining Power
4.1.2 Buyer Bargaining Power
4.1.3 Threat of Substitutes
4.1.4 Threat of New Entrants
4.1.5 Competitive Rivalry
4.2 Market Share Analysis of Key Players
4.3 Product Benchmarking and Performance Comparison
5 Global Extended Reality (XR) Training Market, By Component
5.1 Hardware
5.1.1 Head-Mounted Displays (HMDs)
5.1.2 Smart Glasses
5.1.3 Motion Tracking and Sensing Devices
5.1.4 Haptic Devices and Controllers
5.2 Software
5.2.1 XR Training Platforms
5.2.2 Simulation and Training Software
5.2.3 XR Content Development Software
5.3 Services
5.3.1 Professional Services
5.3.2 Managed Services
6 Global Extended Reality (XR) Training Market, By Training Type
6.1 Technical and Skills Training
6.2 Safety and Compliance Training
6.3 Soft Skills and Behavioral Training
6.4 Onboarding and Orientation Training
6.5 Simulation-Based Training
6.6 Other Training Types
7 Global Extended Reality (XR) Training Market, By Technology
7.1 Virtual Reality (VR)
7.2 Augmented Reality (AR)
7.3 Mixed Reality (MR)
8 Global Extended Reality (XR) Training Market, By Deployment Mode
8.1 Cloud-Based
8.2 On-Premises
9 Global Extended Reality (XR) Training Market, By Application
9.1 Industrial and Manufacturing Training
9.2 Healthcare and Medical Training
9.3 Aerospace and Defense Training
9.4 Automotive Training
9.5 Education and Academic Training
9.6 Retail and Customer Service Training
9.7 Other Applications
10 Global Extended Reality (XR) Training Market, By End User
10.1 Manufacturing Enterprises
10.2 Healthcare Organizations
10.3 Aerospace and Defense Organizations
10.4 Educational Institutions
10.5 Corporate Enterprises
10.6 Government and Public Sector Organizations
10.7 Other End Users
11 Global Extended Reality (XR) Training Market, By Geography
11.1 North America
11.1.1 United States
11.1.2 Canada
11.1.3 Mexico
11.2 Europe
11.2.1 United Kingdom
11.2.2 Germany
11.2.3 France
11.2.4 Italy
11.2.5 Spain
11.2.6 Netherlands
11.2.7 Belgium
11.2.8 Sweden
11.2.9 Switzerland
11.2.10 Poland
11.2.11 Rest of Europe
11.3 Asia Pacific
11.3.1 China
11.3.2 Japan
11.3.3 India
11.3.4 South Korea
11.3.5 Australia
11.3.6 Indonesia
11.3.7 Thailand
11.3.8 Malaysia
11.3.9 Singapore
11.3.10 Vietnam
11.3.11 Rest of Asia Pacific
11.4 South America
11.4.1 Brazil
11.4.2 Argentina
11.4.3 Colombia
11.4.4 Chile
11.4.5 Peru
11.4.6 Rest of South America
11.5 Rest of the World (RoW)
11.5.1 Middle East
11.5.1.1 Saudi Arabia
11.5.1.2 United Arab Emirates
11.5.1.3 Qatar
11.5.1.4 Israel
11.5.1.5 Rest of Middle East
11.5.2 Africa
11.5.2.1 South Africa
11.5.2.2 Egypt
11.5.2.3 Morocco
11.5.2.4 Rest of Africa
12 Strategic Market Intelligence
12.1 Industry Value Network and Supply Chain Assessment
12.2 White-Space and Opportunity Mapping
12.3 Product Evolution and Market Life Cycle Analysis
12.4 Channel, Distributor, and Go-to-Market Assessment
13 Industry Developments and Strategic Initiatives
13.1 Mergers and Acquisitions
13.2 Partnerships, Alliances, and Joint Ventures
13.3 New Product Launches and Certifications
13.4 Capacity Expansion and Investments
13.5 Other Strategic Initiatives
14 Company Profiles
14.1 Microsoft Corporation
14.2 Meta Platforms, Inc.
14.3 Apple Inc.
14.4 Google LLC
14.5 HTC Corporation
14.6 Sony Group Corporation
14.7 Samsung Electronics Co., Ltd.
14.8 Lenovo Group Limited
14.9 PTC Inc.
14.10 Unity Technologies
14.11 Epic Games, Inc.
14.12 EON Reality, Inc.
14.13 Strivr Labs, Inc.
14.14 Talespin Reality Labs, Inc.
14.15 Virti Inc.
14.16 PIXO VR
14.17 ENGAGE XR Holdings plc
List of Tables
1 Global Extended Reality (XR) Training Market Outlook, By Region (2023-2034) ($MN)
2 Global Extended Reality (XR) Training Market Outlook, By Component (2023-2034) ($MN)
3 Global Extended Reality (XR) Training Market Outlook, By Hardware (2023-2034) ($MN)
4 Global Extended Reality (XR) Training Market Outlook, By Head-Mounted Displays (HMDs) (2023-2034) ($MN)
5 Global Extended Reality (XR) Training Market Outlook, By Smart Glasses (2023-2034) ($MN)
6 Global Extended Reality (XR) Training Market Outlook, By Motion Tracking and Sensing Devices (2023-2034) ($MN)
7 Global Extended Reality (XR) Training Market Outlook, By Haptic Devices and Controllers (2023-2034) ($MN)
8 Global Extended Reality (XR) Training Market Outlook, By Software (2023-2034) ($MN)
9 Global Extended Reality (XR) Training Market Outlook, By XR Training Platforms (2023-2034) ($MN)
10 Global Extended Reality (XR) Training Market Outlook, By Simulation and Training Software (2023-2034) ($MN)
11 Global Extended Reality (XR) Training Market Outlook, By XR Content Development Software (2023-2034) ($MN)
12 Global Extended Reality (XR) Training Market Outlook, By Services (2023-2034) ($MN)
13 Global Extended Reality (XR) Training Market Outlook, By Professional Services (2023-2034) ($MN)
14 Global Extended Reality (XR) Training Market Outlook, By Managed Services (2023-2034) ($MN)
15 Global Extended Reality (XR) Training Market Outlook, By Training Type (2023-2034) ($MN)
16 Global Extended Reality (XR) Training Market Outlook, By Technical and Skills Training (2023-2034) ($MN)
17 Global Extended Reality (XR) Training Market Outlook, By Safety and Compliance Training (2023-2034) ($MN)
18 Global Extended Reality (XR) Training Market Outlook, By Soft Skills and Behavioral Training (2023-2034) ($MN)
19 Global Extended Reality (XR) Training Market Outlook, By Onboarding and Orientation Training (2023-2034) ($MN)
20 Global Extended Reality (XR) Training Market Outlook, By Simulation-Based Training (2023-2034) ($MN)
21 Global Extended Reality (XR) Training Market Outlook, By Other Training Types (2023-2034) ($MN)
22 Global Extended Reality (XR) Training Market Outlook, By Technology (2023-2034) ($MN)
23 Global Extended Reality (XR) Training Market Outlook, By Virtual Reality (VR) (2023-2034) ($MN)
24 Global Extended Reality (XR) Training Market Outlook, By Augmented Reality (AR) (2023-2034) ($MN)
25 Global Extended Reality (XR) Training Market Outlook, By Mixed Reality (MR) (2023-2034) ($MN)
26 Global Extended Reality (XR) Training Market Outlook, By Deployment Mode (2023-2034) ($MN)
27 Global Extended Reality (XR) Training Market Outlook, By Cloud-Based (2023-2034) ($MN)
28 Global Extended Reality (XR) Training Market Outlook, By On-Premises (2023-2034) ($MN)
29 Global Extended Reality (XR) Training Market Outlook, By Application (2023-2034) ($MN)
30 Global Extended Reality (XR) Training Market Outlook, By Industrial and Manufacturing Training (2023-2034) ($MN)
31 Global Extended Reality (XR) Training Market Outlook, By Healthcare and Medical Training (2023-2034) ($MN)
32 Global Extended Reality (XR) Training Market Outlook, By Aerospace and Defense Training (2023-2034) ($MN)
33 Global Extended Reality (XR) Training Market Outlook, By Automotive Training (2023-2034) ($MN)
34 Global Extended Reality (XR) Training Market Outlook, By Education and Academic Training (2023-2034) ($MN)
35 Global Extended Reality (XR) Training Market Outlook, By Retail and Customer Service Training (2023-2034) ($MN)
36 Global Extended Reality (XR) Training Market Outlook, By Other Applications (2023-2034) ($MN)
37 Global Extended Reality (XR) Training Market Outlook, By End User (2023-2034) ($MN)
38 Global Extended Reality (XR) Training Market Outlook, By Manufacturing Enterprises (2023-2034) ($MN)
39 Global Extended Reality (XR) Training Market Outlook, By Healthcare Organizations (2023-2034) ($MN)
40 Global Extended Reality (XR) Training Market Outlook, By Aerospace and Defense Organizations (2023-2034) ($MN)
41 Global Extended Reality (XR) Training Market Outlook, By Educational Institutions (2023-2034) ($MN)
42 Global Extended Reality (XR) Training Market Outlook, By Corporate Enterprises (2023-2034) ($MN)
43 Global Extended Reality (XR) Training Market Outlook, By Government and Public Sector Organizations (2023-2034) ($MN)
44 Global Extended Reality (XR) Training Market Outlook, By Other End Users (2023-2034) ($MN)
Note: Tables for North America, Europe, APAC, South America, and Rest of the World (RoW) Regions are also represented in the same manner as above.
List of Figures
RESEARCH METHODOLOGY
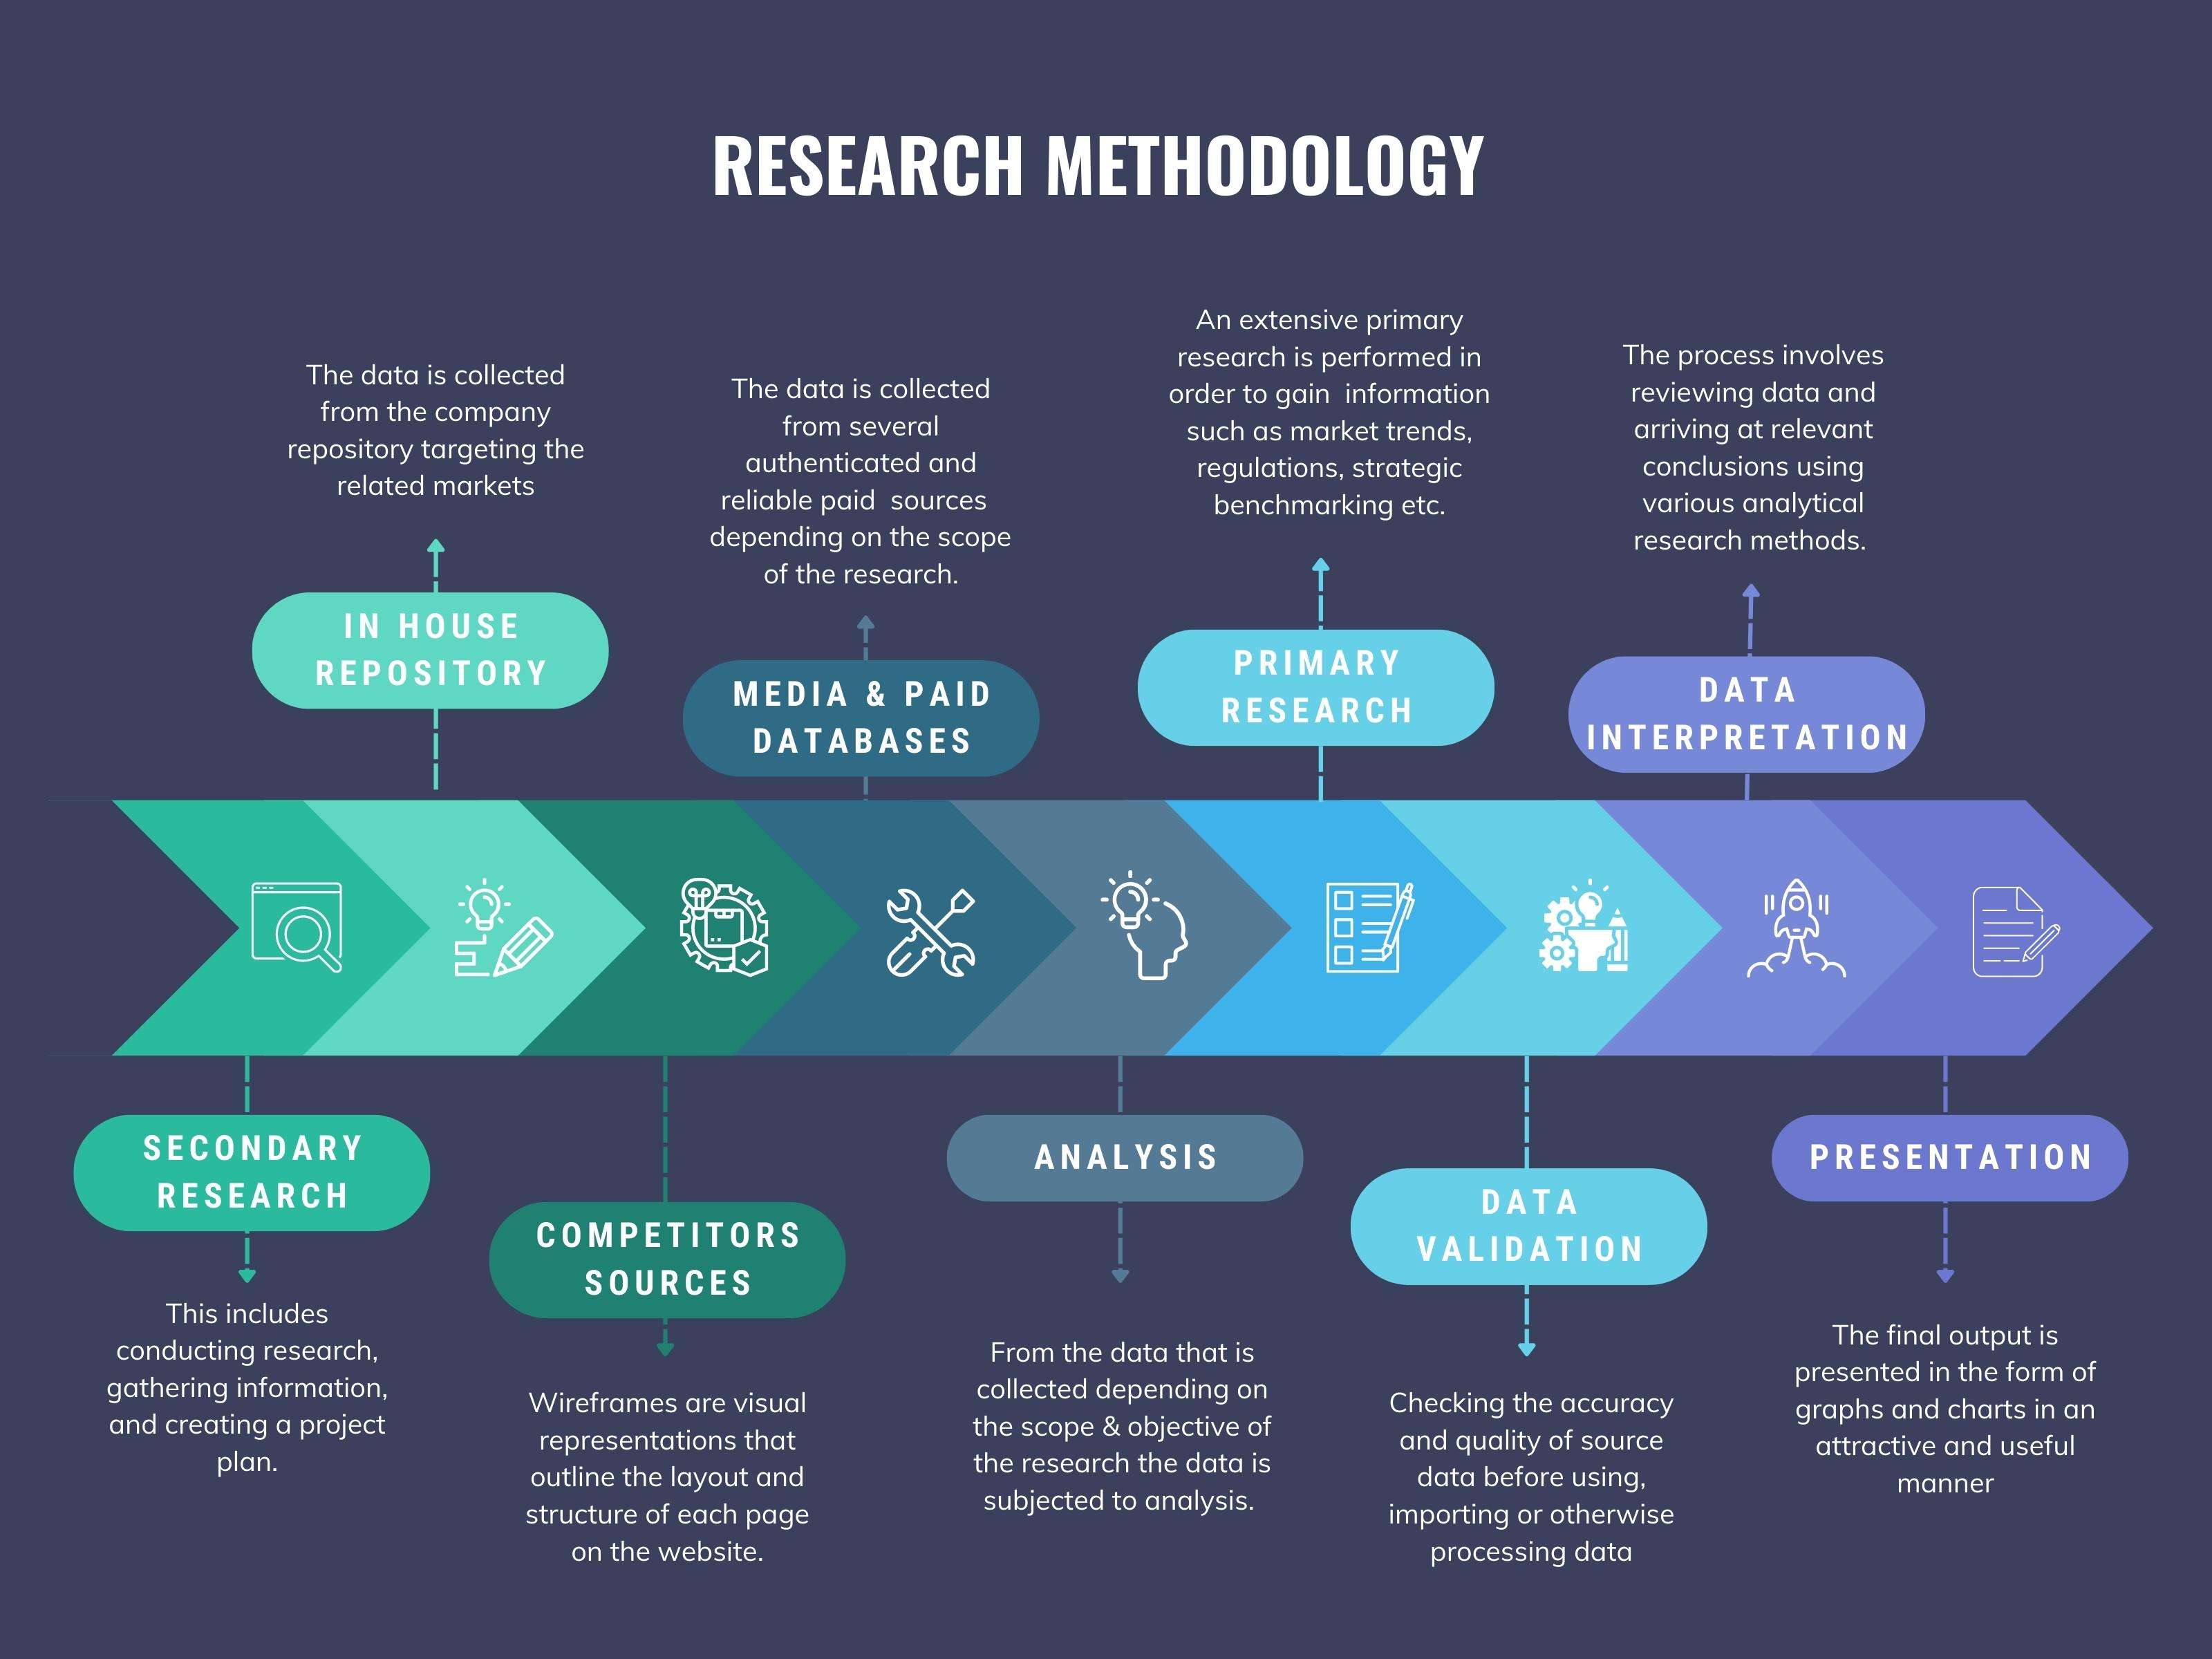
We at ‘Stratistics’ opt for an extensive research approach which involves data mining, data validation, and data analysis. The various research sources include in-house repository, secondary research, competitor’s sources, social media research, client internal data, and primary research.
Our team of analysts prefers the most reliable and authenticated data sources in order to perform the comprehensive literature search. With access to most of the authenticated data bases our team highly considers the best mix of information through various sources to obtain extensive and accurate analysis.
Each report takes an average time of a month and a team of 4 industry analysts. The time may vary depending on the scope and data availability of the desired market report. The various parameters used in the market assessment are standardized in order to enhance the data accuracy.
Data Mining
The data is collected from several authenticated, reliable, paid and unpaid sources and is filtered depending on the scope & objective of the research. Our reports repository acts as an added advantage in this procedure. Data gathering from the raw material suppliers, distributors and the manufacturers is performed on a regular basis, this helps in the comprehensive understanding of the products value chain. Apart from the above mentioned sources the data is also collected from the industry consultants to ensure the objective of the study is in the right direction.
Market trends such as technological advancements, regulatory affairs, market dynamics (Drivers, Restraints, Opportunities and Challenges) are obtained from scientific journals, market related national & international associations and organizations.
Data Analysis
From the data that is collected depending on the scope & objective of the research the data is subjected for the analysis. The critical steps that we follow for the data analysis include:
- Product Lifecycle Analysis
- Competitor analysis
- Risk analysis
- Porters Analysis
- PESTEL Analysis
- SWOT Analysis
The data engineering is performed by the core industry experts considering both the Marketing Mix Modeling and the Demand Forecasting. The marketing mix modeling makes use of multiple-regression techniques to predict the optimal mix of marketing variables. Regression factor is based on a number of variables and how they relate to an outcome such as sales or profits.
Data Validation
The data validation is performed by the exhaustive primary research from the expert interviews. This includes telephonic interviews, focus groups, face to face interviews, and questionnaires to validate our research from all aspects. The industry experts we approach come from the leading firms, involved in the supply chain ranging from the suppliers, distributors to the manufacturers and consumers so as to ensure an unbiased analysis.
We are in touch with more than 15,000 industry experts with the right mix of consultants, CEO's, presidents, vice presidents, managers, experts from both supply side and demand side, executives and so on.
The data validation involves the primary research from the industry experts belonging to:
- Leading Companies
- Suppliers & Distributors
- Manufacturers
- Consumers
- Industry/Strategic Consultants
Apart from the data validation the primary research also helps in performing the fill gap research, i.e. providing solutions for the unmet needs of the research which helps in enhancing the reports quality.
For more details about research methodology, kindly write to us at info@strategymrc.com
Frequently Asked Questions
In case of any queries regarding this report, you can contact the customer service by filing the “Inquiry Before Buy” form available on the right hand side. You may also contact us through email: info@strategymrc.com or phone: +1-301-202-5929
Yes, the samples are available for all the published reports. You can request them by filling the “Request Sample” option available in this page.
Yes, you can request a sample with your specific requirements. All the customized samples will be provided as per the requirement with the real data masked.
All our reports are available in Digital PDF format. In case if you require them in any other formats, such as PPT, Excel etc you can submit a request through “Inquiry Before Buy” form available on the right hand side. You may also contact us through email: info@strategymrc.com or phone: +1-301-202-5929
We offer a free 15% customization with every purchase. This requirement can be fulfilled for both pre and post sale. You may send your customization requirements through email at info@strategymrc.com or call us on +1-301-202-5929.
We have 3 different licensing options available in electronic format.
- Single User Licence: Allows one person, typically the buyer, to have access to the ordered product. The ordered product cannot be distributed to anyone else.
- 2-5 User Licence: Allows the ordered product to be shared among a maximum of 5 people within your organisation.
- Corporate License: Allows the product to be shared among all employees of your organisation regardless of their geographical location.
All our reports are typically be emailed to you as an attachment.
To order any available report you need to register on our website. The payment can be made either through CCAvenue or PayPal payments gateways which accept all international cards.
We extend our support to 6 months post sale. A post sale customization is also provided to cover your unmet needs in the report.
Request Customization
We offer complimentary customization of up to 15% with every purchase. To share your customization requirements, feel free to email us at info@strategymrc.com or call us on +1-301-202-5929. .
Please Note: Customization within the 15% threshold is entirely free of charge. If your request exceeds this limit, we will conduct a feasibility assessment. Following that, a detailed quote and timeline will be provided.
WHY CHOOSE US ?

Assured Quality
Best in class reports with high standard of research integrity

24X7 Research Support
Continuous support to ensure the best customer experience.

Free Customization
Adding more values to your product of interest.

Safe & Secure Access
Providing a secured environment for all online transactions.

Trusted by 600+ Brands
Serving the most reputed brands across the world.