
Gear Metering System Market
Gear Metering System Market Forecasts to 2030 - Global Analysis By Type (Double Acting and Single Acting), Application (Automobile Industry, Achitechive, Electronics Industry, Chemical and Other Applications) and By Geography
|
Years Covered |
2021-2030 |
|
CAGR (2023 - 2030) |
4.0% |
|
Regions Covered |
North America, Europe, Asia Pacific, South America, and Middle East & Africa |
|
Countries Covered |
US, Canada, Mexico, Germany, UK, Italy, France, Spain, Japan, China, India, Australia, New Zealand, South Korea, Rest of Asia Pacific, South America, Argentina, Brazil, Chile, Middle East & Africa, Saudi Arabia, UAE, Qatar, and South Africa |
|
Largest Market |
Europe |
|
Highest Growing Market |
North America |
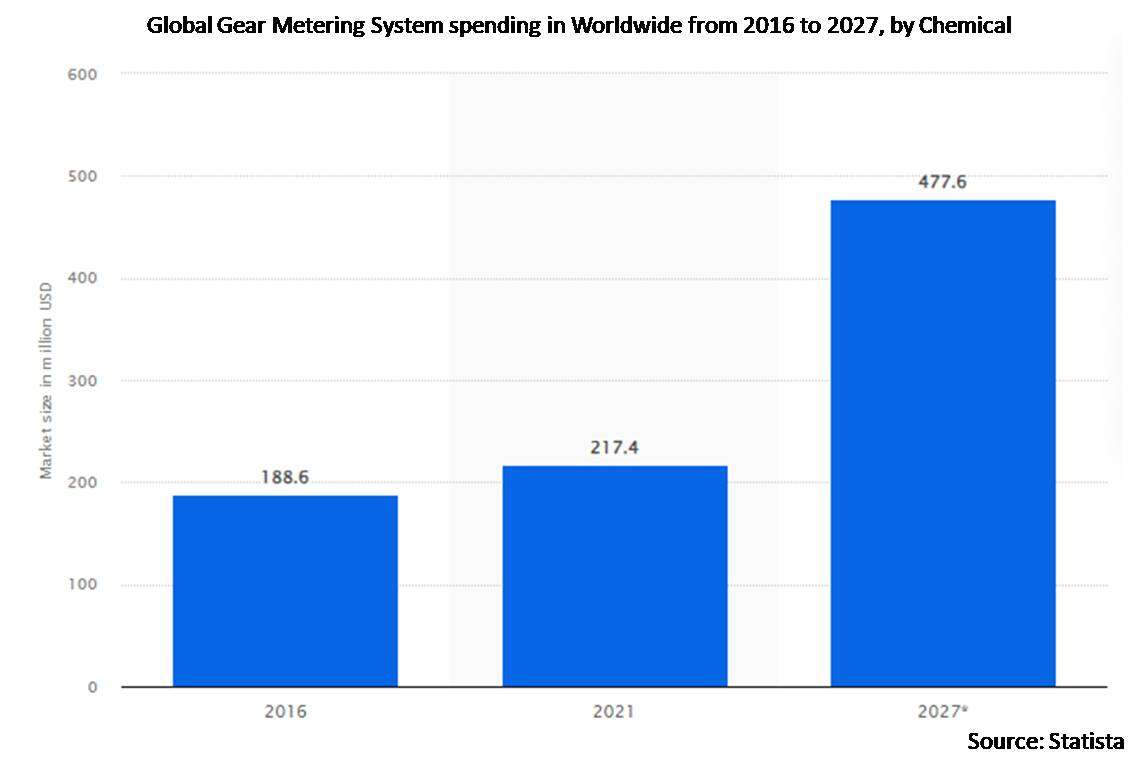
According to Stratistics MRC, the Global Gear Metering System Market is growing at a CAGR of 4.0% during the forecast period. A precision mechanism used in industrial applications to regulate the flow of fluids like chemicals, adhesives, or polymers is called a gear metering system. This system is made up of interlocking gears, which precisely measures and dispenses fluids in a controlled way which includes industries such as automotive manufacturing, electronics, aerospace, and various production processes.
Market Dynamics:
Driver:
Rising demand in automation
The need for precise and automated fluid dispensing solutions becomes paramount as industries increasingly embrace automation to enhance efficiency, accuracy, and productivity in manufacturing processes. The integration of these systems into automated workflows contributes to reduced labor costs, minimized errors, and enhanced overall production speed by achieving precision and efficiency in fluid dispensing within automated manufacturing environments which are boosting this market’s growth.
Restraint:
High initial expenses
The high cost of purchasing and deploying gear metering systems can put away prospective customers. These systems' difficult installation and maintenance procedures raise operating costs and put up further obstacles to entry. Moreover, the need for skilled technicians to ensure proper setup further adds to the overall expenditure. This high entry cost can be a deterrent for businesses operating on tighter budgets, limiting their ability to embrace the advantages of precise fluid dispensing, which hamper market growth.
Opportunity:
Technological innovations
The performance of gear metering systems is improved by innovations in sensor technologies and automation. These systems incorporate sensors for real-time monitoring of fluid viscosity, flow rates, and dispensing accuracy, allowing for adaptive adjustments and ensuring consistent performance. It is highly valued in industries like electronics, chemicals, and manufacturing, where efficiency and accuracy are critical. Furthermore, technological innovations not only address existing challenges but also open up new possibilities and reduce maintenance requirements, which boost this market size.
Threat:
Difficulties in installation and maintenance
The complex installation procedures cause delays and higher implementation costs, which would put off prospective purchasers. Companies looking to implement gear metering technology may find it difficult to find qualified technicians to operate these complex systems. In addition to operational complexity, the requirement for routine maintenance and troubleshooting can cause downtime, which lowers overall efficiency and consequently hampers market expansion.
Covid-19 Impact
COVID-19 had a negative effect on the gear metering system market, causing supply chain disruptions, manufacturing delays, and a decline in demand. Restrictions caused project delays and decreased investments across a range of industries, which impacted the uptake of gear metering technology. The economic downturn prompted cost-conscious approaches, impacting capital expenditures. Additionally, travel limitations also made installation and maintenance services more challenging, gradually hampering market expansion.
The single acting segment is expected to be the largest during the forecast period
The single acting segment is estimated to hold the largest share. These systems use a piston that only rotates in one direction to force the fluid through the metering gears. It is often used when a consistent and controlled dispensing of fluids, adhesives, or coatings is required in a specific direction. Furthermore, they play a crucial role in industries that need controlled fluid dispensing due to their accuracy, efficiency, and consistent volume delivery, which boosts this segment.
The electronics industry segment is expected to have the highest CAGR during the forecast period
The electronics industry segment is anticipated to have highest CAGR during the forecast period. These systems are essential for applications ranging from circuit board assembly to semiconductor production in the electronics industry. The need for precise and controlled fluid application in processes like coating, bonding, and encapsulation is covered in this specialized section. In addition, in the electronics industry, gear metering systems guarantee accurate adhesive, sealant, or a conductive material volume, which helps to produce dependable and high-performing electronic devices that significantly propel segment growth.
Region with largest share:
Europe commanded the largest market share during the extrapolated period due to government initiatives that prioritize environmentally friendly and productive manufacturing techniques. It encompasses countries and key players with diverse industrial sectors and advanced manufacturing technology in research and development. The market benefits from collaborations between technology providers and manufacturers, fostering the development of cutting-edge dispensing solutions to meet the evolving needs of European industries and thereby propelling regional expansion.
Region with highest CAGR:
North America is expected to witness highest CAGR over the projection period, owing to advanced manufacturing practices, including precision dispensing and coating applications. It includes sectors such as electronics, automotive, and aerospace, as well as improvements in manufacturing technologies. Key regions have partnered and collaborated to address changing industry needs enhancing production speed, reduce waste, and improve overall quality control for sustainability and environmentally friendly practices which are driving this region’s growth.

Key players in the market
Some of the key players in the Gear Metering System Market include Dopag, Exact Dispensing Systems, Nordson, Fluid Metering, Grunfeld, Ingersoll Rand, Oerlikon Group, Graco, Yantrik Techno, Viking Pump, Inc. and Würschum GmbH.
Key Developments:
In October 2023, Ingersoll Rand Inc. completed the acquisitions of Oxywise s.r.o. and Fraserwoods Fabrication and Machining Ltd. for a combined all-cash purchase price of approximately $26 million.
In August 2023, Nordson Corporation has completed the acquisition of the ARAG Group and its subsidiaries. ARAG is a global market and innovation leader in the development, production and supply of precision control systems and smart fluid components for agricultural spraying.
In April 2023, Graco Inc., a leading manufacturer of fluid handling equipment introduced the new Ultra® QuickShot™ – the first and only electric powered airless gun on the market, delivering higher quality results faster for every professional painting contractor.
Types Covered:
• Double Acting
• Single Acting
Applications Covered:
• Automobile Industry
• Achitechive
• Electronics Industry
• Chemical
• Other Applications
Regions Covered:
• North America
o US
o Canada
o Mexico
• Europe
o Germany
o UK
o Italy
o France
o Spain
o Rest of Europe
• Asia Pacific
o Japan
o China
o India
o Australia
o New Zealand
o South Korea
o Rest of Asia Pacific
• South America
o Argentina
o Brazil
o Chile
o Rest of South America
• Middle East & Africa
o Saudi Arabia
o UAE
o Qatar
o South Africa
o Rest of Middle East & Africa
What our report offers:
- Market share assessments for the regional and country-level segments
- Strategic recommendations for the new entrants
- Covers Market data for the years 2021, 2022, 2023, 2026, and 2030
- Market Trends (Drivers, Constraints, Opportunities, Threats, Challenges, Investment Opportunities, and recommendations)
- Strategic recommendations in key business segments based on the market estimations
- Competitive landscaping mapping the key common trends
- Company profiling with detailed strategies, financials, and recent developments
- Supply chain trends mapping the latest technological advancements
Free Customization Offerings:
All the customers of this report will be entitled to receive one of the following free customization options:
• Company Profiling
o Comprehensive profiling of additional market players (up to 3)
o SWOT Analysis of key players (up to 3)
• Regional Segmentation
o Market estimations, Forecasts and CAGR of any prominent country as per the client's interest (Note: Depends on feasibility check)
• Competitive Benchmarking
Benchmarking of key players based on product portfolio, geographical presence, and strategic alliances
Table of Contents
1 Executive Summary
2 Preface
2.1 Abstract
2.2 Stake Holders
2.3 Research Scope
2.4 Research Methodology
2.4.1 Data Mining
2.4.2 Data Analysis
2.4.3 Data Validation
2.4.4 Research Approach
2.5 Research Sources
2.5.1 Primary Research Sources
2.5.2 Secondary Research Sources
2.5.3 Assumptions
3 Market Trend Analysis
3.1 Introduction
3.2 Drivers
3.3 Restraints
3.4 Opportunities
3.5 Threats
3.6 Application Analysis
3.7 Emerging Markets
3.8 Impact of Covid-19
4 Porters Five Force Analysis
4.1 Bargaining power of suppliers
4.2 Bargaining power of buyers
4.3 Threat of substitutes
4.4 Threat of new entrants
4.5 Competitive rivalry
5 Global Gear Metering System Market, By Type
5.1 Introduction
5.2 Double Acting
5.3 Single Acting
6 Global Gear Metering System Market, By Application
6.1 Introduction
6.2 Automobile Industry
6.3 Achitechive
6.4 Electronics Industry
6.5 Chemical
6.6 Other Applications
7 Global Gear Metering System Market, By Geography
7.1 Introduction
7.1 North America
7.2.1 US
7.2.2 Canada
7.2.3 Mexico
7.3 Europe
7.3.1 Germany
7.3.2 UK
7.3.3 Italy
7.3.4 France
7.3.5 Spain
7.3.6 Rest of Europe
7.4 Asia Pacific
7.4.1 Japan
7.4.2 China
7.4.3 India
7.4.4 Australia
7.4.5 New Zealand
7.4.6 South Korea
7.4.7 Rest of Asia Pacific
7.5 South America
7.5.1 Argentina
7.5.2 Brazil
7.5.3 Chile
7.5.4 Rest of South America
7.6 Middle East & Africa
7.6.1 Saudi Arabia
7.6.2 UAE
7.6.3 Qatar
7.6.4 South Africa
7.6.5 Rest of Middle East & Africa
8 Key Developments
8.1 Agreements, Partnerships, Collaborations and Joint Ventures
8.2 Acquisitions & Mergers
8.3 New Product Launch
8.4 Expansions
8.5 Other Key Strategies
9 Company Profiling
9.1 Dopag
9.2 Exact Dispensing Systems
9.3 Nordson
9.4 Fluid Metering
9.5 Grunfeld
9.6 Ingersoll Rand
9.7 Oerlikon Group
9.8 Graco
9.9 Yantrik Techno
9.10 Viking Pump, Inc.
9.11 Würschum GmbH
List of Tables
1 Global Gear Metering System Market Outlook, By Region (2021-2030) ($MN)
2 Global Gear Metering System Market Outlook, By Type (2021-2030) ($MN)
3 Global Gear Metering System Market Outlook, By Double Acting (2021-2030) ($MN)
4 Global Gear Metering System Market Outlook, By Single Acting (2021-2030) ($MN)
5 Global Gear Metering System Market Outlook, By Application (2021-2030) ($MN)
6 Global Gear Metering System Market Outlook, By Automobile Industry (2021-2030) ($MN)
7 Global Gear Metering System Market Outlook, By Achitechive (2021-2030) ($MN)
8 Global Gear Metering System Market Outlook, By Electronics Industry (2021-2030) ($MN)
9 Global Gear Metering System Market Outlook, By Chemical (2021-2030) ($MN)
10 Global Gear Metering System Market Outlook, By Other Applications (2021-2030) ($MN)
11 North America Gear Metering System Market Outlook, By Country (2021-2030) ($MN)
12 North America Gear Metering System Market Outlook, By Type (2021-2030) ($MN)
13 North America Gear Metering System Market Outlook, By Double Acting (2021-2030) ($MN)
14 North America Gear Metering System Market Outlook, By Single Acting (2021-2030) ($MN)
15 North America Gear Metering System Market Outlook, By Application (2021-2030) ($MN)
16 North America Gear Metering System Market Outlook, By Automobile Industry (2021-2030) ($MN)
17 North America Gear Metering System Market Outlook, By Achitechive (2021-2030) ($MN)
18 North America Gear Metering System Market Outlook, By Electronics Industry (2021-2030) ($MN)
19 North America Gear Metering System Market Outlook, By Chemical (2021-2030) ($MN)
20 North America Gear Metering System Market Outlook, By Other Applications (2021-2030) ($MN)
21 Europe Gear Metering System Market Outlook, By Country (2021-2030) ($MN)
22 Europe Gear Metering System Market Outlook, By Type (2021-2030) ($MN)
23 Europe Gear Metering System Market Outlook, By Double Acting (2021-2030) ($MN)
24 Europe Gear Metering System Market Outlook, By Single Acting (2021-2030) ($MN)
25 Europe Gear Metering System Market Outlook, By Application (2021-2030) ($MN)
26 Europe Gear Metering System Market Outlook, By Automobile Industry (2021-2030) ($MN)
27 Europe Gear Metering System Market Outlook, By Achitechive (2021-2030) ($MN)
28 Europe Gear Metering System Market Outlook, By Electronics Industry (2021-2030) ($MN)
29 Europe Gear Metering System Market Outlook, By Chemical (2021-2030) ($MN)
30 Europe Gear Metering System Market Outlook, By Other Applications (2021-2030) ($MN)
31 Asia Pacific Gear Metering System Market Outlook, By Country (2021-2030) ($MN)
32 Asia Pacific Gear Metering System Market Outlook, By Type (2021-2030) ($MN)
33 Asia Pacific Gear Metering System Market Outlook, By Double Acting (2021-2030) ($MN)
34 Asia Pacific Gear Metering System Market Outlook, By Single Acting (2021-2030) ($MN)
35 Asia Pacific Gear Metering System Market Outlook, By Application (2021-2030) ($MN)
36 Asia Pacific Gear Metering System Market Outlook, By Automobile Industry (2021-2030) ($MN)
37 Asia Pacific Gear Metering System Market Outlook, By Achitechive (2021-2030) ($MN)
38 Asia Pacific Gear Metering System Market Outlook, By Electronics Industry (2021-2030) ($MN)
39 Asia Pacific Gear Metering System Market Outlook, By Chemical (2021-2030) ($MN)
40 Asia Pacific Gear Metering System Market Outlook, By Other Applications (2021-2030) ($MN)
41 South America Gear Metering System Market Outlook, By Country (2021-2030) ($MN)
42 South America Gear Metering System Market Outlook, By Type (2021-2030) ($MN)
43 South America Gear Metering System Market Outlook, By Double Acting (2021-2030) ($MN)
44 South America Gear Metering System Market Outlook, By Single Acting (2021-2030) ($MN)
45 South America Gear Metering System Market Outlook, By Application (2021-2030) ($MN)
46 South America Gear Metering System Market Outlook, By Automobile Industry (2021-2030) ($MN)
47 South America Gear Metering System Market Outlook, By Achitechive (2021-2030) ($MN)
48 South America Gear Metering System Market Outlook, By Electronics Industry (2021-2030) ($MN)
49 South America Gear Metering System Market Outlook, By Chemical (2021-2030) ($MN)
50 South America Gear Metering System Market Outlook, By Other Applications (2021-2030) ($MN)
51 Middle East & Africa Gear Metering System Market Outlook, By Country (2021-2030) ($MN)
52 Middle East & Africa Gear Metering System Market Outlook, By Type (2021-2030) ($MN)
53 Middle East & Africa Gear Metering System Market Outlook, By Double Acting (2021-2030) ($MN)
54 Middle East & Africa Gear Metering System Market Outlook, By Single Acting (2021-2030) ($MN)
55 Middle East & Africa Gear Metering System Market Outlook, By Application (2021-2030) ($MN)
56 Middle East & Africa Gear Metering System Market Outlook, By Automobile Industry (2021-2030) ($MN)
57 Middle East & Africa Gear Metering System Market Outlook, By Achitechive (2021-2030) ($MN)
58 Middle East & Africa Gear Metering System Market Outlook, By Electronics Industry (2021-2030) ($MN)
59 Middle East & Africa Gear Metering System Market Outlook, By Chemical (2021-2030) ($MN)
60 Middle East & Africa Gear Metering System Market Outlook, By Other Applications (2021-2030) ($MN)
List of Figures
RESEARCH METHODOLOGY

We at ‘Stratistics’ opt for an extensive research approach which involves data mining, data validation, and data analysis. The various research sources include in-house repository, secondary research, competitor’s sources, social media research, client internal data, and primary research.
Our team of analysts prefers the most reliable and authenticated data sources in order to perform the comprehensive literature search. With access to most of the authenticated data bases our team highly considers the best mix of information through various sources to obtain extensive and accurate analysis.
Each report takes an average time of a month and a team of 4 industry analysts. The time may vary depending on the scope and data availability of the desired market report. The various parameters used in the market assessment are standardized in order to enhance the data accuracy.
Data Mining
The data is collected from several authenticated, reliable, paid and unpaid sources and is filtered depending on the scope & objective of the research. Our reports repository acts as an added advantage in this procedure. Data gathering from the raw material suppliers, distributors and the manufacturers is performed on a regular basis, this helps in the comprehensive understanding of the products value chain. Apart from the above mentioned sources the data is also collected from the industry consultants to ensure the objective of the study is in the right direction.
Market trends such as technological advancements, regulatory affairs, market dynamics (Drivers, Restraints, Opportunities and Challenges) are obtained from scientific journals, market related national & international associations and organizations.
Data Analysis
From the data that is collected depending on the scope & objective of the research the data is subjected for the analysis. The critical steps that we follow for the data analysis include:
- Product Lifecycle Analysis
- Competitor analysis
- Risk analysis
- Porters Analysis
- PESTEL Analysis
- SWOT Analysis
The data engineering is performed by the core industry experts considering both the Marketing Mix Modeling and the Demand Forecasting. The marketing mix modeling makes use of multiple-regression techniques to predict the optimal mix of marketing variables. Regression factor is based on a number of variables and how they relate to an outcome such as sales or profits.
Data Validation
The data validation is performed by the exhaustive primary research from the expert interviews. This includes telephonic interviews, focus groups, face to face interviews, and questionnaires to validate our research from all aspects. The industry experts we approach come from the leading firms, involved in the supply chain ranging from the suppliers, distributors to the manufacturers and consumers so as to ensure an unbiased analysis.
We are in touch with more than 15,000 industry experts with the right mix of consultants, CEO's, presidents, vice presidents, managers, experts from both supply side and demand side, executives and so on.
The data validation involves the primary research from the industry experts belonging to:
- Leading Companies
- Suppliers & Distributors
- Manufacturers
- Consumers
- Industry/Strategic Consultants
Apart from the data validation the primary research also helps in performing the fill gap research, i.e. providing solutions for the unmet needs of the research which helps in enhancing the reports quality.
For more details about research methodology, kindly write to us at info@strategymrc.com
Frequently Asked Questions
In case of any queries regarding this report, you can contact the customer service by filing the “Inquiry Before Buy” form available on the right hand side. You may also contact us through email: info@strategymrc.com or phone: +1-301-202-5929
Yes, the samples are available for all the published reports. You can request them by filling the “Request Sample” option available in this page.
Yes, you can request a sample with your specific requirements. All the customized samples will be provided as per the requirement with the real data masked.
All our reports are available in Digital PDF format. In case if you require them in any other formats, such as PPT, Excel etc you can submit a request through “Inquiry Before Buy” form available on the right hand side. You may also contact us through email: info@strategymrc.com or phone: +1-301-202-5929
We offer a free 15% customization with every purchase. This requirement can be fulfilled for both pre and post sale. You may send your customization requirements through email at info@strategymrc.com or call us on +1-301-202-5929.
We have 3 different licensing options available in electronic format.
- Single User Licence: Allows one person, typically the buyer, to have access to the ordered product. The ordered product cannot be distributed to anyone else.
- 2-5 User Licence: Allows the ordered product to be shared among a maximum of 5 people within your organisation.
- Corporate License: Allows the product to be shared among all employees of your organisation regardless of their geographical location.
All our reports are typically be emailed to you as an attachment.
To order any available report you need to register on our website. The payment can be made either through CCAvenue or PayPal payments gateways which accept all international cards.
We extend our support to 6 months post sale. A post sale customization is also provided to cover your unmet needs in the report.
Request Customization
We offer complimentary customization of up to 15% with every purchase. To share your customization requirements, feel free to email us at info@strategymrc.com or call us on +1-301-202-5929. .
Please Note: Customization within the 15% threshold is entirely free of charge. If your request exceeds this limit, we will conduct a feasibility assessment. Following that, a detailed quote and timeline will be provided.
WHY CHOOSE US ?

Assured Quality
Best in class reports with high standard of research integrity

24X7 Research Support
Continuous support to ensure the best customer experience.

Free Customization
Adding more values to your product of interest.

Safe & Secure Access
Providing a secured environment for all online transactions.

Trusted by 600+ Brands
Serving the most reputed brands across the world.