
Geocomposites Market
Geocomposites Market Forecasts to 2032 - Global Analysis By Product (Geotextile-Geogrid Composites, Geomembrane-Geotextile Composites, Geonet-Geotextile Composites, Geocomposite Clay Liners, Geocomposite Drainage Nets and Other Products), Material, Function, Application, End User and By Geography

|
Years Covered |
2024-2032 |
|
Estimated Year Value (2025) |
US $523.43 MN |
|
Projected Year Value (2032) |
US $908.76 MN |
|
CAGR (2025 - 2032) |
8.2% |
|
Regions Covered |
North America, Europe, Asia Pacific, South America, and Middle East & Africa |
|
Countries Covered |
US, Canada, Mexico, Germany, UK, Italy, France, Spain, Japan, China, India, Australia, New Zealand, South Korea, Rest of Asia Pacific, South America, Argentina, Brazil, Chile, Middle East & Africa, Saudi Arabia, UAE, Qatar, and South Africa |
|
Largest Market |
Asia Pacific |
|
Highest Growing Market |
Middle East & Africa |
According to Stratistics MRC, the Global Geocomposites Market is accounted for $523.43 mllion in 2025 and is expected to reach $908.76 million by 2032 growing at a CAGR of 8.2% during the forecast period. Geocomposites are engineered materials that are made up of two or more geosynthetic products, such as geotextiles, geogrids, geomembranes, or geonets, and are intended to serve particular purposes like containment, drainage, filtration, separation, or reinforcement. Geocomposites provide improved performance and cost-effectiveness in environmental, transportation, and civil engineering projects by combining the unique qualities of individual geosynthetics. The complex site conditions of many applications, such as erosion control systems, landfill liners, road construction, and retaining walls, necessitate multipurpose solutions.
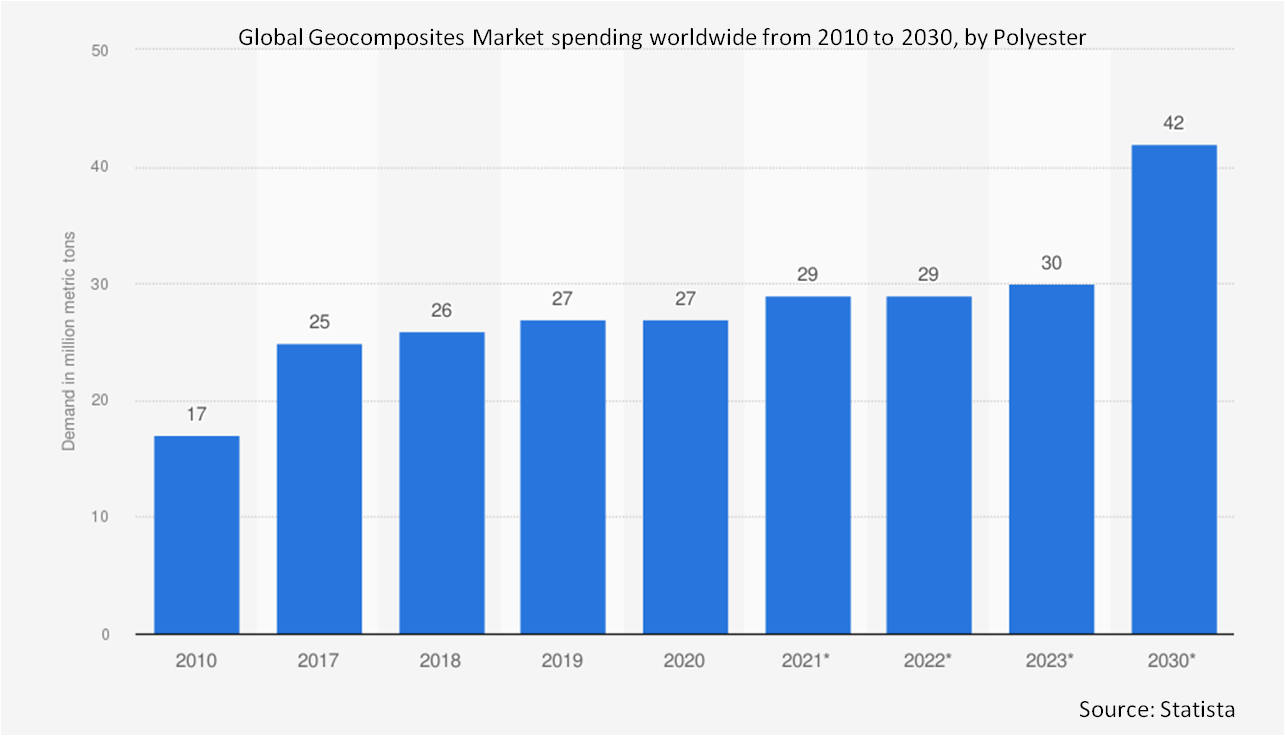
According to data from the International Geosynthetics Society (IGS), the global demand for geosynthetics has shown substantial growth over the years. In 2007, the total demand was 2,801 million m², which increased to 3,400 million m² in 2012, and further to 5,200 million m² by 2017. Specifically, the Asia/Pacific region witnessed a significant rise from 723 million m² in 2007 to 2,330 million m² in 2017.
Market Dynamics:
Driver:
Increasing use of landfills and waste management
The demand for engineered landfills is increasing as a result of urban populations producing more municipal solid waste. Because they allow for fluid drainage, gas venting, and leak detection, geocomposites are essential components of waste containment systems. To improve barrier performance, they are frequently combined with geomembranes. Additionally, preventing environmental contamination, geocomposites in landfills increase the volume available for waste disposal and decrease the amount of space occupied by conventional gravel drainage layers, which enhances operational efficiency.
Restraint:
Expensive starting costs and material costs
Geocomposites are frequently more expensive initially than conventional materials, despite their long-term advantages. This covers the price of the product itself as well as the cost of specialized tools and knowledgeable labor for correct installation. These upfront expenses may discourage adoption in small-scale projects or markets with tight budgets. Furthermore, the cost dynamics are further impacted by the fact that the raw materials used in geocomposites, like polymers, are subject to price swings caused by changes in the supply chain and oil prices.
Opportunity:
Growing expenditures on sustainable and green infrastructure
Geocomposites offer a significant opportunity as global infrastructure moves toward sustainability and resilience because of their ability to use less material, last longer, and perform better environmentally. Eco-friendly building materials are being prioritized by government initiatives such as India's Smart Cities Mission, the U.S. Bipartisan Infrastructure Law, and the EU Green Deal. Moreover, these objectives are well served by geocomposites, which help with erosion control, storm water management, and landfill protection.
Threat:
Competition from low-cost and conventional alternatives
Despite their improved performance, geocomposites are frequently more costly than more traditional options like concrete drainage systems, gravel, or sand filters. In markets that are sensitive to price or in projects with tight budgets, decision-makers might choose less expensive, locally accessible options. Furthermore, the market adoption of newer technologies like geocomposites may be slowed by the conservative nature of the construction industry, which means many stakeholders prefer materials they are more familiar with.
Covid-19 Impact:
The COVID-19 pandemic significantly affected the geocomposites market, mostly by delaying construction projects and upsetting the supply chain. Production and delivery of geocomposites were slowed by labor, logistics, and manufacturing constraints, which resulted in shortages and longer, lead times. Additionally, the demand for geocomposites, particularly in areas like environmental protection, renewable energy, and urban resilience, increased as building activities gradually resumed and attention turned to the development of sustainable infrastructure. The pandemic brought attention to the value of long-lasting and sustainable materials, which will propel market expansion going forward as long-term solutions become more and more important to industries.
The geotextile-geogrid composites segment is expected to be the largest during the forecast period
The geotextile-geogrid composites segment is expected to account for the largest market share during the forecast period. These composites combine the filtration, separation, and drainage capabilities of geotextiles with the soil-reinforcement qualities of geogrids. Road construction, slope stabilization, and foundation reinforcement are among the main uses for geotextile-geogrid composites, which are widely used in civil engineering and infrastructure projects. They are ideal for both soft and hard ground conditions because of their capacity to improve drainage, reduce soil erosion, and increase soil strength.
The polypropylene segment is expected to have the highest CAGR during the forecast period
Over the forecast period, the polypropylene segment is predicted to witness the highest growth rate. The high tensile strength, durability, and superior chemical resistance of polypropylene-based geocomposites make them popular for use in a variety of harsh environments, including road construction, drainage systems, and landfills. These materials perform exceptionally well in enhancing drainage, strengthening soil structures, and performing filtration and separation tasks. Additionally, the polypropylene segment is expanding at an accelerated rate due to the growing need for environmentally friendly building materials and the growing demand for sustainable infrastructure.
Region with largest share:
During the forecast period, the Asia Pacific region is expected to hold the largest market share, fueled by fast urbanization, industrialization, and infrastructure development, especially in nations like China, India, and Japan. The demand for geocomposites is being driven primarily by the region's expanding civil engineering and construction industries as well as rising investments in resilient and sustainable infrastructure. Furthermore, the use of geocomposites in drainage systems, landfills, and soil reinforcement is fueled by Asia-Pacific's strong emphasis on waste management, erosion prevention, and flood control.
Region with highest CAGR:
Over the forecast period, the Middle East and Africa (MEA) region is anticipated to exhibit the highest CAGR. Ongoing infrastructure development initiatives are the main driver of this growth, especially in the GCC nations of Saudi Arabia, the United Arab Emirates, and others where extensive urbanization and infrastructure modernization are top priorities. The market is growing as a result of the region's growing emphasis on environmentally friendly building materials, like geocomposites, for waste management, erosion prevention, and flood control. Furthermore, there is a significant need for geocomposites in soil stabilization, drainage systems, and landfills due to the growing mining, construction, and oil and gas industries in the MEA region.

Key players in the market
Some of the key players in Geocomposites Market include BASF SE, Thrace Group, Climax Synthetics Pvt. Ltd., Leggett & Platt, Incorporated, Terram Geosynthetics Private Limited, Huesker Synthetic GmbH, ABG Ltd., GSE Environmental, Koninklijke Ten Cate B.V., TenCate Geosynthetics Americas, Ocean Global, Skaps Industries, Tensar International Corporation, Maccaferri S.P.A and Officine Maccaferri Spa.
Key Developments:
In April 2025, BASF and the University of Toronto have signed a Master Research Agreement (MRA) to streamline innovation projects and increase collaboration between BASF and Canadian researchers. This partnership is part of a regional strategy to extend BASF's collaboration with universities in North America into Canada. This is a great achievement for BASF, as it marks the company's first MRA with a Canadian university.
In April 2025, Leggett & Platt has signed an agreement to sell its Aerospace Products Group to affiliated funds managed by Tinicum Incorporated for a cash purchase price of $285 million before customary working capital and debt-type adjustments. The transaction is expected to close in 2025 as soon as all closing conditions are met, including necessary regulatory approvals.
In August 2024, The Autonomous Bougainville Government (ABG) has announced the signing of a Memorandum of Understanding (MOU) with Stellae Energy Ltd (Stellae), a UK-based Green Energy Solutions and assets company. This partnership marks a significant achievement in Bougainville’s journey towards energy independence and economic sustainability through the exploration of the region’s volcanic geothermal resources.
Products Covered:
• Geotextile-Geogrid Composites
• Geomembrane-Geotextile Composites
• Geonet-Geotextile Composites
• Geocomposite Clay Liners
• Geocomposite Drainage Nets
• Other Products
Materials Covered:
• Bituminous
• Clay
• Polymeric
• Polyester
• Polyethylene
• Polypropylene
Functions Covered:
• Separation
• Drainage
• Reinforcement
• Containment
• Other Functions
Applications Covered:
• Water & Wastewater Management
• Roads & Highways
• Landfill & Mining
• Soil Reinforcement
• Railways
• Surface Erosion Control
• Other Applications
End Users Covered:
• Construction and Infrastructure
• Agriculture
• Mining
• Other End Users
Regions Covered:
• North America
o US
o Canada
o Mexico
• Europe
o Germany
o UK
o Italy
o France
o Spain
o Rest of Europe
• Asia Pacific
o Japan
o China
o India
o Australia
o New Zealand
o South Korea
o Rest of Asia Pacific
• South America
o Argentina
o Brazil
o Chile
o Rest of South America
• Middle East & Africa
o Saudi Arabia
o UAE
o Qatar
o South Africa
o Rest of Middle East & Africa
What our report offers:
- Market share assessments for the regional and country-level segments
- Strategic recommendations for the new entrants
- Covers Market data for the years 2024, 2025, 2026, 2028, and 2032
- Market Trends (Drivers, Constraints, Opportunities, Threats, Challenges, Investment Opportunities, and recommendations)
- Strategic recommendations in key business segments based on the market estimations
- Competitive landscaping mapping the key common trends
- Company profiling with detailed strategies, financials, and recent developments
- Supply chain trends mapping the latest technological advancements
Free Customization Offerings:
All the customers of this report will be entitled to receive one of the following free customization options:
• Company Profiling
o Comprehensive profiling of additional market players (up to 3)
o SWOT Analysis of key players (up to 3)
• Regional Segmentation
o Market estimations, Forecasts and CAGR of any prominent country as per the client's interest (Note: Depends on feasibility check)
• Competitive Benchmarking
o Benchmarking of key players based on product portfolio, geographical presence, and strategic alliances
Table of Contents
1 Executive Summary
2 Preface
2.1 Abstract
2.2 Stake Holders
2.3 Research Scope
2.4 Research Methodology
2.4.1 Data Mining
2.4.2 Data Analysis
2.4.3 Data Validation
2.4.4 Research Approach
2.5 Research Sources
2.5.1 Primary Research Sources
2.5.2 Secondary Research Sources
2.5.3 Assumptions
3 Market Trend Analysis
3.1 Introduction
3.2 Drivers
3.3 Restraints
3.4 Opportunities
3.5 Threats
3.6 Product Analysis
3.7 Application Analysis
3.8 End User Analysis
3.9 Emerging Markets
3.10 Impact of Covid-19
4 Porters Five Force Analysis
4.1 Bargaining power of suppliers
4.2 Bargaining power of buyers
4.3 Threat of substitutes
4.4 Threat of new entrants
4.5 Competitive rivalry
5 Global Geocomposites Market, By Product
5.1 Introduction
5.2 Geotextile-Geogrid Composites
5.3 Geomembrane-Geotextile Composites
5.4 Geonet-Geotextile Composites
5.5 Geocomposite Clay Liners
5.6 Geocomposite Drainage Nets
5.7 Other Products
6 Global Geocomposites Market, By Material
6.1 Introduction
6.2 Bituminous
6.3 Clay
6.4 Polymeric
6.5 Polyester
6.6 Polyethylene
6.7 Polypropylene
7 Global Geocomposites Market, By Function
7.1 Introduction
7.2 Separation
7.3 Drainage
7.4 Reinforcement
7.5 Containment
7.6 Other Functions
8 Global Geocomposites Market, By Application
8.1 Introduction
8.2 Water & Wastewater Management
8.3 Roads & Highways
8.4 Landfill & Mining
8.5 Soil Reinforcement
8.6 Railways
8.7 Surface Erosion Control
8.8 Other Applications
9 Global Geocomposites Market, By End User
9.1 Introduction
9.2 Construction and Infrastructure
9.3 Agriculture
9.4 Mining
9.5 Other End Users
10 Global Geocomposites Market, By Geography
10.1 Introduction
10.2 North America
10.2.1 US
10.2.2 Canada
10.2.3 Mexico
10.3 Europe
10.3.1 Germany
10.3.2 UK
10.3.3 Italy
10.3.4 France
10.3.5 Spain
10.3.6 Rest of Europe
10.4 Asia Pacific
10.4.1 Japan
10.4.2 China
10.4.3 India
10.4.4 Australia
10.4.5 New Zealand
10.4.6 South Korea
10.4.7 Rest of Asia Pacific
10.5 South America
10.5.1 Argentina
10.5.2 Brazil
10.5.3 Chile
10.5.4 Rest of South America
10.6 Middle East & Africa
10.6.1 Saudi Arabia
10.6.2 UAE
10.6.3 Qatar
10.6.4 South Africa
10.6.5 Rest of Middle East & Africa
11 Key Developments
11.1 Agreements, Partnerships, Collaborations and Joint Ventures
11.2 Acquisitions & Mergers
11.3 New Product Launch
11.4 Expansions
11.5 Other Key Strategies
12 Company Profiling
12.1 BASF SE
12.2 Thrace Group
12.3 Climax Synthetics Pvt. Ltd.
12.4 Leggett & Platt, Incorporated
12.5 Terram Geosynthetics Private Limited
12.6 Huesker Synthetic GmbH
12.7 ABG Ltd.
12.8 GSE Environmental
12.9 Koninklijke Ten Cate B.V.
12.10 TenCate Geosynthetics Americas
12.11 Ocean Global
12.12 Skaps Industries
12.13 Tensar International Corporation
12.14 Maccaferri S.P.A
12.15 Officine Maccaferri Spa
List of Tables
1 Global Geocomposites Market Outlook, By Region (2024-2032) ($MN)
2 Global Geocomposites Market Outlook, By Product (2024-2032) ($MN)
3 Global Geocomposites Market Outlook, By Geotextile-Geogrid Composites (2024-2032) ($MN)
4 Global Geocomposites Market Outlook, By Geomembrane-Geotextile Composites (2024-2032) ($MN)
5 Global Geocomposites Market Outlook, By Geonet-Geotextile Composites (2024-2032) ($MN)
6 Global Geocomposites Market Outlook, By Geocomposite Clay Liners (2024-2032) ($MN)
7 Global Geocomposites Market Outlook, By Geocomposite Drainage Nets (2024-2032) ($MN)
8 Global Geocomposites Market Outlook, By Other Products (2024-2032) ($MN)
9 Global Geocomposites Market Outlook, By Material (2024-2032) ($MN)
10 Global Geocomposites Market Outlook, By Bituminous (2024-2032) ($MN)
11 Global Geocomposites Market Outlook, By Clay (2024-2032) ($MN)
12 Global Geocomposites Market Outlook, By Polymeric (2024-2032) ($MN)
13 Global Geocomposites Market Outlook, By Polyester (2024-2032) ($MN)
14 Global Geocomposites Market Outlook, By Polyethylene (2024-2032) ($MN)
15 Global Geocomposites Market Outlook, By Polypropylene (2024-2032) ($MN)
16 Global Geocomposites Market Outlook, By Function (2024-2032) ($MN)
17 Global Geocomposites Market Outlook, By Separation (2024-2032) ($MN)
18 Global Geocomposites Market Outlook, By Drainage (2024-2032) ($MN)
19 Global Geocomposites Market Outlook, By Reinforcement (2024-2032) ($MN)
20 Global Geocomposites Market Outlook, By Containment (2024-2032) ($MN)
21 Global Geocomposites Market Outlook, By Other Functions (2024-2032) ($MN)
22 Global Geocomposites Market Outlook, By Application (2024-2032) ($MN)
23 Global Geocomposites Market Outlook, By Water & Wastewater Management (2024-2032) ($MN)
24 Global Geocomposites Market Outlook, By Roads & Highways (2024-2032) ($MN)
25 Global Geocomposites Market Outlook, By Landfill & Mining (2024-2032) ($MN)
26 Global Geocomposites Market Outlook, By Soil Reinforcement (2024-2032) ($MN)
27 Global Geocomposites Market Outlook, By Railways (2024-2032) ($MN)
28 Global Geocomposites Market Outlook, By Surface Erosion Control (2024-2032) ($MN)
29 Global Geocomposites Market Outlook, By Other Applications (2024-2032) ($MN)
30 Global Geocomposites Market Outlook, By End User (2024-2032) ($MN)
31 Global Geocomposites Market Outlook, By Construction and Infrastructure (2024-2032) ($MN)
32 Global Geocomposites Market Outlook, By Agriculture (2024-2032) ($MN)
33 Global Geocomposites Market Outlook, By Mining (2024-2032) ($MN)
34 Global Geocomposites Market Outlook, By Other End Users (2024-2032) ($MN)
Note: Tables for North America, Europe, APAC, South America, and Middle East & Africa Regions are also represented in the same manner as above.
List of Figures
RESEARCH METHODOLOGY

We at ‘Stratistics’ opt for an extensive research approach which involves data mining, data validation, and data analysis. The various research sources include in-house repository, secondary research, competitor’s sources, social media research, client internal data, and primary research.
Our team of analysts prefers the most reliable and authenticated data sources in order to perform the comprehensive literature search. With access to most of the authenticated data bases our team highly considers the best mix of information through various sources to obtain extensive and accurate analysis.
Each report takes an average time of a month and a team of 4 industry analysts. The time may vary depending on the scope and data availability of the desired market report. The various parameters used in the market assessment are standardized in order to enhance the data accuracy.
Data Mining
The data is collected from several authenticated, reliable, paid and unpaid sources and is filtered depending on the scope & objective of the research. Our reports repository acts as an added advantage in this procedure. Data gathering from the raw material suppliers, distributors and the manufacturers is performed on a regular basis, this helps in the comprehensive understanding of the products value chain. Apart from the above mentioned sources the data is also collected from the industry consultants to ensure the objective of the study is in the right direction.
Market trends such as technological advancements, regulatory affairs, market dynamics (Drivers, Restraints, Opportunities and Challenges) are obtained from scientific journals, market related national & international associations and organizations.
Data Analysis
From the data that is collected depending on the scope & objective of the research the data is subjected for the analysis. The critical steps that we follow for the data analysis include:
- Product Lifecycle Analysis
- Competitor analysis
- Risk analysis
- Porters Analysis
- PESTEL Analysis
- SWOT Analysis
The data engineering is performed by the core industry experts considering both the Marketing Mix Modeling and the Demand Forecasting. The marketing mix modeling makes use of multiple-regression techniques to predict the optimal mix of marketing variables. Regression factor is based on a number of variables and how they relate to an outcome such as sales or profits.
Data Validation
The data validation is performed by the exhaustive primary research from the expert interviews. This includes telephonic interviews, focus groups, face to face interviews, and questionnaires to validate our research from all aspects. The industry experts we approach come from the leading firms, involved in the supply chain ranging from the suppliers, distributors to the manufacturers and consumers so as to ensure an unbiased analysis.
We are in touch with more than 15,000 industry experts with the right mix of consultants, CEO's, presidents, vice presidents, managers, experts from both supply side and demand side, executives and so on.
The data validation involves the primary research from the industry experts belonging to:
- Leading Companies
- Suppliers & Distributors
- Manufacturers
- Consumers
- Industry/Strategic Consultants
Apart from the data validation the primary research also helps in performing the fill gap research, i.e. providing solutions for the unmet needs of the research which helps in enhancing the reports quality.
For more details about research methodology, kindly write to us at info@strategymrc.com
Frequently Asked Questions
In case of any queries regarding this report, you can contact the customer service by filing the “Inquiry Before Buy” form available on the right hand side. You may also contact us through email: info@strategymrc.com or phone: +1-301-202-5929
Yes, the samples are available for all the published reports. You can request them by filling the “Request Sample” option available in this page.
Yes, you can request a sample with your specific requirements. All the customized samples will be provided as per the requirement with the real data masked.
All our reports are available in Digital PDF format. In case if you require them in any other formats, such as PPT, Excel etc you can submit a request through “Inquiry Before Buy” form available on the right hand side. You may also contact us through email: info@strategymrc.com or phone: +1-301-202-5929
We offer a free 15% customization with every purchase. This requirement can be fulfilled for both pre and post sale. You may send your customization requirements through email at info@strategymrc.com or call us on +1-301-202-5929.
We have 3 different licensing options available in electronic format.
- Single User Licence: Allows one person, typically the buyer, to have access to the ordered product. The ordered product cannot be distributed to anyone else.
- 2-5 User Licence: Allows the ordered product to be shared among a maximum of 5 people within your organisation.
- Corporate License: Allows the product to be shared among all employees of your organisation regardless of their geographical location.
All our reports are typically be emailed to you as an attachment.
To order any available report you need to register on our website. The payment can be made either through CCAvenue or PayPal payments gateways which accept all international cards.
We extend our support to 6 months post sale. A post sale customization is also provided to cover your unmet needs in the report.
Request Customization
We offer complimentary customization of up to 15% with every purchase. To share your customization requirements, feel free to email us at info@strategymrc.com or call us on +1-301-202-5929. .
Please Note: Customization within the 15% threshold is entirely free of charge. If your request exceeds this limit, we will conduct a feasibility assessment. Following that, a detailed quote and timeline will be provided.
WHY CHOOSE US ?

Assured Quality
Best in class reports with high standard of research integrity

24X7 Research Support
Continuous support to ensure the best customer experience.

Free Customization
Adding more values to your product of interest.

Safe & Secure Access
Providing a secured environment for all online transactions.

Trusted by 600+ Brands
Serving the most reputed brands across the world.