
Global Distribution System Gds Market
Global Distribution System (GDS) Market Forecasts to 2028 - Global Analysis By Component (Service, software/platform), Application (Hotel & Resort, Car Rental, Cruise, Aviation, Other Applications), Types (Loop, B2C, Network, Radial, B2B) and By Geography

|
Years Covered |
2020-2028 |
|
Estimated Year Value (2022) |
US $4.94 MN |
|
Projected Year Value (2028) |
US $6.74 MN |
|
CAGR (2022 - 2028) |
5.3% |
|
Regions Covered |
North America, Europe, Asia Pacific, South America, and Middle East & Africa |
|
Countries Covered |
US, Canada, Mexico, Germany, UK, Italy, France, Spain, Japan, China, India, Australia, New Zealand, South Korea, Rest of Asia Pacific, South America, Argentina, Brazil, Chile, Middle East & Africa, Saudi Arabia, UAE, Qatar, and South Africa |
|
Largest Market |
North America |
|
Fastest Growing Market |
Asia Pacific |
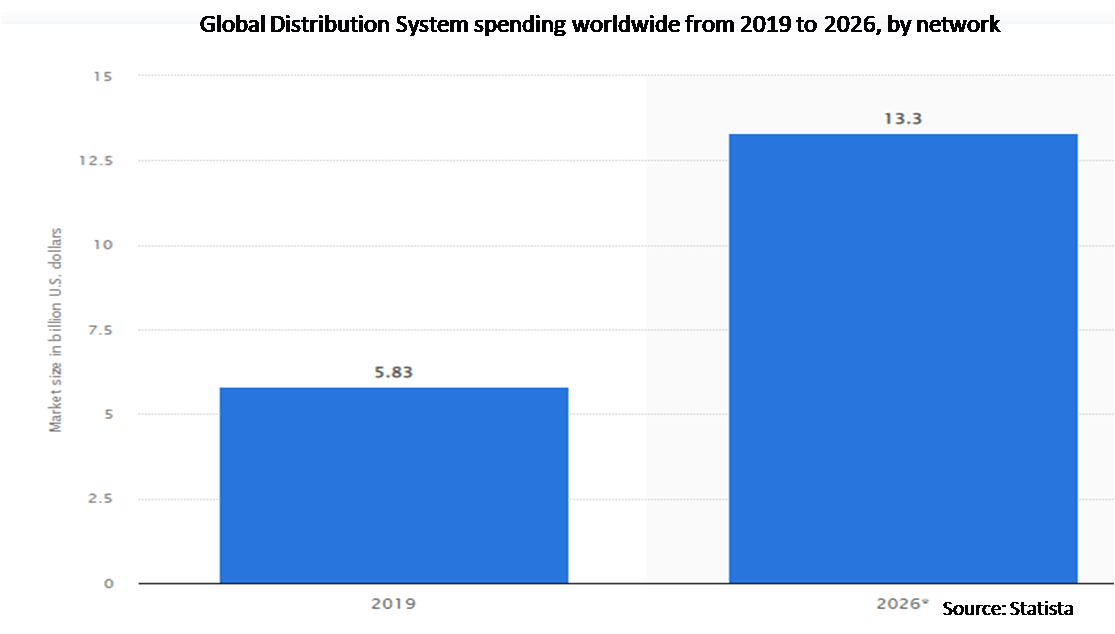
According to Stratistics MRC, the Global Distribution System (GDS) Market is accounted for $4.94 million in 2022 and is expected to reach $6.74 million by 2028 growing at a CAGR of 5.3% during the forecast period. The "Global Distribution System" (GDS) computerised reservation network serves as a single point of access for accommodating aeroplane seats, hotel rooms, rental vehicles, and other travel-related goods for travel agencies, online booking services, and large corporations. They are owned and run as joint ventures by prominent airlines, car rental companies, and hotel chains and are also known as automated reservation systems (ARS) or computerised reservation systems (CRS). A worldwide distribution system is a computerised network owned or operated by a company that makes it easier for airlines, hotels, car rental companies, and other travel service providers to conduct business with one another.
According to AltexSoft, GDS systems provided by Amadeus, Sabre, and Travel port are used by various hotel properties. Furthermore, increase in integration of GDS with hotels helps provide real-time access to the hotel's booking system. Companies in the hospitality industry are significantly investing in marketing programs to increase their customer base. According to Euromonitor International, the hospitality industry is highly fragmented, representing less than 30% of room revenue by the top 10 players in the global hotel chain in every region, except North America and Australia.
Market Dynamics:
Driver:
Rise in the demand for travel agents
In order to locate hotel rooms that suit their demands, GDS helps travel agencies. By giving thousands of travel agents a single point of access to book rooms, it enables them to connect with a sizable customer base dispersed around the globe. Furthermore, deeper GDS connection with hotels enables real-time access to the hotel's reservations system. In order to grow their clientele, businesses on the hotel sector are heavily investing in marketing initiatives. Utilizing GDS can aid in lowering marketing costs. A less expensive marketing option is thus made possible by the integration of hotels with GDS.
Restraint:
More Revenue
A GDS increases hotel revenue because it prominently displays the hotel's details, pricing, and availability. It enables hotels fill every available room within a given time period, while also accessing significant travel markets that are prepared to shell out cash to reserve the best room available. This is restraining the growth of GDS market.
Opportunity:
Rise in Adoption of GDS in Hotel Industry
GDS helps tour operators and travel companies locate hotels that suit their requirements. It gives thousands of travel agents a solitary tip of access to book rooms, enabling them to get in touch with a lot of clients spread out all over the world. Additionally, deeper GDS connectivity with hotels enables real-time access to the hotel's reservation system. To grow their clientele, businesses in the hospitality sector are making large investments in marketing campaigns. The use of GDS can assist cut down on marketing expenses. As a result, the integration of hotels with GDS aids in offering a more affordable alternative to marketing.
Threat:
Declining audience
A GDS's ability to capture the corporate traveller market is one of its advantages, but business travel's growth is waning. When businesses book hotels and flights, they do it through travel agencies, which a GDS is good at catching. However, a business might prefer to approach one hotel chain in hard times to increase its negotiation power for reduced rates.
Covid-19 Impact
Because the general economic situation of the majority of people has been adversely impacted by this outbreak of covid-19, consumer demand has subsequently decreased as people are now more eager to cut non-essential expenses from their individual budgets. Over the anticipated period, the aforementioned factors are anticipated to have a negative impact on the global distribution system market's revenue trajectory. The Global Distribution System market is anticipated to rebound as soon as the relevant governing bodies start to relax these imposed lockdowns.
The Cloud based segment is expected to be the largest during the forecast period
The cloud segment is estimated to have a lucrative growth, due to the development of cloud-based distribution networks will lower the high cost of hardware resources while boosting the acceptance of software in the creation of global distribution networks. However, the challenges brought on by frequent software changes are gradually pushing market players toward outsourced global distribution systems, and this trend is anticipated to pick up speed throughout the projected period.
The Hotel & Resorts segment is expected to have the highest CAGR during the forecast period
The hotel & resorts segment is anticipated to witness the fastest CAGR growth during the forecast period, due to successful forays into resort and hotel booking global distribution networks, as well as consumers' desire for leisure travel and increases in spending on "experience" over "things," the Hotel & Resorts reservation. Market participants will also continue to gain a lot from the aviation industry as new airlines have a significant impact on airfares and international travel is getting easier than ever.
Region with highest share:
North America is projected to hold the largest market share during the forecast period owing to the rising demand for cloud-based GDS solutions. Leading GDS providers, SMEs, and travel agencies are all present in the US, which is anticipated to stimulate the market in each of these areas. The market in these areas is being boosted by the presence of large GDS providers in the U.S., as well as SMEs and the travel sector. During the forecast period, a rise in demand for cloud-based GDS solutions is anticipated to boost the market in North America.
Region with highest CAGR:
Asia Pacific is projected to have the highest CAGR over the forecast period, owing to growing technology advancements in the hospitality and civil aviation sectors create a need for GDS to increase sales and customer base. The Asia Pacific market's growth engines are China and India.

Key players in the market
Some of the key players profiled in the Global Distribution System (GDS) Market include Amadeus IT Group SA, Siteminder Distribution Limited, Go First, Travelsky Technology Limited, Hotelogix, Sabre Corporation , Pegasus, Elexicon Energy , Infini Travel Information Inc., Air India, Travelport, Quick Travel Affiliate, Sharika Enterprises Ltd., HotelSimply, Travelomatix, Transcape Technology, FBT Adventures, SiteMinder, FlightsLogic and LuxuryRes.
Key Developments:
In July 2022, Go First, an Indian ultra-low-cost carrier, entered into a partnership with World Ticket, a GDS sub-hosting solution provider that helps Go First flights via their GDS. World Ticket acts as the marketing and validating carrier for Go First, thereby extending the global presence of Go First.
In May 2022, Sabre Corporation signed a new distribution agreement with Viva Aerobus. The new agreement enables the airline to accelerate revenue growth through agency sales.
In January 2022, Air India signed a partnership agreement with Amadeus after dropping Sabre to provide all domestic and international flight content from the carrier to its wide network of travel agents across the globe.
In October 2021, Sharika Enterprises Ltd. received a contract to design, supply, install, commission, and maintain the Feeder Automation System as part of the Distribution Management System to improve the reliability of the power distribution in Jammu and Kashmir, India.
In October 2021, Sabre Corporation signed a partnership agreement with Emirates to deliver the latter’s content with personalized offers to Sabre-connected travel buyers and agencies through Sabre’s GDS.
In May 2021, Elexicon Energy partnered with Marshall Homes and Opus’s One Solutions to create a living smart grid pilot community called Altona Towns in Canada. Ontario’s Ministry of Energy funds the project under the Smart Grid and Grid Innovation funds. The project will test, develop and launch the next generation of technologies to turn electricity distribution systems into modern, digitally-enabled grids.
Components Covered:
• Service
• software/platform
Applications Covered:
• Hotel & Resort
• Car Rental
• Cruise
• Aviation
• Other Applications
Types Covered:
• Loop
• B2C
• Network
• Radial
• B2B
Regions Covered:
• North America
o US
o Canada
o Mexico
• Europe
o Germany
o UK
o Italy
o France
o Spain
o Rest of Europe
• Asia Pacific
o Japan
o China
o India
o Australia
o New Zealand
o South Korea
o Rest of Asia Pacific
• South America
o Argentina
o Brazil
o Chile
o Rest of South America
• Middle East & Africa
o Saudi Arabia
o UAE
o Qatar
o South Africa
o Rest of Middle East & Africa
What our report offers:
- Market share assessments for the regional and country-level segments
- Strategic recommendations for the new entrants
- Covers Market data for the years 2020, 2021, 2022, 2025, and 2028
- Market Trends (Drivers, Constraints, Opportunities, Threats, Challenges, Investment Opportunities, and recommendations)
- Strategic recommendations in key business segments based on the market estimations
- Competitive landscaping mapping the key common trends
- Company profiling with detailed strategies, financials, and recent developments
- Supply chain trends mapping the latest technological advancements
Free Customization Offerings:
All the customers of this report will be entitled to receive one of the following free customization options:
• Company Profiling
o Comprehensive profiling of additional market players (up to 3)
o SWOT Analysis of key players (up to 3)
• Regional Segmentation
o Market estimations, Forecasts and CAGR of any prominent country as per the client's interest (Note: Depends on feasibility check)
• Competitive Benchmarking
o Benchmarking of key players based on product portfolio, geographical presence, and strategic alliances
Table of Contents
1 Executive Summary
2 Preface
2.1 Abstract
2.2 Stake Holders
2.3 Research Scope
2.4 Research Methodology
2.4.1 Data Mining
2.4.2 Data Analysis
2.4.3 Data Validation
2.4.4 Research Approach
2.5 Research Sources
2.5.1 Primary Research Sources
2.5.2 Secondary Research Sources
2.5.3 Assumptions
3 Market Trend Analysis
3.1 Introduction
3.2 Drivers
3.3 Restraints
3.4 Opportunities
3.5 Threats
3.6 Application Analysis
3.7 Emerging Markets
3.8 Impact of Covid-19
4 Porters Five Force Analysis
4.1 Bargaining power of suppliers
4.2 Bargaining power of buyers
4.3 Threat of substitutes
4.4 Threat of new entrants
4.5 Competitive rivalry
5 Global Distribution System (GDS) Market, By Component
5.1 Introduction
5.2 Service
5.2.1 Implementation
5.2.2 Professional Services
5.2.3 Managed / Outsourced
5.2.4 Support & Maintenance
5.2.5 Consulting & Training
5.3 Software/platform
5.3.1 Cloud Based
5.3.2 On-premise
6 Global Distribution System (GDS) Market, By Application
6.1 Introduction
6.2 Hotel & Resort
6.3 Car Rental
6.4 Cruise
6.5 Aviation
6.6 Other Applications
7 Global Distribution System (GDS) Market, By Types
7.1 Introduction
7.2 Loop
7.3 B2C
7.4 Network
7.5 Radial
7.6 B2B
8 Global Distribution System (GDS) Market, By Geography
8.1 Introduction
8.2 North America
8.2.1 US
8.2.2 Canada
8.2.3 Mexico
8.3 Europe
8.3.1 Germany
8.3.2 UK
8.3.3 Italy
8.3.4 France
8.3.5 Spain
8.3.6 Rest of Europe
8.4 Asia Pacific
8.4.1 Japan
8.4.2 China
8.4.3 India
8.4.4 Australia
8.4.5 New Zealand
8.4.6 South Korea
8.4.7 Rest of Asia Pacific
8.5 South America
8.5.1 Argentina
8.5.2 Brazil
8.5.3 Chile
8.5.4 Rest of South America
8.6 Middle East & Africa
8.6.1 Saudi Arabia
8.6.2 UAE
8.6.3 Qatar
8.6.4 South Africa
8.6.5 Rest of Middle East & Africa
9 Key Developments
9.1 Agreements, Partnerships, Collaborations and Joint Ventures
9.2 Acquisitions & Mergers
9.3 New Product Launch
9.4 Expansions
9.5 Other Key Strategies
10 Company Profiling
10.1 Amadeus IT Group SA
10.2 Siteminder Distribution Limited
10.3 Go First
10.4 Travelsky Technology Limited
10.5 Hotelogix
10.6 Sabre Corporation
10.7 Pegasus
10.8 Elexicon Energy
10.9 Infini Travel Information Inc.
10.10 Air India
10.11 Travelport
10.12 Quick Travel Affiliate
10.13 Sharika Enterprises Ltd.
10.14 HotelSimply
10.15 Travelomatix
10.16 Transcape Technology
10.17 FBT Adventures
10.18 SiteMinder
10.19 FlightsLogic
10.20 LuxuryRes
List of Tables
1 Global Distribution System (GDS) Market Outlook, By Region (2020-2028) ($MN)
2 Global Distribution System (GDS) Market Outlook, By Component (2020-2028) ($MN)
3 Global Distribution System (GDS) Market Outlook, By Service (2020-2028) ($MN)
4 Global Distribution System (GDS) Market Outlook, By Implementation (2020-2028) ($MN)
5 Global Distribution System (GDS) Market Outlook, By Professional Services (2020-2028) ($MN)
6 Global Distribution System (GDS) Market Outlook, By Managed / Outsourced (2020-2028) ($MN)
7 Global Distribution System (GDS) Market Outlook, By Support & Maintenance (2020-2028) ($MN)
8 Global Distribution System (GDS) Market Outlook, By Consulting & Training (2020-2028) ($MN)
9 Global Distribution System (GDS) Market Outlook, By Software/platform (2020-2028) ($MN)
10 Global Distribution System (GDS) Market Outlook, By Cloud Based (2020-2028) ($MN)
11 Global Distribution System (GDS) Market Outlook, By On-premise (2020-2028) ($MN)
12 Global Distribution System (GDS) Market Outlook, By Application (2020-2028) ($MN)
13 Global Distribution System (GDS) Market Outlook, By Hotel & Resort (2020-2028) ($MN)
14 Global Distribution System (GDS) Market Outlook, By Car Rental (2020-2028) ($MN)
15 Global Distribution System (GDS) Market Outlook, By Cruise (2020-2028) ($MN)
16 Global Distribution System (GDS) Market Outlook, By Aviation (2020-2028) ($MN)
17 Global Distribution System (GDS) Market Outlook, By Other Applications (2020-2028) ($MN)
18 Global Distribution System (GDS) Market Outlook, By Types (2020-2028) ($MN)
19 Global Distribution System (GDS) Market Outlook, By Loop (2020-2028) ($MN)
20 Global Distribution System (GDS) Market Outlook, By B2C (2020-2028) ($MN)
21 Global Distribution System (GDS) Market Outlook, By Network (2020-2028) ($MN)
22 Global Distribution System (GDS) Market Outlook, By Radial (2020-2028) ($MN)
23 Global Distribution System (GDS) Market Outlook, By B2B (2020-2028) ($MN)
24 North America Global Distribution System (GDS) Market Outlook, By Country (2020-2028) ($MN)
25 North America Global Distribution System (GDS) Market Outlook, By Component (2020-2028) ($MN)
26 North America Global Distribution System (GDS) Market Outlook, By Service (2020-2028) ($MN)
27 North America Global Distribution System (GDS) Market Outlook, By Implementation (2020-2028) ($MN)
28 North America Global Distribution System (GDS) Market Outlook, By Professional Services (2020-2028) ($MN)
29 North America Global Distribution System (GDS) Market Outlook, By Managed / Outsourced (2020-2028) ($MN)
30 North America Global Distribution System (GDS) Market Outlook, By Support & Maintenance (2020-2028) ($MN)
31 North America Global Distribution System (GDS) Market Outlook, By Consulting & Training (2020-2028) ($MN)
32 North America Global Distribution System (GDS) Market Outlook, By Software/platform (2020-2028) ($MN)
33 North America Global Distribution System (GDS) Market Outlook, By Cloud Based (2020-2028) ($MN)
34 North America Global Distribution System (GDS) Market Outlook, By On-premise (2020-2028) ($MN)
35 North America Global Distribution System (GDS) Market Outlook, By Application (2020-2028) ($MN)
36 North America Global Distribution System (GDS) Market Outlook, By Hotel & Resort (2020-2028) ($MN)
37 North America Global Distribution System (GDS) Market Outlook, By Car Rental (2020-2028) ($MN)
38 North America Global Distribution System (GDS) Market Outlook, By Cruise (2020-2028) ($MN)
39 North America Global Distribution System (GDS) Market Outlook, By Aviation (2020-2028) ($MN)
40 North America Global Distribution System (GDS) Market Outlook, By Other Applications (2020-2028) ($MN)
41 North America Global Distribution System (GDS) Market Outlook, By Types (2020-2028) ($MN)
42 North America Global Distribution System (GDS) Market Outlook, By Loop (2020-2028) ($MN)
43 North America Global Distribution System (GDS) Market Outlook, By B2C (2020-2028) ($MN)
44 North America Global Distribution System (GDS) Market Outlook, By Network (2020-2028) ($MN)
45 North America Global Distribution System (GDS) Market Outlook, By Radial (2020-2028) ($MN)
46 North America Global Distribution System (GDS) Market Outlook, By B2B (2020-2028) ($MN)
47 Europe Global Distribution System (GDS) Market Outlook, By Country (2020-2028) ($MN)
48 Europe Global Distribution System (GDS) Market Outlook, By Component (2020-2028) ($MN)
49 Europe Global Distribution System (GDS) Market Outlook, By Service (2020-2028) ($MN)
50 Europe Global Distribution System (GDS) Market Outlook, By Implementation (2020-2028) ($MN)
51 Europe Global Distribution System (GDS) Market Outlook, By Professional Services (2020-2028) ($MN)
52 Europe Global Distribution System (GDS) Market Outlook, By Managed / Outsourced (2020-2028) ($MN)
53 Europe Global Distribution System (GDS) Market Outlook, By Support & Maintenance (2020-2028) ($MN)
54 Europe Global Distribution System (GDS) Market Outlook, By Consulting & Training (2020-2028) ($MN)
55 Europe Global Distribution System (GDS) Market Outlook, By Software/platform (2020-2028) ($MN)
56 Europe Global Distribution System (GDS) Market Outlook, By Cloud Based (2020-2028) ($MN)
57 Europe Global Distribution System (GDS) Market Outlook, By On-premise (2020-2028) ($MN)
58 Europe Global Distribution System (GDS) Market Outlook, By Application (2020-2028) ($MN)
59 Europe Global Distribution System (GDS) Market Outlook, By Hotel & Resort (2020-2028) ($MN)
60 Europe Global Distribution System (GDS) Market Outlook, By Car Rental (2020-2028) ($MN)
61 Europe Global Distribution System (GDS) Market Outlook, By Cruise (2020-2028) ($MN)
62 Europe Global Distribution System (GDS) Market Outlook, By Aviation (2020-2028) ($MN)
63 Europe Global Distribution System (GDS) Market Outlook, By Other Applications (2020-2028) ($MN)
64 Europe Global Distribution System (GDS) Market Outlook, By Types (2020-2028) ($MN)
65 Europe Global Distribution System (GDS) Market Outlook, By Loop (2020-2028) ($MN)
66 Europe Global Distribution System (GDS) Market Outlook, By B2C (2020-2028) ($MN)
67 Europe Global Distribution System (GDS) Market Outlook, By Network (2020-2028) ($MN)
68 Europe Global Distribution System (GDS) Market Outlook, By Radial (2020-2028) ($MN)
69 Europe Global Distribution System (GDS) Market Outlook, By B2B (2020-2028) ($MN)
70 Asia Pacific Global Distribution System (GDS) Market Outlook, By Country (2020-2028) ($MN)
71 Asia Pacific Global Distribution System (GDS) Market Outlook, By Component (2020-2028) ($MN)
72 Asia Pacific Global Distribution System (GDS) Market Outlook, By Service (2020-2028) ($MN)
73 Asia Pacific Global Distribution System (GDS) Market Outlook, By Implementation (2020-2028) ($MN)
74 Asia Pacific Global Distribution System (GDS) Market Outlook, By Professional Services (2020-2028) ($MN)
75 Asia Pacific Global Distribution System (GDS) Market Outlook, By Managed / Outsourced (2020-2028) ($MN)
76 Asia Pacific Global Distribution System (GDS) Market Outlook, By Support & Maintenance (2020-2028) ($MN)
77 Asia Pacific Global Distribution System (GDS) Market Outlook, By Consulting & Training (2020-2028) ($MN)
78 Asia Pacific Global Distribution System (GDS) Market Outlook, By Software/platform (2020-2028) ($MN)
79 Asia Pacific Global Distribution System (GDS) Market Outlook, By Cloud Based (2020-2028) ($MN)
80 Asia Pacific Global Distribution System (GDS) Market Outlook, By On-premise (2020-2028) ($MN)
81 Asia Pacific Global Distribution System (GDS) Market Outlook, By Application (2020-2028) ($MN)
82 Asia Pacific Global Distribution System (GDS) Market Outlook, By Hotel & Resort (2020-2028) ($MN)
83 Asia Pacific Global Distribution System (GDS) Market Outlook, By Car Rental (2020-2028) ($MN)
84 Asia Pacific Global Distribution System (GDS) Market Outlook, By Cruise (2020-2028) ($MN)
85 Asia Pacific Global Distribution System (GDS) Market Outlook, By Aviation (2020-2028) ($MN)
86 Asia Pacific Global Distribution System (GDS) Market Outlook, By Other Applications (2020-2028) ($MN)
87 Asia Pacific Global Distribution System (GDS) Market Outlook, By Types (2020-2028) ($MN)
88 Asia Pacific Global Distribution System (GDS) Market Outlook, By Loop (2020-2028) ($MN)
89 Asia Pacific Global Distribution System (GDS) Market Outlook, By B2C (2020-2028) ($MN)
90 Asia Pacific Global Distribution System (GDS) Market Outlook, By Network (2020-2028) ($MN)
91 Asia Pacific Global Distribution System (GDS) Market Outlook, By Radial (2020-2028) ($MN)
92 Asia Pacific Global Distribution System (GDS) Market Outlook, By B2B (2020-2028) ($MN)
93 South America Global Distribution System (GDS) Market Outlook, By Country (2020-2028) ($MN)
94 South America Global Distribution System (GDS) Market Outlook, By Component (2020-2028) ($MN)
95 South America Global Distribution System (GDS) Market Outlook, By Service (2020-2028) ($MN)
96 South America Global Distribution System (GDS) Market Outlook, By Implementation (2020-2028) ($MN)
97 South America Global Distribution System (GDS) Market Outlook, By Professional Services (2020-2028) ($MN)
98 South America Global Distribution System (GDS) Market Outlook, By Managed / Outsourced (2020-2028) ($MN)
99 South America Global Distribution System (GDS) Market Outlook, By Support & Maintenance (2020-2028) ($MN)
100 South America Global Distribution System (GDS) Market Outlook, By Consulting & Training (2020-2028) ($MN)
101 South America Global Distribution System (GDS) Market Outlook, By Software/platform (2020-2028) ($MN)
102 South America Global Distribution System (GDS) Market Outlook, By Cloud Based (2020-2028) ($MN)
103 South America Global Distribution System (GDS) Market Outlook, By On-premise (2020-2028) ($MN)
104 South America Global Distribution System (GDS) Market Outlook, By Application (2020-2028) ($MN)
105 South America Global Distribution System (GDS) Market Outlook, By Hotel & Resort (2020-2028) ($MN)
106 South America Global Distribution System (GDS) Market Outlook, By Car Rental (2020-2028) ($MN)
107 South America Global Distribution System (GDS) Market Outlook, By Cruise (2020-2028) ($MN)
108 South America Global Distribution System (GDS) Market Outlook, By Aviation (2020-2028) ($MN)
109 South America Global Distribution System (GDS) Market Outlook, By Other Applications (2020-2028) ($MN)
110 South America Global Distribution System (GDS) Market Outlook, By Types (2020-2028) ($MN)
111 South America Global Distribution System (GDS) Market Outlook, By Loop (2020-2028) ($MN)
112 South America Global Distribution System (GDS) Market Outlook, By B2C (2020-2028) ($MN)
113 South America Global Distribution System (GDS) Market Outlook, By Network (2020-2028) ($MN)
114 South America Global Distribution System (GDS) Market Outlook, By Radial (2020-2028) ($MN)
115 South America Global Distribution System (GDS) Market Outlook, By B2B (2020-2028) ($MN)
116 Middle East & Africa Global Distribution System (GDS) Market Outlook, By Country (2020-2028) ($MN)
117 Middle East & Africa Global Distribution System (GDS) Market Outlook, By Component (2020-2028) ($MN)
118 Middle East & Africa Global Distribution System (GDS) Market Outlook, By Service (2020-2028) ($MN)
119 Middle East & Africa Global Distribution System (GDS) Market Outlook, By Implementation (2020-2028) ($MN)
120 Middle East & Africa Global Distribution System (GDS) Market Outlook, By Professional Services (2020-2028) ($MN)
121 Middle East & Africa Global Distribution System (GDS) Market Outlook, By Managed / Outsourced (2020-2028) ($MN)
122 Middle East & Africa Global Distribution System (GDS) Market Outlook, By Support & Maintenance (2020-2028) ($MN)
123 Middle East & Africa Global Distribution System (GDS) Market Outlook, By Consulting & Training (2020-2028) ($MN)
124 Middle East & Africa Global Distribution System (GDS) Market Outlook, By Software/platform (2020-2028) ($MN)
125 Middle East & Africa Global Distribution System (GDS) Market Outlook, By Cloud Based (2020-2028) ($MN)
126 Middle East & Africa Global Distribution System (GDS) Market Outlook, By On-premise (2020-2028) ($MN)
127 Middle East & Africa Global Distribution System (GDS) Market Outlook, By Application (2020-2028) ($MN)
128 Middle East & Africa Global Distribution System (GDS) Market Outlook, By Hotel & Resort (2020-2028) ($MN)
129 Middle East & Africa Global Distribution System (GDS) Market Outlook, By Car Rental (2020-2028) ($MN)
130 Middle East & Africa Global Distribution System (GDS) Market Outlook, By Cruise (2020-2028) ($MN)
131 Middle East & Africa Global Distribution System (GDS) Market Outlook, By Aviation (2020-2028) ($MN)
132 Middle East & Africa Global Distribution System (GDS) Market Outlook, By Other Applications (2020-2028) ($MN)
133 Middle East & Africa Global Distribution System (GDS) Market Outlook, By Types (2020-2028) ($MN)
134 Middle East & Africa Global Distribution System (GDS) Market Outlook, By Loop (2020-2028) ($MN)
135 Middle East & Africa Global Distribution System (GDS) Market Outlook, By B2C (2020-2028) ($MN)
136 Middle East & Africa Global Distribution System (GDS) Market Outlook, By Network (2020-2028) ($MN)
137 Middle East & Africa Global Distribution System (GDS) Market Outlook, By Radial (2020-2028) ($MN)
138 Middle East & Africa Global Distribution System (GDS) Market Outlook, By B2B (2020-2028) ($MN)
List of Figures
RESEARCH METHODOLOGY

We at ‘Stratistics’ opt for an extensive research approach which involves data mining, data validation, and data analysis. The various research sources include in-house repository, secondary research, competitor’s sources, social media research, client internal data, and primary research.
Our team of analysts prefers the most reliable and authenticated data sources in order to perform the comprehensive literature search. With access to most of the authenticated data bases our team highly considers the best mix of information through various sources to obtain extensive and accurate analysis.
Each report takes an average time of a month and a team of 4 industry analysts. The time may vary depending on the scope and data availability of the desired market report. The various parameters used in the market assessment are standardized in order to enhance the data accuracy.
Data Mining
The data is collected from several authenticated, reliable, paid and unpaid sources and is filtered depending on the scope & objective of the research. Our reports repository acts as an added advantage in this procedure. Data gathering from the raw material suppliers, distributors and the manufacturers is performed on a regular basis, this helps in the comprehensive understanding of the products value chain. Apart from the above mentioned sources the data is also collected from the industry consultants to ensure the objective of the study is in the right direction.
Market trends such as technological advancements, regulatory affairs, market dynamics (Drivers, Restraints, Opportunities and Challenges) are obtained from scientific journals, market related national & international associations and organizations.
Data Analysis
From the data that is collected depending on the scope & objective of the research the data is subjected for the analysis. The critical steps that we follow for the data analysis include:
- Product Lifecycle Analysis
- Competitor analysis
- Risk analysis
- Porters Analysis
- PESTEL Analysis
- SWOT Analysis
The data engineering is performed by the core industry experts considering both the Marketing Mix Modeling and the Demand Forecasting. The marketing mix modeling makes use of multiple-regression techniques to predict the optimal mix of marketing variables. Regression factor is based on a number of variables and how they relate to an outcome such as sales or profits.
Data Validation
The data validation is performed by the exhaustive primary research from the expert interviews. This includes telephonic interviews, focus groups, face to face interviews, and questionnaires to validate our research from all aspects. The industry experts we approach come from the leading firms, involved in the supply chain ranging from the suppliers, distributors to the manufacturers and consumers so as to ensure an unbiased analysis.
We are in touch with more than 15,000 industry experts with the right mix of consultants, CEO's, presidents, vice presidents, managers, experts from both supply side and demand side, executives and so on.
The data validation involves the primary research from the industry experts belonging to:
- Leading Companies
- Suppliers & Distributors
- Manufacturers
- Consumers
- Industry/Strategic Consultants
Apart from the data validation the primary research also helps in performing the fill gap research, i.e. providing solutions for the unmet needs of the research which helps in enhancing the reports quality.
For more details about research methodology, kindly write to us at info@strategymrc.com
Frequently Asked Questions
In case of any queries regarding this report, you can contact the customer service by filing the “Inquiry Before Buy” form available on the right hand side. You may also contact us through email: info@strategymrc.com or phone: +1-301-202-5929
Yes, the samples are available for all the published reports. You can request them by filling the “Request Sample” option available in this page.
Yes, you can request a sample with your specific requirements. All the customized samples will be provided as per the requirement with the real data masked.
All our reports are available in Digital PDF format. In case if you require them in any other formats, such as PPT, Excel etc you can submit a request through “Inquiry Before Buy” form available on the right hand side. You may also contact us through email: info@strategymrc.com or phone: +1-301-202-5929
We offer a free 15% customization with every purchase. This requirement can be fulfilled for both pre and post sale. You may send your customization requirements through email at info@strategymrc.com or call us on +1-301-202-5929.
We have 3 different licensing options available in electronic format.
- Single User Licence: Allows one person, typically the buyer, to have access to the ordered product. The ordered product cannot be distributed to anyone else.
- 2-5 User Licence: Allows the ordered product to be shared among a maximum of 5 people within your organisation.
- Corporate License: Allows the product to be shared among all employees of your organisation regardless of their geographical location.
All our reports are typically be emailed to you as an attachment.
To order any available report you need to register on our website. The payment can be made either through CCAvenue or PayPal payments gateways which accept all international cards.
We extend our support to 6 months post sale. A post sale customization is also provided to cover your unmet needs in the report.
Request Customization
We offer complimentary customization of up to 15% with every purchase. To share your customization requirements, feel free to email us at info@strategymrc.com or call us on +1-301-202-5929. .
Please Note: Customization within the 15% threshold is entirely free of charge. If your request exceeds this limit, we will conduct a feasibility assessment. Following that, a detailed quote and timeline will be provided.
WHY CHOOSE US ?

Assured Quality
Best in class reports with high standard of research integrity

24X7 Research Support
Continuous support to ensure the best customer experience.

Free Customization
Adding more values to your product of interest.

Safe & Secure Access
Providing a secured environment for all online transactions.

Trusted by 600+ Brands
Serving the most reputed brands across the world.