
Green Tires Market
Green Tires Market Forecasts to 2028 - Global Analysis By Vehicle Type (Light Commercial Vehicles (LCVS), Passenger Cars and Other Vehicle Types), Application and By Geography

|
Years Covered |
2020-2028 |
|
Estimated Year Value (2022) |
US $31.1 BN |
|
Projected Year Value (2028) |
US $60.4 BN |
|
CAGR (2022 - 2028) |
11.6% |
|
Regions Covered |
North America, Europe, Asia Pacific, South America, and Middle East & Africa |
|
Countries Covered |
US, Canada, Mexico, Germany, UK, Italy, France, Spain, Japan, China, India, Australia, New Zealand, South Korea, Rest of Asia Pacific, South America, Argentina, Brazil, Chile, Middle East & Africa, Saudi Arabia, UAE, Qatar, and South Africa |
|
Largest Market |
Asia Pacific |
|
Highest Growing Market |
Europe |
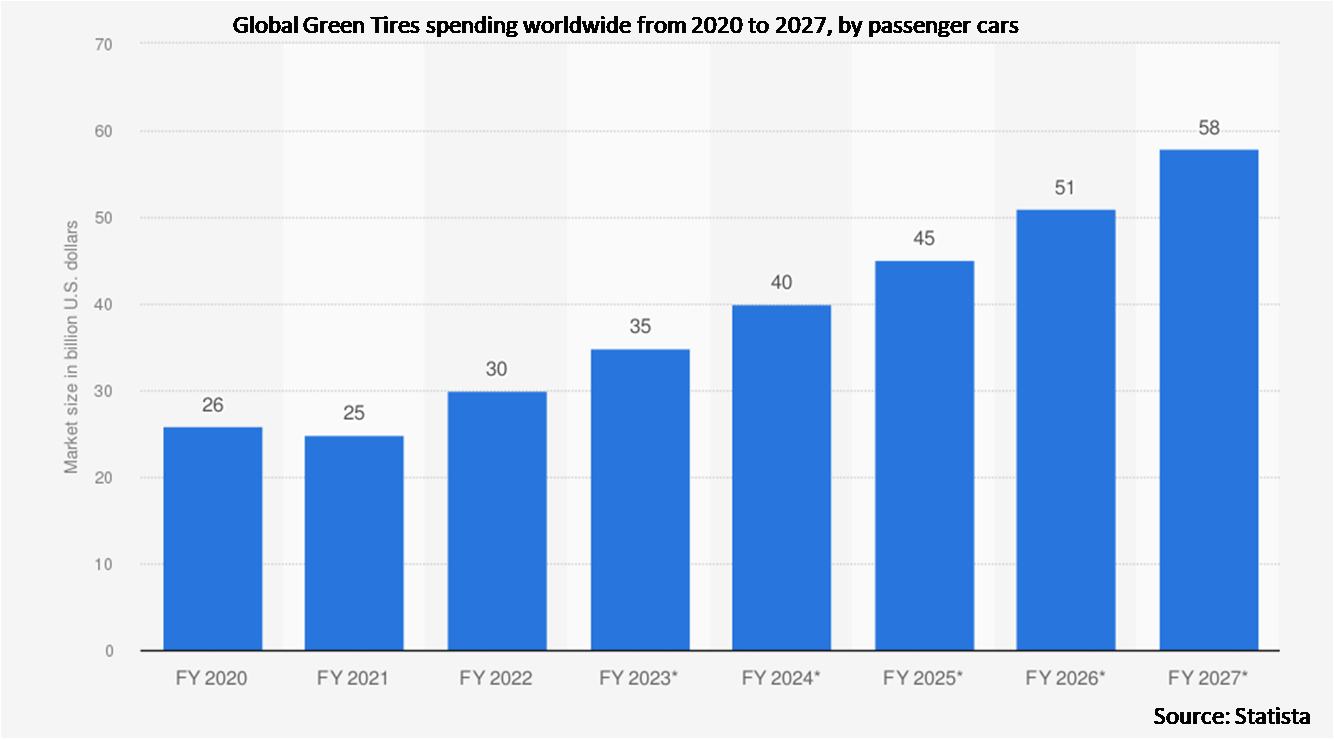
According to Stratistics MRC, the Global Green Tires Market is accounted for $31.1 billion in 2022 and is expected to reach $60.4 billion by 2028 growing at a CAGR of 11.6% during the forecast period. In order to maintain a good grip on the road, green tyres are developed with both aerodynamics and lightweight in mind. In order to retain more energy when driving and reduce rolling resistance, these tyre types also use a specific kind of firmly bonded rubber in the tread blocks. As a result, less engine power is required to rotate the tyre. Traditional tyres are made using a manufacturing technique that produces significant amounts of pollution and uses materials that are not renewable. Rubber and other petroleum-based compounds, which are added to conventional tyres, are some of these materials.
According to the China Association of Automobile Manufacturers, the country is estimated to manufacture 30 million units of passenger cars in 2020 and rise up to 35 million units by the end of 2025.
Market Dynamics:
Driver:
Less rolling resistance
Carbon emissions are significantly influenced by rolling resistance in vehicles. As rolling resistance increases, more energy is required to overcome friction, which results in more pollutants being discharged. This helps to decrease the overall weight of the vehicle type, which saves fuel. Rolling resistance causes an increase in the energy required for the tyres to make contact with the ground and deform. As a result, these elements are having an impact on market expansion.
Restraint:
Lack of awareness in emerging economies
The advantages of utilising CNG and hybrid cars are generally known to customers; however, the advantages of green tyres and their contribution to fuel economy are less well known. Consumers in emerging economies are less aware of the advantages that come with using green tyres. However, switching from renewable raw materials to conventional goods can reduce the effectiveness of brakes. This significantly inhibits the demand for green tyres.
Opportunity:
Strict government laws to reduce pollution
The increasing pace of carbon emissions from vehicles is causing serious environmental problems. As a result of their extensive usage of fossil fuels, cars are also the main source of air pollution. Even while individual cars don't produce a lot of pollutants, the world's overall number of vehicles is quite large. Many governments have imposed strict pollution rules on automakers to slow the growth of car emissions, which is fueling the market's expansion.
Threat:
Increasing costs for raw materials
Synthetic and natural resources are employed to manufacture green tyres. The pricing and availability of these materials can vary. Raw material prices have also been rising quickly. The growing price of raw materials is a significant problem for producers of green tyres. Furthermore, silica, butyl, and silane are the main raw materials used in the production and their prices have been gradually growing. This is the main element driving market expansion.
Covid-19 Impact
In addition to having a significant negative impact on people's lives, the COVID-19 pandemic has also had a significant negative impact on the global economy. However, following the shutdown, industries are progressively absorbing losses, though the pace of recovery is relatively slow. Instead of investing heavily in R&D innovation, many businesses and individuals are changing their investment strategies to make up for losses. In addition, despite the pandemic, people are not spending much on automobile purchases. The automobile and transportation industries have ultimately suffered more severe effects as a result of all these issues.
The passenger cars segment is expected to be the largest during the forecast period
The passenger cars segment is estimated to have a lucrative growth, due to the rising number of commercial vehicles and the spike in the need for freight transit. People are encouraged to adopt green tyres in passenger cars by rising CO2 awareness and laws. The sale of these cars has expanded dramatically as a result of frequent launches of passenger e-vehicles and rising individual disposable income, which is likely to fuel this segment's revenue growth.
The on-road segment is expected to have the highest CAGR during the forecast period
The on-road segment is anticipated to witness the fastest CAGR growth during the forecast period, due to the increase in their sales and production across the world. In addition, the market is being driven by factors such as rising urbanisation, higher living standards, and more consumer spending power. As a result of the high carbon emission rate and the pressing need to reduce fuel consumption, manufacturers and consumers are becoming more interested in purchasing environmentally friendly cars and car parts.
Region with Largest share:
Asia Pacific is projected to hold the largest market share during the forecast period owing to dynamic automobile industry across the region. Due to the booming demand for fuel-efficient tyres and the quick development of the automotive sector, there is a significant demand for green tyres. The region's well-established distribution network, high levels of raw material supply, and high levels of polyester production are anticipated to fuel market revenue growth.
Region with highest CAGR:
Europe is projected to have the highest CAGR over the forecast period, owing to increasing stringency in government regulations in order to reduce carbon emissions and promote environment-friendly vehicles and vehicular components. The presence of a robust healthcare system in the area, increasing investment in a sustainable transportation system, increased awareness among government agencies for the green economy, and most crucially, the use of silica in tyre treads, are all factors that have contributed to the market's rise.

Key players in the market
Some of the key players profiled in the Green Tires Market include Bridgestone, Giti Rubber, Hankook Tire Co., Ltd., Nokian Tires plc, Apollo Tires, Nexen, ZC Rubber, Goodyear Tire and Rubber Company, Continental AG, MRF, Petlas, Michelin, Yokohama Rubber Co., Ltd., Toyo Tire Corporation and Kumho Tire Company.
Key Developments:
In March 2022, ZC Rubber Group Co., Ltd. Acquired the businesses of Tianjin United Tire & Rubber International CO. and ZC Rubber is one of the largest suppliers of OTR tires globally, for rigid dump trucks, port application underground mines, and various industrial applications.
In March 2021, Kumho Tire announced the expansion of its Vietnam tire plant expecting double its manufacturing capacity. Kumho Tire is one of the largest tires manufacturers across the globe.
Vehicle Types Covered:
• Light Commercial Vehicles (LCVS)
• Passenger Cars
• Other Vehicle Types
Applications Covered:
• Off-Road
• On-Road
• Other Applications
Regions Covered:
• North America
o US
o Canada
o Mexico
• Europe
o Germany
o UK
o Italy
o France
o Spain
o Rest of Europe
• Asia Pacific
o Japan
o China
o India
o Australia
o New Zealand
o South Korea
o Rest of Asia Pacific
• South America
o Argentina
o Brazil
o Chile
o Rest of South America
• Middle East & Africa
o Saudi Arabia
o UAE
o Qatar
o South Africa
o Rest of Middle East & Africa
What our report offers:
- Market share assessments for the regional and country-level segments
- Strategic recommendations for the new entrants
- Covers Market data for the years 2020, 2021, 2022, 2025, and 2028
- Market Trends (Drivers, Constraints, Opportunities, Threats, Challenges, Investment Opportunities, and recommendations)
- Strategic recommendations in key business segments based on the market estimations
- Competitive landscaping mapping the key common trends
- Company profiling with detailed strategies, financials, and recent developments
- Supply chain trends mapping the latest technological advancements
Free Customization Offerings:
All the customers of this report will be entitled to receive one of the following free customization options:
• Company Profiling
o Comprehensive profiling of additional market players (up to 3)
o SWOT Analysis of key players (up to 3)
• Regional Segmentation
o Market estimations, Forecasts and CAGR of any prominent country as per the client's interest (Note: Depends on feasibility check)
• Competitive Benchmarking
o Benchmarking of key players based on product portfolio, geographical presence, and strategic alliances
Table of Contents
1 Executive Summary
2 Preface
2.1 Abstract
2.2 Stake Holders
2.3 Research Scope
2.4 Research Methodology
2.4.1 Data Mining
2.4.2 Data Analysis
2.4.3 Data Validation
2.4.4 Research Approach
2.5 Research Sources
2.5.1 Primary Research Sources
2.5.2 Secondary Research Sources
2.5.3 Assumptions
3 Market Trend Analysis
3.1 Introduction
3.2 Drivers
3.3 Restraints
3.4 Opportunities
3.5 Threats
3.6 Application Analysis
3.7 Emerging Markets
3.8 Impact of Covid-19
4 Porters Five Force Analysis
4.1 Bargaining power of suppliers
4.2 Bargaining power of buyers
4.3 Threat of substitutes
4.4 Threat of new entrants
4.5 Competitive rivalry
5 Global Green Tires Market, By Vehicle Type
5.1 Introduction
5.2 Light Commercial Vehicles (LCVS)
5.3 Passenger Cars
5.4 Other Vehicle Types
6 Global Green Tires Market, By Application
6.1 Introduction
6.2 Off-Road
6.3 On-Road
6.4 Other Applications
7 Global Green Tires Market, By Geography
7.1 Introduction
7.2 North America
7.2.1 US
7.2.2 Canada
7.2.3 Mexico
7.3 Europe
7.3.1 Germany
7.3.2 UK
7.3.3 Italy
7.3.4 France
7.3.5 Spain
7.3.6 Rest of Europe
7.4 Asia Pacific
7.4.1 Japan
7.4.2 China
7.4.3 India
7.4.4 Australia
7.4.5 New Zealand
7.4.6 South Korea
7.4.7 Rest of Asia Pacific
7.5 South America
7.5.1 Argentina
7.5.2 Brazil
7.5.3 Chile
7.5.4 Rest of South America
7.6 Middle East & Africa
7.6.1 Saudi Arabia
7.6.2 UAE
7.6.3 Qatar
7.6.4 South Africa
7.6.5 Rest of Middle East & Africa
8 Key Developments
8.1 Agreements, Partnerships, Collaborations and Joint Ventures
8.2 Acquisitions & Mergers
8.3 New Product Launch
8.4 Expansions
8.5 Other Key Strategies
9 Company Profiling
9.1 Bridgestone
9.2 Giti Rubber
9.3 Hankook Tire Co., Ltd.
9.4 Nokian Tires plc
9.5 Apollo Tires
9.6 Nexen
9.7 ZC Rubber
9.8 Goodyear Tire and Rubber Company
9.9 Continental AG
9.10 MRF
9.11 Petlas
9.12 Michelin
9.13 Yokohama Rubber Co., Ltd.
9.14 Toyo Tire Corporation
9.15 Kumho Tire Company
List of Tables
1 Global Green Tires Market Outlook, By Region (2020-2028) ($MN)
2 Global Green Tires Market Outlook, By Vehicle Type (2020-2028) ($MN)
3 Global Green Tires Market Outlook, By Light Commercial Vehicles (LCVS) (2020-2028) ($MN)
4 Global Green Tires Market Outlook, By Passenger Cars (2020-2028) ($MN)
5 Global Green Tires Market Outlook, By Other Vehicle Types (2020-2028) ($MN)
6 Global Green Tires Market Outlook, By Application (2020-2028) ($MN)
7 Global Green Tires Market Outlook, By Off-Road (2020-2028) ($MN)
8 Global Green Tires Market Outlook, By On-Road (2020-2028) ($MN)
9 Global Green Tires Market Outlook, By Other Applications (2020-2028) ($MN)
10 North America Green Tires Market Outlook, By Country (2020-2028) ($MN)
11 North America Green Tires Market Outlook, By Vehicle Type (2020-2028) ($MN)
12 North America Green Tires Market Outlook, By Light Commercial Vehicles (LCVS) (2020-2028) ($MN)
13 North America Green Tires Market Outlook, By Passenger Cars (2020-2028) ($MN)
14 North America Green Tires Market Outlook, By Other Vehicle Types (2020-2028) ($MN)
15 North America Green Tires Market Outlook, By Application (2020-2028) ($MN)
16 North America Green Tires Market Outlook, By Off-Road (2020-2028) ($MN)
17 North America Green Tires Market Outlook, By On-Road (2020-2028) ($MN)
18 North America Green Tires Market Outlook, By Other Applications (2020-2028) ($MN)
19 Europe Green Tires Market Outlook, By Country (2020-2028) ($MN)
20 Europe Green Tires Market Outlook, By Vehicle Type (2020-2028) ($MN)
21 Europe Green Tires Market Outlook, By Light Commercial Vehicles (LCVS) (2020-2028) ($MN)
22 Europe Green Tires Market Outlook, By Passenger Cars (2020-2028) ($MN)
23 Europe Green Tires Market Outlook, By Other Vehicle Types (2020-2028) ($MN)
24 Europe Green Tires Market Outlook, By Application (2020-2028) ($MN)
25 Europe Green Tires Market Outlook, By Off-Road (2020-2028) ($MN)
26 Europe Green Tires Market Outlook, By On-Road (2020-2028) ($MN)
27 Europe Green Tires Market Outlook, By Other Applications (2020-2028) ($MN)
28 Asia Pacific Green Tires Market Outlook, By Country (2020-2028) ($MN)
29 Asia Pacific Green Tires Market Outlook, By Vehicle Type (2020-2028) ($MN)
30 Asia Pacific Green Tires Market Outlook, By Light Commercial Vehicles (LCVS) (2020-2028) ($MN)
31 Asia Pacific Green Tires Market Outlook, By Passenger Cars (2020-2028) ($MN)
32 Asia Pacific Green Tires Market Outlook, By Other Vehicle Types (2020-2028) ($MN)
33 Asia Pacific Green Tires Market Outlook, By Application (2020-2028) ($MN)
34 Asia Pacific Green Tires Market Outlook, By Off-Road (2020-2028) ($MN)
35 Asia Pacific Green Tires Market Outlook, By On-Road (2020-2028) ($MN)
36 Asia Pacific Green Tires Market Outlook, By Other Applications (2020-2028) ($MN)
37 South America Green Tires Market Outlook, By Country (2020-2028) ($MN)
38 South America Green Tires Market Outlook, By Vehicle Type (2020-2028) ($MN)
39 South America Green Tires Market Outlook, By Light Commercial Vehicles (LCVS) (2020-2028) ($MN)
40 South America Green Tires Market Outlook, By Passenger Cars (2020-2028) ($MN)
41 South America Green Tires Market Outlook, By Other Vehicle Types (2020-2028) ($MN)
42 South America Green Tires Market Outlook, By Application (2020-2028) ($MN)
43 South America Green Tires Market Outlook, By Off-Road (2020-2028) ($MN)
44 South America Green Tires Market Outlook, By On-Road (2020-2028) ($MN)
45 South America Green Tires Market Outlook, By Other Applications (2020-2028) ($MN)
46 Middle East & Africa Green Tires Market Outlook, By Country (2020-2028) ($MN)
47 Middle East & Africa Green Tires Market Outlook, By Vehicle Type (2020-2028) ($MN)
48 Middle East & Africa Green Tires Market Outlook, By Light Commercial Vehicles (LCVS) (2020-2028) ($MN)
49 Middle East & Africa Green Tires Market Outlook, By Passenger Cars (2020-2028) ($MN)
50 Middle East & Africa Green Tires Market Outlook, By Other Vehicle Types (2020-2028) ($MN)
51 Middle East & Africa Green Tires Market Outlook, By Application (2020-2028) ($MN)
52 Middle East & Africa Green Tires Market Outlook, By Off-Road (2020-2028) ($MN)
53 Middle East & Africa Green Tires Market Outlook, By On-Road (2020-2028) ($MN)
54 Middle East & Africa Green Tires Market Outlook, By Other Applications (2020-2028) ($MN)
List of Figures
RESEARCH METHODOLOGY

We at ‘Stratistics’ opt for an extensive research approach which involves data mining, data validation, and data analysis. The various research sources include in-house repository, secondary research, competitor’s sources, social media research, client internal data, and primary research.
Our team of analysts prefers the most reliable and authenticated data sources in order to perform the comprehensive literature search. With access to most of the authenticated data bases our team highly considers the best mix of information through various sources to obtain extensive and accurate analysis.
Each report takes an average time of a month and a team of 4 industry analysts. The time may vary depending on the scope and data availability of the desired market report. The various parameters used in the market assessment are standardized in order to enhance the data accuracy.
Data Mining
The data is collected from several authenticated, reliable, paid and unpaid sources and is filtered depending on the scope & objective of the research. Our reports repository acts as an added advantage in this procedure. Data gathering from the raw material suppliers, distributors and the manufacturers is performed on a regular basis, this helps in the comprehensive understanding of the products value chain. Apart from the above mentioned sources the data is also collected from the industry consultants to ensure the objective of the study is in the right direction.
Market trends such as technological advancements, regulatory affairs, market dynamics (Drivers, Restraints, Opportunities and Challenges) are obtained from scientific journals, market related national & international associations and organizations.
Data Analysis
From the data that is collected depending on the scope & objective of the research the data is subjected for the analysis. The critical steps that we follow for the data analysis include:
- Product Lifecycle Analysis
- Competitor analysis
- Risk analysis
- Porters Analysis
- PESTEL Analysis
- SWOT Analysis
The data engineering is performed by the core industry experts considering both the Marketing Mix Modeling and the Demand Forecasting. The marketing mix modeling makes use of multiple-regression techniques to predict the optimal mix of marketing variables. Regression factor is based on a number of variables and how they relate to an outcome such as sales or profits.
Data Validation
The data validation is performed by the exhaustive primary research from the expert interviews. This includes telephonic interviews, focus groups, face to face interviews, and questionnaires to validate our research from all aspects. The industry experts we approach come from the leading firms, involved in the supply chain ranging from the suppliers, distributors to the manufacturers and consumers so as to ensure an unbiased analysis.
We are in touch with more than 15,000 industry experts with the right mix of consultants, CEO's, presidents, vice presidents, managers, experts from both supply side and demand side, executives and so on.
The data validation involves the primary research from the industry experts belonging to:
- Leading Companies
- Suppliers & Distributors
- Manufacturers
- Consumers
- Industry/Strategic Consultants
Apart from the data validation the primary research also helps in performing the fill gap research, i.e. providing solutions for the unmet needs of the research which helps in enhancing the reports quality.
For more details about research methodology, kindly write to us at info@strategymrc.com
Frequently Asked Questions
In case of any queries regarding this report, you can contact the customer service by filing the “Inquiry Before Buy” form available on the right hand side. You may also contact us through email: info@strategymrc.com or phone: +1-301-202-5929
Yes, the samples are available for all the published reports. You can request them by filling the “Request Sample” option available in this page.
Yes, you can request a sample with your specific requirements. All the customized samples will be provided as per the requirement with the real data masked.
All our reports are available in Digital PDF format. In case if you require them in any other formats, such as PPT, Excel etc you can submit a request through “Inquiry Before Buy” form available on the right hand side. You may also contact us through email: info@strategymrc.com or phone: +1-301-202-5929
We offer a free 15% customization with every purchase. This requirement can be fulfilled for both pre and post sale. You may send your customization requirements through email at info@strategymrc.com or call us on +1-301-202-5929.
We have 3 different licensing options available in electronic format.
- Single User Licence: Allows one person, typically the buyer, to have access to the ordered product. The ordered product cannot be distributed to anyone else.
- 2-5 User Licence: Allows the ordered product to be shared among a maximum of 5 people within your organisation.
- Corporate License: Allows the product to be shared among all employees of your organisation regardless of their geographical location.
All our reports are typically be emailed to you as an attachment.
To order any available report you need to register on our website. The payment can be made either through CCAvenue or PayPal payments gateways which accept all international cards.
We extend our support to 6 months post sale. A post sale customization is also provided to cover your unmet needs in the report.
Request Customization
We offer complimentary customization of up to 15% with every purchase. To share your customization requirements, feel free to email us at info@strategymrc.com or call us on +1-301-202-5929. .
Please Note: Customization within the 15% threshold is entirely free of charge. If your request exceeds this limit, we will conduct a feasibility assessment. Following that, a detailed quote and timeline will be provided.
WHY CHOOSE US ?

Assured Quality
Best in class reports with high standard of research integrity

24X7 Research Support
Continuous support to ensure the best customer experience.

Free Customization
Adding more values to your product of interest.

Safe & Secure Access
Providing a secured environment for all online transactions.

Trusted by 600+ Brands
Serving the most reputed brands across the world.