
Grid Scale Battery Market
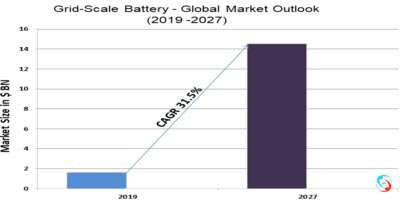
Grid-Scale Battery - Global Market Outlook (2019-2027)
According to Stratistics MRC, the Global Grid-Scale Battery Market is accounted for $1.62 billion in 2019 and is expected to reach $14.51 billion by 2027 growing at a CAGR of 31.5% during the forecast period. Some of the key factors propelling the growth of the market are growing demand for energy-efficient machinery, government regulations for enhancing energy efficiency, and technological advancements. However, the high initial cost is the restraining factor for the growth of the market.
Grid-scale battery can be defined as the electrochemical device that stores energy generated by the power plant or from the grid and delivers when needed. This technology helps power operators to store energy for future use. The incorporation of this technology in the power sector helps in achieving flexibility in the internal processes and the integration of renewable energy sources.
By type, the lithium-ion segment is expected to grow at a significant market share during the forecast period owing to its improved manufacturing capacity and decrease in price with technological advancements. Based on geography, North America is anticipated to hold considerable market share during the forecast period which is attributed to the initiatives from governments to adopt renewable sources of energy and high awareness levels among people.
Some of the key players in Grid-Scale Battery Market include Panasonic Corporation, Toshiba, General Electric (GE), ABB, Tesla, Samsung SDI Co Ltd, LG Chem Ltd, S&C Electric Company, BYD Company Limited, NGK Insulators, East Penn Manufacturing Company, Fluence Energy LLC, Contemporary Amperex Technology Co Ltd, Clarios, Saft Groupe S.A., and GS Yuasa Corporation.
Types Covered:
• Sodium Sulphur Battery
• Zinc-Hybrid Batteries
• Lithium-Ion
• Flow Battery
• Lead Acid
• Other Types
Ownership-Models Covered:
• Utility Owned
• Third-Party Owned
• Vendor Owned
• Independent Power Producers Owned
Power Generations Covered:
• Energy Capacity
• Power Capacity or Rating
Applications Covered:
• Ancillary Services
• Renewable Integration
• Frequency Regulation
• Back-Up Power
• Peak Shift
• Capacity Firming
• Load Shifting
• Bill Management
• Other Applications
Service Offerings Covered:
• Curtailment Reduction
• Investment Deferral
Regions Covered:
• North America
o US
o Canada
o Mexico
• Europe
o Germany
o France
o Italy
o UK
o Spain
o Rest of Europe
• Asia Pacific
o Japan
o China
o India
o Australia
o New Zealand
o Rest of Asia Pacific
• South America
o Argentina
o Brazil
o Chile
o Rest of South America
• Middle East & Africa
o Saudi Arabia
o UAE
o Qatar
o South Africa
o Rest of Middle East & Africa
What our report offers:
- Market share assessments for the regional and country-level segments
- Strategic recommendations for the new entrants
- Covers Market data for the years 2018, 2019, 2020, 2024 and 2027
- Market Trends (Drivers, Constraints, Opportunities, Threats, Challenges, Investment Opportunities, and recommendations)
- Strategic analysis: Drivers and Constraints, Product/Technology Analysis, Porter’s five forces analysis, SWOT analysis, etc.
- Strategic recommendations in key business segments based on the market estimations
- Competitive landscaping mapping the key common trends
- Company profiling with detailed strategies, financials, and recent developments
- Supply chain trends mapping the latest technological advancements
Free Customization Offerings:
All the customers of this report will be entitled to receive one of the following free customization options:
• Company Profiling
o Comprehensive profiling of additional market players (up to 3)
o SWOT Analysis of key players (up to 3)
• Regional Segmentation
o Market estimations, Forecasts and CAGR of any prominent country as per the client's interest (Note: Depends on feasibility check)
• Competitive Benchmarking
o Benchmarking of key players based on product portfolio, geographical presence, and strategic alliances
Table of Contents
1 Executive Summary
2 Preface
2.1 Abstract
2.2 Stake Holders
2.3 Research Scope
2.4 Research Methodology
2.4.1 Data Mining
2.4.2 Data Analysis
2.4.3 Data Validation
2.4.4 Research Approach
2.5 Research Sources
2.5.1 Primary Research Sources
2.5.2 Secondary Research Sources
2.5.3 Assumptions
3 Market Trend Analysis
3.1 Introduction
3.2 Drivers
3.3 Restraints
3.4 Opportunities
3.5 Threats
3.6 Application Analysis
3.7 Emerging Markets
3.8 Impact of Covid-19
4 Porters Five Force Analysis
4.1 Bargaining power of suppliers
4.2 Bargaining power of buyers
4.3 Threat of substitutes
4.4 Threat of new entrants
4.5 Competitive rivalry
5 Global Grid-Scale Battery Market, By Type
5.1 Introduction
5.2 Sodium Sulphur Battery
5.3 Zinc-Hybrid Batteries
5.4 Lithium-Ion
5.5 Flow Battery
5.6 Lead Acid
5.7 Other Types
5.7.1 Nickel–Iron Battery
5.7.2 Nickel–Cadmium Battery
5.7.3 Nickel Metal Hydride Battery
6 Global Grid-Scale Battery Market, By Ownership-Model
6.1 Introduction
6.2 Utility Owned
6.3 Third-Party Owned
6.4 Vendor Owned
6.5 Independent Power Producers Owned
7 Global Grid-Scale Battery Market, By Power Generation
7.1 Introduction
7.2 Energy Capacity
7.3 Power Capacity or Rating
8 Global Grid-Scale Battery Market, By Application
8.1 Introduction
8.2 Ancillary Services
8.3 Renewable Integration
8.4 Frequency Regulation
8.5 Back-Up Power
8.6 Peak Shift
8.7 Capacity Firming
8.8 Load Shifting
8.9 Bill Management
8.10 Other Applications
8.10.1 Ramping
8.10.2 Black Start
8.10.3 Transmission and Distribution Services
8.10.4 Microgrids
9 Global Grid-Scale Battery Market, By Service Offering
9.1 Introduction
9.2 Curtailment Reduction
9.3 Investment Deferral
10 Global Grid-Scale Battery Market, By Geography
10.1 Introduction
10.2 North America
10.2.1 US
10.2.2 Canada
10.2.3 Mexico
10.3 Europe
10.3.1 Germany
10.3.2 UK
10.3.3 Italy
10.3.4 France
10.3.5 Spain
10.3.6 Rest of Europe
10.4 Asia Pacific
10.4.1 Japan
10.4.2 China
10.4.3 India
10.4.4 Australia
10.4.5 New Zealand
10.4.6 South Korea
10.4.7 Rest of Asia Pacific
10.5 South America
10.5.1 Argentina
10.5.2 Brazil
10.5.3 Chile
10.5.4 Rest of South America
10.6 Middle East & Africa
10.6.1 Saudi Arabia
10.6.2 UAE
10.6.3 Qatar
10.6.4 South Africa
10.6.5 Rest of Middle East & Africa
11 Key Developments
11.1 Agreements, Partnerships, Collaborations and Joint Ventures
11.2 Acquisitions & Mergers
11.3 New Product Launch
11.4 Expansions
11.5 Other Key Strategies
12 Company Profiling
12.1 Panasonic Corporation
12.2 Toshiba
12.3 General Electric (GE)
12.4 ABB
12.5 Tesla
12.6 Samsung SDI Co Ltd
12.7 LG Chem Ltd
12.8 S&C Electric Company
12.9 BYD Company Limited
12.10 NGK Insulators
12.11 East Penn Manufacturing Company
12.12 Fluence Energy LLC
12.13 Contemporary Amperex Technology Co Ltd
12.14 Clarios
12.15 Saft Groupe S.A.
12.16 GS Yuasa Corporation
List of Tables
1 Global Grid-Scale Battery Market Outlook, By Region (2018-2027) ($MN)
2 Global Grid-Scale Battery Market Outlook, By Type (2018-2027) ($MN)
3 Global Grid-Scale Battery Market Outlook, By Sodium Based (2018-2027) ($MN)
4 Global Grid-Scale Battery Market Outlook, By Zinc-Hybrid Batteries (2018-2027) ($MN)
5 Global Grid-Scale Battery Market Outlook, By Lithium-Ion (2018-2027) ($MN)
6 Global Grid-Scale Battery Market Outlook, By Flow Battery (2018-2027) ($MN)
7 Global Grid-Scale Battery Market Outlook, By Lead Acid (2018-2027) ($MN)
8 Global Grid-Scale Battery Market Outlook, By Other Types (2018-2027) ($MN)
9 Global Grid-Scale Battery Market Outlook, By Nickel–Iron Battery (2018-2027) ($MN)
10 Global Grid-Scale Battery Market Outlook, By Nickel–Cadmium Battery (2018-2027) ($MN)
11 Global Grid-Scale Battery Market Outlook, By Nickel Metal Hydride Battery (2018-2027) ($MN)
12 Global Grid-Scale Battery Market Outlook, By Ownership-Model (2018-2027) ($MN)
13 Global Grid-Scale Battery Market Outlook, By Utility Owned (2018-2027) ($MN)
14 Global Grid-Scale Battery Market Outlook, By Third-Party Owned (2018-2027) ($MN)
15 Global Grid-Scale Battery Market Outlook, By Vendor Owned (2018-2027) ($MN)
16 Global Grid-Scale Battery Market Outlook, By Independent Power Producers Owned (2018-2027) ($MN)
17 Global Grid-Scale Battery Market Outlook, By Power Generation (2018-2027) ($MN)
18 Global Grid-Scale Battery Market Outlook, By Energy Capacity (2018-2027) ($MN)
19 Global Grid-Scale Battery Market Outlook, By Power Capacity or Rating (2018-2027) ($MN)
20 Global Grid-Scale Battery Market Outlook, By Application (2018-2027) ($MN)
21 Global Grid-Scale Battery Market Outlook, By Ancillary Services (2018-2027) ($MN)
22 Global Grid-Scale Battery Market Outlook, By Renewable Integration (2018-2027) ($MN)
23 Global Grid-Scale Battery Market Outlook, By Frequency Regulation (2018-2027) ($MN)
24 Global Grid-Scale Battery Market Outlook, By Back-Up Power (2018-2027) ($MN)
25 Global Grid-Scale Battery Market Outlook, By Peak Shift (2018-2027) ($MN)
26 Global Grid-Scale Battery Market Outlook, By Capacity Firming (2018-2027) ($MN)
27 Global Grid-Scale Battery Market Outlook, By Load Shifting (2018-2027) ($MN)
28 Global Grid-Scale Battery Market Outlook, By Bill Management (2018-2027) ($MN)
29 Global Grid-Scale Battery Market Outlook, By Other Applications (2018-2027) ($MN)
30 Global Grid-Scale Battery Market Outlook, By Ramping (2018-2027) ($MN)
31 Global Grid-Scale Battery Market Outlook, By Black Start (2018-2027) ($MN)
32 Global Grid-Scale Battery Market Outlook, By Transmission and Distribution Services (2018-2027) ($MN)
33 Global Grid-Scale Battery Market Outlook, By Microgrids (2018-2027) ($MN)
34 Global Grid-Scale Battery Market Outlook, By Service Offering (2018-2027) ($MN)
35 Global Grid-Scale Battery Market Outlook, By Curtailment Reduction (2018-2027) ($MN)
36 Global Grid-Scale Battery Market Outlook, By Investment Deferral (2018-2027) ($MN)
Note: Tables for North America, Europe, APAC, South America, and Middle East & Africa Regions are also represented in the same manner as above.
List of Figures
RESEARCH METHODOLOGY

We at ‘Stratistics’ opt for an extensive research approach which involves data mining, data validation, and data analysis. The various research sources include in-house repository, secondary research, competitor’s sources, social media research, client internal data, and primary research.
Our team of analysts prefers the most reliable and authenticated data sources in order to perform the comprehensive literature search. With access to most of the authenticated data bases our team highly considers the best mix of information through various sources to obtain extensive and accurate analysis.
Each report takes an average time of a month and a team of 4 industry analysts. The time may vary depending on the scope and data availability of the desired market report. The various parameters used in the market assessment are standardized in order to enhance the data accuracy.
Data Mining
The data is collected from several authenticated, reliable, paid and unpaid sources and is filtered depending on the scope & objective of the research. Our reports repository acts as an added advantage in this procedure. Data gathering from the raw material suppliers, distributors and the manufacturers is performed on a regular basis, this helps in the comprehensive understanding of the products value chain. Apart from the above mentioned sources the data is also collected from the industry consultants to ensure the objective of the study is in the right direction.
Market trends such as technological advancements, regulatory affairs, market dynamics (Drivers, Restraints, Opportunities and Challenges) are obtained from scientific journals, market related national & international associations and organizations.
Data Analysis
From the data that is collected depending on the scope & objective of the research the data is subjected for the analysis. The critical steps that we follow for the data analysis include:
- Product Lifecycle Analysis
- Competitor analysis
- Risk analysis
- Porters Analysis
- PESTEL Analysis
- SWOT Analysis
The data engineering is performed by the core industry experts considering both the Marketing Mix Modeling and the Demand Forecasting. The marketing mix modeling makes use of multiple-regression techniques to predict the optimal mix of marketing variables. Regression factor is based on a number of variables and how they relate to an outcome such as sales or profits.
Data Validation
The data validation is performed by the exhaustive primary research from the expert interviews. This includes telephonic interviews, focus groups, face to face interviews, and questionnaires to validate our research from all aspects. The industry experts we approach come from the leading firms, involved in the supply chain ranging from the suppliers, distributors to the manufacturers and consumers so as to ensure an unbiased analysis.
We are in touch with more than 15,000 industry experts with the right mix of consultants, CEO's, presidents, vice presidents, managers, experts from both supply side and demand side, executives and so on.
The data validation involves the primary research from the industry experts belonging to:
- Leading Companies
- Suppliers & Distributors
- Manufacturers
- Consumers
- Industry/Strategic Consultants
Apart from the data validation the primary research also helps in performing the fill gap research, i.e. providing solutions for the unmet needs of the research which helps in enhancing the reports quality.
For more details about research methodology, kindly write to us at info@strategymrc.com
Frequently Asked Questions
In case of any queries regarding this report, you can contact the customer service by filing the “Inquiry Before Buy” form available on the right hand side. You may also contact us through email: info@strategymrc.com or phone: +1-301-202-5929
Yes, the samples are available for all the published reports. You can request them by filling the “Request Sample” option available in this page.
Yes, you can request a sample with your specific requirements. All the customized samples will be provided as per the requirement with the real data masked.
All our reports are available in Digital PDF format. In case if you require them in any other formats, such as PPT, Excel etc you can submit a request through “Inquiry Before Buy” form available on the right hand side. You may also contact us through email: info@strategymrc.com or phone: +1-301-202-5929
We offer a free 15% customization with every purchase. This requirement can be fulfilled for both pre and post sale. You may send your customization requirements through email at info@strategymrc.com or call us on +1-301-202-5929.
We have 3 different licensing options available in electronic format.
- Single User Licence: Allows one person, typically the buyer, to have access to the ordered product. The ordered product cannot be distributed to anyone else.
- 2-5 User Licence: Allows the ordered product to be shared among a maximum of 5 people within your organisation.
- Corporate License: Allows the product to be shared among all employees of your organisation regardless of their geographical location.
All our reports are typically be emailed to you as an attachment.
To order any available report you need to register on our website. The payment can be made either through CCAvenue or PayPal payments gateways which accept all international cards.
We extend our support to 6 months post sale. A post sale customization is also provided to cover your unmet needs in the report.
Request Customization
We offer complimentary customization of up to 15% with every purchase. To share your customization requirements, feel free to email us at info@strategymrc.com or call us on +1-301-202-5929. .
Please Note: Customization within the 15% threshold is entirely free of charge. If your request exceeds this limit, we will conduct a feasibility assessment. Following that, a detailed quote and timeline will be provided.
WHY CHOOSE US ?

Assured Quality
Best in class reports with high standard of research integrity

24X7 Research Support
Continuous support to ensure the best customer experience.

Free Customization
Adding more values to your product of interest.

Safe & Secure Access
Providing a secured environment for all online transactions.

Trusted by 600+ Brands
Serving the most reputed brands across the world.