
Hydraulic Fracturing Market
Hydraulic Fracturing Market Forecasts to 2030 - Global Analysis By Type (Commissary/Shared Kitchen, Kitchen Pods and Other Types), Nature (Franchised and Standalone), Technology, Application and By Geography

|
Years Covered |
2021-2030 |
|
Estimated Year Value (2023) |
US $52.5 BN |
|
Projected Year Value (2030) |
US $99.10 BN |
|
CAGR (2023 - 2030) |
9.5% |
|
Regions Covered |
North America, Europe, Asia Pacific, South America, and Middle East & Africa |
|
Countries Covered |
US, Canada, Mexico, Germany, UK, Italy, France, Spain, Japan, China, India, Australia, New Zealand, South Korea, Rest of Asia Pacific, South America, Argentina, Brazil, Chile, Middle East & Africa, Saudi Arabia, UAE, Qatar, and South Africa |
|
Largest Market |
North America |
|
Highest Growing Market |
Asia Pacific |
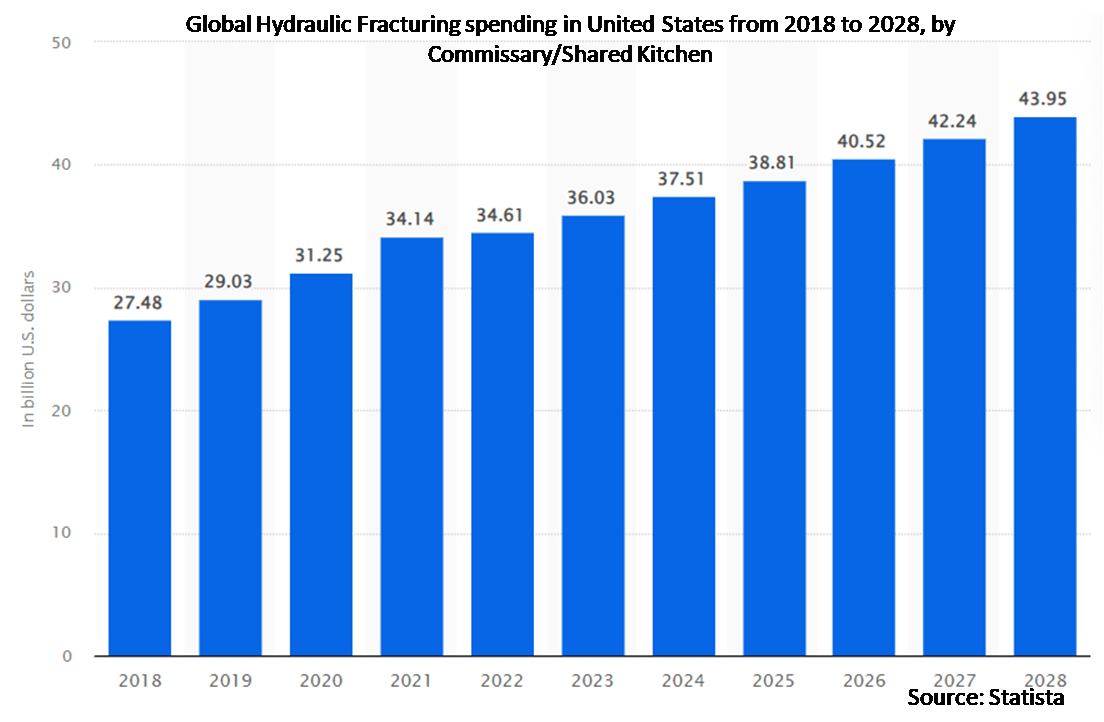
According to Stratistics MRC, the Global Hydraulic Fracturing Market is accounted for $52.5 billion in 2023 and is expected to reach $99.10 billion by 2030 growing at a CAGR of 9.5% during the forecast period. Hydraulic fracturing, commonly known as fracking, is a technique used to extract natural gas and oil from deep underground rock formations such as shale. It involves injecting a mixture of water, sand, and chemicals at high pressure into the rock, creating fractures that release the trapped hydrocarbons. These fractures allow the oil or gas to flow more freely to the surface for collection. While fracking has significantly increased energy production, it is also controversial due to its potential environmental impacts, including water contamination and seismic activity.
According to the US Energy Information Administration (EIA), shale oil production in the United States output would increase by 27% in 2050. According to the Alberta Energy Regulator, total crude oil production in Alberta is forecast to be around 4.2 million barrels per day in 2025.
Market Dynamics:
Driver:
Energy Demand
The energy demand driver of the hydraulic fracturing market stems from the increasing global need for energy resources, particularly natural gas and oil. As traditional reserves decline and energy consumption continues to rise, hydraulic fracturing offers access to previously inaccessible shale gas and tight oil reserves. This method enables the extraction of vast amounts of energy resources, thereby helping meet the growing energy demand worldwide. Additionally, advancements in hydraulic fracturing technology have made extraction more efficient and cost-effective, further driving its adoption.
Restraint:
Community opposition
Community opposition can significantly restrain the hydraulic fracturing market due to environmental concerns and perceived threats to public health. Local communities often express fears about water contamination, air pollution, and seismic activity associated with fracking operations. Protests, legal challenges, and regulatory hurdles can arise, delaying or preventing fracking projects from proceeding. Moreover, negative publicity and social stigma can deter investors and companies from entering areas where community resistance is strong.
Opportunity:
Water management solutions
With fracking requiring large volumes of water for the extraction of oil and gas from shale formations, the effective management of water resources is crucial. Companies offering innovative water treatment, recycling, and disposal technologies stand to benefit. These solutions not only address environmental concerns surrounding water usage and contamination but also enhance operational efficiency and cost-effectiveness for fracking operators. Moreover, as regulations tighten and public scrutiny increases, the demand for sustainable water management practices in fracking is likely to grow, presenting a lucrative niche for solution providers.
Threat:
Water scarcity
Hydraulic fracturing, or fracking, poses a significant threat to water scarcity due to its high water consumption and potential for contamination. The process requires millions of gallons of water mixed with chemicals and sand, exacerbating stress on already limited water resources. Moreover, fracking can contaminate groundwater through leaks or spills, further reducing the availability of clean water. As fracking operations expand globally, particularly in arid regions, the strain on water supplies intensifies, heightening concerns about water scarcity. Sustainable management of water resources is crucial to mitigate the adverse effects of hydraulic fracturing on water availability and ensure environmental sustainability.
Covid-19 Impact:
The COVID-19 pandemic has had a significant impact on the hydraulic fracturing market. The decline in global oil prices due to decreased demand during lockdowns led to reduced investment in fracking operations. Many fracking projects were put on hold or cancelled altogether, causing a downturn in the market. Additionally, restrictions on movement and supply chain disruptions hindered fracking activities, further exacerbating the market's challenges. Despite some recovery as restrictions eased, uncertainties persist, with ongoing fluctuations in demand and regulatory scrutiny affecting the future trajectory of the fracking market.
The fluid type segment is expected to be the largest during the forecast period
The Fluid Type segment in the hydraulic fracturing market has experienced notable growth due to advancements in technologies, which have led to the development of more efficient and effective fluids tailored to specific geological conditions, enhancing overall fracturing operations. Environmental concerns have prompted the adoption of eco-friendly and water-based fluids, driving demand within this segment. Additionally, the increasing complexity of unconventional reservoirs requires specialized fluid formulations to optimize production rates, further boosting the segment.
The tight oil segment is expected to have the highest CAGR during the forecast period
The growth in the tight oil segment can be attributed to increasing number of inaccessible oil reserves trapped in tight rock formations, particularly in shale plays. This has led to increased exploration and production activities in regions rich in tight oil resources. Moreover, the economics of tight oil extraction have improved with innovations in hydraulic fracturing techniques, making it more cost-effective compared to conventional methods. Additionally, the flexibility of tight oil operations allows for a quicker response to market demand fluctuations, enhancing its attractiveness to investors and operators. Furthermore, tight oil's contribution to energy security and its potential to reduce dependence on imported oil have spurred government support and investment incentives, further driving its growth in the hydraulic fracturing market.
Region with largest share:
The growth of hydraulic fracturing in North America has been driven by abundant shale gas and tight oil resources making the region a focal point for fracking operations. Technological advancements in horizontal drilling and fracking techniques have significantly lowered costs and increased efficiency, making extraction more economically viable. Regulatory frameworks, particularly in the United States, have generally been more favorable compared to other regions, providing a conducive environment for industry expansion.
Region with highest CAGR:
The Asia-Pacific region has witnessed significant growth due to rapid industrialization, a burgeoning population, and increasing energy demand are driving exploration and production activities in unconventional oil and gas reservoirs. Technological advancements have made hydraulic fracturing more accessible and cost-effective, attracting investments from both domestic and international players. Additionally, favorable government policies aimed at promoting energy security and reducing dependency on imports have further propelled market growth. The region's vast shale gas reserves, particularly in countries like China and Australia, offer lucrative opportunities for hydraulic fracturing companies.

Key players in the market
Some of the key players in Hydraulic Fracturing market include Archer Well Company Inc., Baker Hughes a GE Co., Basic Energy Services, Calfrac Well Services Ltd, Cudd Energy Services, FTS International Services, Halliburton Company, Liberty Oilfield Services, NexTier Oilfield Solutions Inc., Patterson, ProPetro Holding Corp., Schlumberger Limited, Superior Energy Services, Trican Well Services and Weatherford.
Key Developments:
In April 2024, Schlumberger and ChampionX Corporation announced a definitive agreement for SLB to purchase ChampionX in an all-stock transaction. The agreement was unanimously approved by the ChampionX board of directors. Under the terms of the agreement, ChampionX shareholders will receive 0.735 shares of SLB common stock in exchange for each ChampionX share.
In November 2023, Halliburton Company and Sekal AS have announced an agreement to jointly provide leading well construction automation solutions as part of a longer-term strategy to deliver fully automated drilling operations. Under the agreement, Halliburton and Sekal are collaborating on several technologies and services that incorporate Halliburton digitally integrated well construction solutions and the Sekal DrillTronics automation platform. In addition, both parties’ remote operations centers will provide expertise and support to these offerings.
Types Covered:
• Commissary/Shared Kitchen
• Kitchen Pods
• Independent
• Well Type
• Fluid Type
• Other Types
Natures Covered:
• Franchised
• Standalone
Technologies Covered:
• Sliding Slee
• Plug & Perf
Applications Covered:
• Tight Oil
• Tight Gas
• Shale Gas
Regions Covered:
• North America
o US
o Canada
o Mexico
• Europe
o Germany
o UK
o Italy
o France
o Spain
o Rest of Europe
• Asia Pacific
o Japan
o China
o India
o Australia
o New Zealand
o South Korea
o Rest of Asia Pacific
• South America
o Argentina
o Brazil
o Chile
o Rest of South America
• Middle East & Africa
o Saudi Arabia
o UAE
o Qatar
o South Africa
o Rest of Middle East & Africa
What our report offers:
- Market share assessments for the regional and country-level segments
- Strategic recommendations for the new entrants
- Covers Market data for the years 2021, 2022, 2023, 2026, and 2030
- Market Trends (Drivers, Constraints, Opportunities, Threats, Challenges, Investment Opportunities, and recommendations)
- Strategic recommendations in key business segments based on the market estimations
- Competitive landscaping mapping the key common trends
- Company profiling with detailed strategies, financials, and recent developments
- Supply chain trends mapping the latest technological advancements
Free Customization Offerings:
All the customers of this report will be entitled to receive one of the following free customization options:
• Company Profiling
o Comprehensive profiling of additional market players (up to 3)
o SWOT Analysis of key players (up to 3)
• Regional Segmentation
o Market estimations, Forecasts and CAGR of any prominent country as per the client's interest (Note: Depends on feasibility check)
• Competitive Benchmarking
Benchmarking of key players based on product portfolio, geographical presence, and strategic alliances
Table of Contents
1 Executive Summary
2 Preface
2.1 Abstract
2.2 Stake Holders
2.3 Research Scope
2.4 Research Methodology
2.4.1 Data Mining
2.4.2 Data Analysis
2.4.3 Data Validation
2.4.4 Research Approach
2.5 Research Sources
2.5.1 Primary Research Sources
2.5.2 Secondary Research Sources
2.5.3 Assumptions
3 Market Trend Analysis
3.1 Introduction
3.2 Drivers
3.3 Restraints
3.4 Opportunities
3.5 Threats
3.6 Technology Analysis
3.7 End User Analysis
3.8 Emerging Markets
3.9 Impact of Covid-19
4 Porters Five Force Analysis
4.1 Bargaining power of suppliers
4.2 Bargaining power of buyers
4.3 Threat of substitutes
4.4 Threat of new entrants
4.5 Competitive rivalry
5 Global Hydraulic Fracturing Market, By Type
5.1 Introduction
5.2 Commissary/Shared Kitchen
5.3 Kitchen Pods
5.4 Independent
5.5 Well Type
5.5.1 Vertical
5.5.2 Horizontal
5.6 Fluid Type
5.6.1 Gelled Oil-based Fluid
5.6.2 Foam-based Fluid
5.6.3 Slick Water-based Fluid
5.6.4 Other Fluid Types
5.7 Other Types
6 Global Hydraulic Fracturing Market, By Nature
6.1 Introduction
6.2 Franchised
6.3 Standalone
7 Global Hydraulic Fracturing Market, By Technology
7.1 Introduction
7.2 Sliding Slee
7.3 Plug & Perf
8 Global Hydraulic Fracturing Market, By Application
8.1 Introduction
8.2 Tight Oil
8.3 Tight Gas
8.4 Shale Gas
9 Global Hydraulic Fracturing Market, By Geography
9.1 Introduction
9.2 North America
9.2.1 US
9.2.2 Canada
9.2.3 Mexico
9.3 Europe
9.3.1 Germany
9.3.2 UK
9.3.3 Italy
9.3.4 France
9.3.5 Spain
9.3.6 Rest of Europe
9.4 Asia Pacific
9.4.1 Japan
9.4.2 China
9.4.3 India
9.4.4 Australia
9.4.5 New Zealand
9.4.6 South Korea
9.4.7 Rest of Asia Pacific
9.5 South America
9.5.1 Argentina
9.5.2 Brazil
9.5.3 Chile
9.5.4 Rest of South America
9.6 Middle East & Africa
9.6.1 Saudi Arabia
9.6.2 UAE
9.6.3 Qatar
9.6.4 South Africa
9.6.5 Rest of Middle East & Africa
10 Key Developments
10.1 Agreements, Partnerships, Collaborations and Joint Ventures
10.2 Acquisitions & Mergers
10.3 New Product Launch
10.4 Expansions
10.5 Other Key Strategies
11 Company Profiling
11.1 Archer Well Company Inc.
11.2 Baker Hughes a GE Co.
11.3 Basic Energy Services
11.4 Calfrac Well Services Ltd
11.5 Cudd Energy Services
11.6 FTS International Services
11.7 Halliburton Company
11.8 Liberty Oilfield Services
11.9 NexTier Oilfield Solutions Inc.
11.10 Patterson
11.11 ProPetro Holding Corp.
11.12 Schlumberger Limited
11.13 Superior Energy Services
11.14 Trican Well Services
11.15 Weatherford
List of Tables
1 Global Hydraulic Fracturing Market Outlook, By Region (2021-2030) ($MN)
2 Global Hydraulic Fracturing Market Outlook, By Type (2021-2030) ($MN)
3 Global Hydraulic Fracturing Market Outlook, By Commissary/Shared Kitchen (2021-2030) ($MN)
4 Global Hydraulic Fracturing Market Outlook, By Kitchen Pods (2021-2030) ($MN)
5 Global Hydraulic Fracturing Market Outlook, By Independent (2021-2030) ($MN)
6 Global Hydraulic Fracturing Market Outlook, By Well Type (2021-2030) ($MN)
7 Global Hydraulic Fracturing Market Outlook, By Vertical (2021-2030) ($MN)
8 Global Hydraulic Fracturing Market Outlook, By Horizontal (2021-2030) ($MN)
9 Global Hydraulic Fracturing Market Outlook, By Fluid Type (2021-2030) ($MN)
10 Global Hydraulic Fracturing Market Outlook, By Gelled Oil-based Fluid (2021-2030) ($MN)
11 Global Hydraulic Fracturing Market Outlook, By Foam-based Fluid (2021-2030) ($MN)
12 Global Hydraulic Fracturing Market Outlook, By Slick Water-based Fluid (2021-2030) ($MN)
13 Global Hydraulic Fracturing Market Outlook, By Other Fluid Types (2021-2030) ($MN)
14 Global Hydraulic Fracturing Market Outlook, By Other Types (2021-2030) ($MN)
15 Global Hydraulic Fracturing Market Outlook, By Nature (2021-2030) ($MN)
16 Global Hydraulic Fracturing Market Outlook, By Franchised (2021-2030) ($MN)
17 Global Hydraulic Fracturing Market Outlook, By Standalone (2021-2030) ($MN)
18 Global Hydraulic Fracturing Market Outlook, By Technology (2021-2030) ($MN)
19 Global Hydraulic Fracturing Market Outlook, By Sliding Slee (2021-2030) ($MN)
20 Global Hydraulic Fracturing Market Outlook, By Plug & Perf (2021-2030) ($MN)
21 Global Hydraulic Fracturing Market Outlook, By Application (2021-2030) ($MN)
22 Global Hydraulic Fracturing Market Outlook, By Tight Oil (2021-2030) ($MN)
23 Global Hydraulic Fracturing Market Outlook, By Tight Gas (2021-2030) ($MN)
24 Global Hydraulic Fracturing Market Outlook, By Shale Gas (2021-2030) ($MN)
25 North America Hydraulic Fracturing Market Outlook, By Country (2021-2030) ($MN)
26 North America Hydraulic Fracturing Market Outlook, By Type (2021-2030) ($MN)
27 North America Hydraulic Fracturing Market Outlook, By Commissary/Shared Kitchen (2021-2030) ($MN)
28 North America Hydraulic Fracturing Market Outlook, By Kitchen Pods (2021-2030) ($MN)
29 North America Hydraulic Fracturing Market Outlook, By Independent (2021-2030) ($MN)
30 North America Hydraulic Fracturing Market Outlook, By Well Type (2021-2030) ($MN)
31 North America Hydraulic Fracturing Market Outlook, By Vertical (2021-2030) ($MN)
32 North America Hydraulic Fracturing Market Outlook, By Horizontal (2021-2030) ($MN)
33 North America Hydraulic Fracturing Market Outlook, By Fluid Type (2021-2030) ($MN)
34 North America Hydraulic Fracturing Market Outlook, By Gelled Oil-based Fluid (2021-2030) ($MN)
35 North America Hydraulic Fracturing Market Outlook, By Foam-based Fluid (2021-2030) ($MN)
36 North America Hydraulic Fracturing Market Outlook, By Slick Water-based Fluid (2021-2030) ($MN)
37 North America Hydraulic Fracturing Market Outlook, By Other Fluid Types (2021-2030) ($MN)
38 North America Hydraulic Fracturing Market Outlook, By Other Types (2021-2030) ($MN)
39 North America Hydraulic Fracturing Market Outlook, By Nature (2021-2030) ($MN)
40 North America Hydraulic Fracturing Market Outlook, By Franchised (2021-2030) ($MN)
41 North America Hydraulic Fracturing Market Outlook, By Standalone (2021-2030) ($MN)
42 North America Hydraulic Fracturing Market Outlook, By Technology (2021-2030) ($MN)
43 North America Hydraulic Fracturing Market Outlook, By Sliding Slee (2021-2030) ($MN)
44 North America Hydraulic Fracturing Market Outlook, By Plug & Perf (2021-2030) ($MN)
45 North America Hydraulic Fracturing Market Outlook, By Application (2021-2030) ($MN)
46 North America Hydraulic Fracturing Market Outlook, By Tight Oil (2021-2030) ($MN)
47 North America Hydraulic Fracturing Market Outlook, By Tight Gas (2021-2030) ($MN)
48 North America Hydraulic Fracturing Market Outlook, By Shale Gas (2021-2030) ($MN)
49 Europe Hydraulic Fracturing Market Outlook, By Country (2021-2030) ($MN)
50 Europe Hydraulic Fracturing Market Outlook, By Type (2021-2030) ($MN)
51 Europe Hydraulic Fracturing Market Outlook, By Commissary/Shared Kitchen (2021-2030) ($MN)
52 Europe Hydraulic Fracturing Market Outlook, By Kitchen Pods (2021-2030) ($MN)
53 Europe Hydraulic Fracturing Market Outlook, By Independent (2021-2030) ($MN)
54 Europe Hydraulic Fracturing Market Outlook, By Well Type (2021-2030) ($MN)
55 Europe Hydraulic Fracturing Market Outlook, By Vertical (2021-2030) ($MN)
56 Europe Hydraulic Fracturing Market Outlook, By Horizontal (2021-2030) ($MN)
57 Europe Hydraulic Fracturing Market Outlook, By Fluid Type (2021-2030) ($MN)
58 Europe Hydraulic Fracturing Market Outlook, By Gelled Oil-based Fluid (2021-2030) ($MN)
59 Europe Hydraulic Fracturing Market Outlook, By Foam-based Fluid (2021-2030) ($MN)
60 Europe Hydraulic Fracturing Market Outlook, By Slick Water-based Fluid (2021-2030) ($MN)
61 Europe Hydraulic Fracturing Market Outlook, By Other Fluid Types (2021-2030) ($MN)
62 Europe Hydraulic Fracturing Market Outlook, By Other Types (2021-2030) ($MN)
63 Europe Hydraulic Fracturing Market Outlook, By Nature (2021-2030) ($MN)
64 Europe Hydraulic Fracturing Market Outlook, By Franchised (2021-2030) ($MN)
65 Europe Hydraulic Fracturing Market Outlook, By Standalone (2021-2030) ($MN)
66 Europe Hydraulic Fracturing Market Outlook, By Technology (2021-2030) ($MN)
67 Europe Hydraulic Fracturing Market Outlook, By Sliding Slee (2021-2030) ($MN)
68 Europe Hydraulic Fracturing Market Outlook, By Plug & Perf (2021-2030) ($MN)
69 Europe Hydraulic Fracturing Market Outlook, By Application (2021-2030) ($MN)
70 Europe Hydraulic Fracturing Market Outlook, By Tight Oil (2021-2030) ($MN)
71 Europe Hydraulic Fracturing Market Outlook, By Tight Gas (2021-2030) ($MN)
72 Europe Hydraulic Fracturing Market Outlook, By Shale Gas (2021-2030) ($MN)
73 Asia Pacific Hydraulic Fracturing Market Outlook, By Country (2021-2030) ($MN)
74 Asia Pacific Hydraulic Fracturing Market Outlook, By Type (2021-2030) ($MN)
75 Asia Pacific Hydraulic Fracturing Market Outlook, By Commissary/Shared Kitchen (2021-2030) ($MN)
76 Asia Pacific Hydraulic Fracturing Market Outlook, By Kitchen Pods (2021-2030) ($MN)
77 Asia Pacific Hydraulic Fracturing Market Outlook, By Independent (2021-2030) ($MN)
78 Asia Pacific Hydraulic Fracturing Market Outlook, By Well Type (2021-2030) ($MN)
79 Asia Pacific Hydraulic Fracturing Market Outlook, By Vertical (2021-2030) ($MN)
80 Asia Pacific Hydraulic Fracturing Market Outlook, By Horizontal (2021-2030) ($MN)
81 Asia Pacific Hydraulic Fracturing Market Outlook, By Fluid Type (2021-2030) ($MN)
82 Asia Pacific Hydraulic Fracturing Market Outlook, By Gelled Oil-based Fluid (2021-2030) ($MN)
83 Asia Pacific Hydraulic Fracturing Market Outlook, By Foam-based Fluid (2021-2030) ($MN)
84 Asia Pacific Hydraulic Fracturing Market Outlook, By Slick Water-based Fluid (2021-2030) ($MN)
85 Asia Pacific Hydraulic Fracturing Market Outlook, By Other Fluid Types (2021-2030) ($MN)
86 Asia Pacific Hydraulic Fracturing Market Outlook, By Other Types (2021-2030) ($MN)
87 Asia Pacific Hydraulic Fracturing Market Outlook, By Nature (2021-2030) ($MN)
88 Asia Pacific Hydraulic Fracturing Market Outlook, By Franchised (2021-2030) ($MN)
89 Asia Pacific Hydraulic Fracturing Market Outlook, By Standalone (2021-2030) ($MN)
90 Asia Pacific Hydraulic Fracturing Market Outlook, By Technology (2021-2030) ($MN)
91 Asia Pacific Hydraulic Fracturing Market Outlook, By Sliding Slee (2021-2030) ($MN)
92 Asia Pacific Hydraulic Fracturing Market Outlook, By Plug & Perf (2021-2030) ($MN)
93 Asia Pacific Hydraulic Fracturing Market Outlook, By Application (2021-2030) ($MN)
94 Asia Pacific Hydraulic Fracturing Market Outlook, By Tight Oil (2021-2030) ($MN)
95 Asia Pacific Hydraulic Fracturing Market Outlook, By Tight Gas (2021-2030) ($MN)
96 Asia Pacific Hydraulic Fracturing Market Outlook, By Shale Gas (2021-2030) ($MN)
97 South America Hydraulic Fracturing Market Outlook, By Country (2021-2030) ($MN)
98 South America Hydraulic Fracturing Market Outlook, By Type (2021-2030) ($MN)
99 South America Hydraulic Fracturing Market Outlook, By Commissary/Shared Kitchen (2021-2030) ($MN)
100 South America Hydraulic Fracturing Market Outlook, By Kitchen Pods (2021-2030) ($MN)
101 South America Hydraulic Fracturing Market Outlook, By Independent (2021-2030) ($MN)
102 South America Hydraulic Fracturing Market Outlook, By Well Type (2021-2030) ($MN)
103 South America Hydraulic Fracturing Market Outlook, By Vertical (2021-2030) ($MN)
104 South America Hydraulic Fracturing Market Outlook, By Horizontal (2021-2030) ($MN)
105 South America Hydraulic Fracturing Market Outlook, By Fluid Type (2021-2030) ($MN)
106 South America Hydraulic Fracturing Market Outlook, By Gelled Oil-based Fluid (2021-2030) ($MN)
107 South America Hydraulic Fracturing Market Outlook, By Foam-based Fluid (2021-2030) ($MN)
108 South America Hydraulic Fracturing Market Outlook, By Slick Water-based Fluid (2021-2030) ($MN)
109 South America Hydraulic Fracturing Market Outlook, By Other Fluid Types (2021-2030) ($MN)
110 South America Hydraulic Fracturing Market Outlook, By Other Types (2021-2030) ($MN)
111 South America Hydraulic Fracturing Market Outlook, By Nature (2021-2030) ($MN)
112 South America Hydraulic Fracturing Market Outlook, By Franchised (2021-2030) ($MN)
113 South America Hydraulic Fracturing Market Outlook, By Standalone (2021-2030) ($MN)
114 South America Hydraulic Fracturing Market Outlook, By Technology (2021-2030) ($MN)
115 South America Hydraulic Fracturing Market Outlook, By Sliding Slee (2021-2030) ($MN)
116 South America Hydraulic Fracturing Market Outlook, By Plug & Perf (2021-2030) ($MN)
117 South America Hydraulic Fracturing Market Outlook, By Application (2021-2030) ($MN)
118 South America Hydraulic Fracturing Market Outlook, By Tight Oil (2021-2030) ($MN)
119 South America Hydraulic Fracturing Market Outlook, By Tight Gas (2021-2030) ($MN)
120 South America Hydraulic Fracturing Market Outlook, By Shale Gas (2021-2030) ($MN)
121 Middle East & Africa Hydraulic Fracturing Market Outlook, By Country (2021-2030) ($MN)
122 Middle East & Africa Hydraulic Fracturing Market Outlook, By Type (2021-2030) ($MN)
123 Middle East & Africa Hydraulic Fracturing Market Outlook, By Commissary/Shared Kitchen (2021-2030) ($MN)
124 Middle East & Africa Hydraulic Fracturing Market Outlook, By Kitchen Pods (2021-2030) ($MN)
125 Middle East & Africa Hydraulic Fracturing Market Outlook, By Independent (2021-2030) ($MN)
126 Middle East & Africa Hydraulic Fracturing Market Outlook, By Well Type (2021-2030) ($MN)
127 Middle East & Africa Hydraulic Fracturing Market Outlook, By Vertical (2021-2030) ($MN)
128 Middle East & Africa Hydraulic Fracturing Market Outlook, By Horizontal (2021-2030) ($MN)
129 Middle East & Africa Hydraulic Fracturing Market Outlook, By Fluid Type (2021-2030) ($MN)
130 Middle East & Africa Hydraulic Fracturing Market Outlook, By Gelled Oil-based Fluid (2021-2030) ($MN)
131 Middle East & Africa Hydraulic Fracturing Market Outlook, By Foam-based Fluid (2021-2030) ($MN)
132 Middle East & Africa Hydraulic Fracturing Market Outlook, By Slick Water-based Fluid (2021-2030) ($MN)
133 Middle East & Africa Hydraulic Fracturing Market Outlook, By Other Fluid Types (2021-2030) ($MN)
134 Middle East & Africa Hydraulic Fracturing Market Outlook, By Other Types (2021-2030) ($MN)
135 Middle East & Africa Hydraulic Fracturing Market Outlook, By Nature (2021-2030) ($MN)
136 Middle East & Africa Hydraulic Fracturing Market Outlook, By Franchised (2021-2030) ($MN)
137 Middle East & Africa Hydraulic Fracturing Market Outlook, By Standalone (2021-2030) ($MN)
138 Middle East & Africa Hydraulic Fracturing Market Outlook, By Technology (2021-2030) ($MN)
139 Middle East & Africa Hydraulic Fracturing Market Outlook, By Sliding Slee (2021-2030) ($MN)
140 Middle East & Africa Hydraulic Fracturing Market Outlook, By Plug & Perf (2021-2030) ($MN)
141 Middle East & Africa Hydraulic Fracturing Market Outlook, By Application (2021-2030) ($MN)
142 Middle East & Africa Hydraulic Fracturing Market Outlook, By Tight Oil (2021-2030) ($MN)
143 Middle East & Africa Hydraulic Fracturing Market Outlook, By Tight Gas (2021-2030) ($MN)
144 Middle East & Africa Hydraulic Fracturing Market Outlook, By Shale Gas (2021-2030) ($MN)
List of Figures
RESEARCH METHODOLOGY

We at ‘Stratistics’ opt for an extensive research approach which involves data mining, data validation, and data analysis. The various research sources include in-house repository, secondary research, competitor’s sources, social media research, client internal data, and primary research.
Our team of analysts prefers the most reliable and authenticated data sources in order to perform the comprehensive literature search. With access to most of the authenticated data bases our team highly considers the best mix of information through various sources to obtain extensive and accurate analysis.
Each report takes an average time of a month and a team of 4 industry analysts. The time may vary depending on the scope and data availability of the desired market report. The various parameters used in the market assessment are standardized in order to enhance the data accuracy.
Data Mining
The data is collected from several authenticated, reliable, paid and unpaid sources and is filtered depending on the scope & objective of the research. Our reports repository acts as an added advantage in this procedure. Data gathering from the raw material suppliers, distributors and the manufacturers is performed on a regular basis, this helps in the comprehensive understanding of the products value chain. Apart from the above mentioned sources the data is also collected from the industry consultants to ensure the objective of the study is in the right direction.
Market trends such as technological advancements, regulatory affairs, market dynamics (Drivers, Restraints, Opportunities and Challenges) are obtained from scientific journals, market related national & international associations and organizations.
Data Analysis
From the data that is collected depending on the scope & objective of the research the data is subjected for the analysis. The critical steps that we follow for the data analysis include:
- Product Lifecycle Analysis
- Competitor analysis
- Risk analysis
- Porters Analysis
- PESTEL Analysis
- SWOT Analysis
The data engineering is performed by the core industry experts considering both the Marketing Mix Modeling and the Demand Forecasting. The marketing mix modeling makes use of multiple-regression techniques to predict the optimal mix of marketing variables. Regression factor is based on a number of variables and how they relate to an outcome such as sales or profits.
Data Validation
The data validation is performed by the exhaustive primary research from the expert interviews. This includes telephonic interviews, focus groups, face to face interviews, and questionnaires to validate our research from all aspects. The industry experts we approach come from the leading firms, involved in the supply chain ranging from the suppliers, distributors to the manufacturers and consumers so as to ensure an unbiased analysis.
We are in touch with more than 15,000 industry experts with the right mix of consultants, CEO's, presidents, vice presidents, managers, experts from both supply side and demand side, executives and so on.
The data validation involves the primary research from the industry experts belonging to:
- Leading Companies
- Suppliers & Distributors
- Manufacturers
- Consumers
- Industry/Strategic Consultants
Apart from the data validation the primary research also helps in performing the fill gap research, i.e. providing solutions for the unmet needs of the research which helps in enhancing the reports quality.
For more details about research methodology, kindly write to us at info@strategymrc.com
Frequently Asked Questions
In case of any queries regarding this report, you can contact the customer service by filing the “Inquiry Before Buy” form available on the right hand side. You may also contact us through email: info@strategymrc.com or phone: +1-301-202-5929
Yes, the samples are available for all the published reports. You can request them by filling the “Request Sample” option available in this page.
Yes, you can request a sample with your specific requirements. All the customized samples will be provided as per the requirement with the real data masked.
All our reports are available in Digital PDF format. In case if you require them in any other formats, such as PPT, Excel etc you can submit a request through “Inquiry Before Buy” form available on the right hand side. You may also contact us through email: info@strategymrc.com or phone: +1-301-202-5929
We offer a free 15% customization with every purchase. This requirement can be fulfilled for both pre and post sale. You may send your customization requirements through email at info@strategymrc.com or call us on +1-301-202-5929.
We have 3 different licensing options available in electronic format.
- Single User Licence: Allows one person, typically the buyer, to have access to the ordered product. The ordered product cannot be distributed to anyone else.
- 2-5 User Licence: Allows the ordered product to be shared among a maximum of 5 people within your organisation.
- Corporate License: Allows the product to be shared among all employees of your organisation regardless of their geographical location.
All our reports are typically be emailed to you as an attachment.
To order any available report you need to register on our website. The payment can be made either through CCAvenue or PayPal payments gateways which accept all international cards.
We extend our support to 6 months post sale. A post sale customization is also provided to cover your unmet needs in the report.
Request Customization
We offer complimentary customization of up to 15% with every purchase. To share your customization requirements, feel free to email us at info@strategymrc.com or call us on +1-301-202-5929. .
Please Note: Customization within the 15% threshold is entirely free of charge. If your request exceeds this limit, we will conduct a feasibility assessment. Following that, a detailed quote and timeline will be provided.
WHY CHOOSE US ?

Assured Quality
Best in class reports with high standard of research integrity

24X7 Research Support
Continuous support to ensure the best customer experience.

Free Customization
Adding more values to your product of interest.

Safe & Secure Access
Providing a secured environment for all online transactions.

Trusted by 600+ Brands
Serving the most reputed brands across the world.