
Hydrogen Buses Market
Hydrogen Buses Market Forecasts to 2030 - Global Analysis By Bus Type (Transit Buses, Coach Buses and Other Bus Types), Power Output (<150 kW, 150-250 kW, >250 kW and Other Power Outputs), Transit Bus Model (30-Foot Transit Buses, 40-Foot Transit Buses , 60-Foot Transit Buses and Other Transit Bus Models), Technology, Application and By Geography

|
Years Covered |
2021-2030 |
|
Estimated Year Value (2023) |
US $632.68 MN |
|
Projected Year Value (2030) |
US $938.83 MN |
|
CAGR (2023 - 2030) |
5.8% |
|
Regions Covered |
North America, Europe, Asia Pacific, South America, and Middle East & Africa |
|
Countries Covered |
US, Canada, Mexico, Germany, UK, Italy, France, Spain, Japan, China, India, Australia, New Zealand, South Korea, Rest of Asia Pacific, South America, Argentina, Brazil, Chile, Middle East & Africa, Saudi Arabia, UAE, Qatar, and South Africa |
|
Largest Market |
Asia Pacific |
|
Highest Growing Market |
Europe |
According to Stratistics MRC, the Global Hydrogen Buses Market is accounted for $632.68 million in 2023 and is expected to reach $938.83 million by 2030 growing at a CAGR of 5.8% during the forecast period. Public transportation vehicles that run-on hydrogen fuel cells as opposed to traditional hydrocarbon fuels are known as hydrogen buses. Their ability to offer a practical, healthy, and effective public transportation option is helping them gain popularity. On these buses, the electric motor is run by a fuel cell stack, which produces energy by combining hydrogen and oxygen.
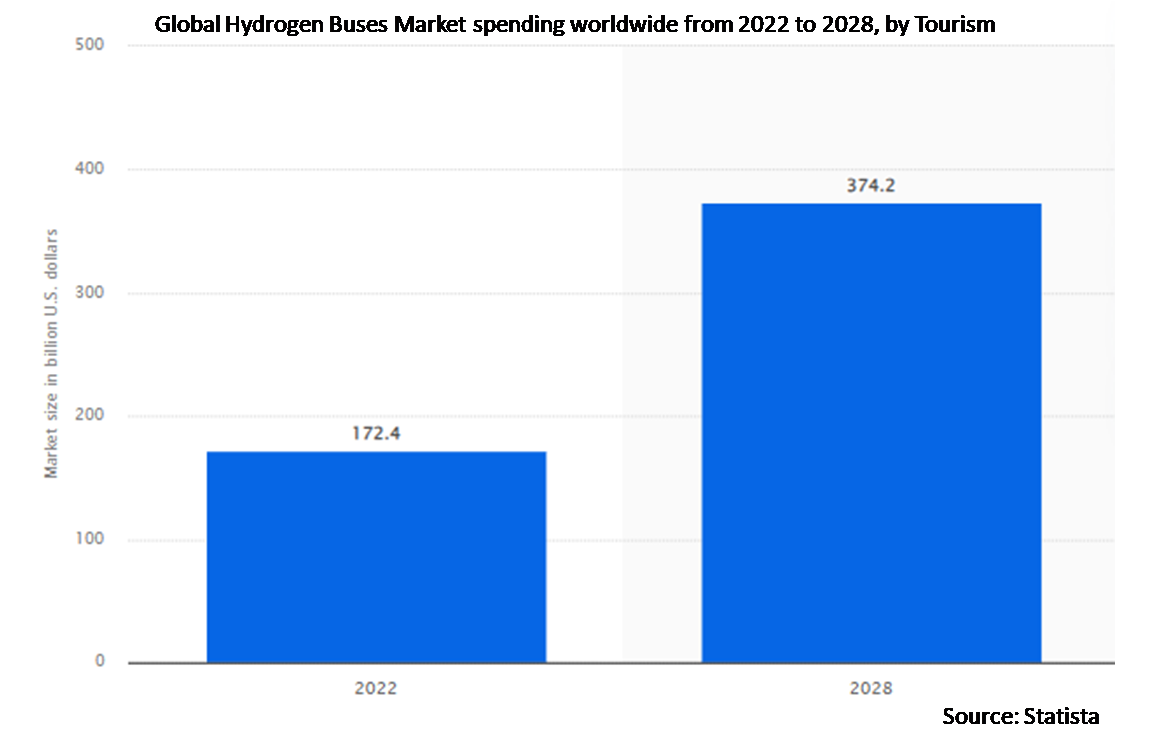
According to the World Travel and Tourism Council (WTTC), tourism accounted for 11.1% of Spain's gross domestic product in 2022. This is a substantial increase from the 10.4% contribution made in 2019.
Market Dynamics:
Driver:
Population growth and urbanization
The demand for effective, green public transportation options has increased due to the global trend of urbanization and population growth. By offering dependable and environmentally friendly mass transit options in densely populated urban areas, easing traffic congestion, and lowering pollution, hydrogen buses are well-suited to meet this demand. Moreover, hydrogen buses are poised to play a critical role in modernizing public transportation systems as cities continue to grow.
Restraint:
Battery-electric technology competition
Battery-electric buses, which have a stronger market presence thanks to lower initial costs and an established charging infrastructure, compete fiercely with hydrogen buses. The appeal of hydrogen buses has been further hampered by the advancements in battery technology, which have enabled electric buses to achieve longer ranges and better performance. However, manufacturers of hydrogen buses are under pressure from this competition to continuously innovate and cut costs in order to compete in the zero-emission transit market.
Opportunity:
Advances in green hydrogen production
The market for hydrogen buses has a critical opportunity due to ongoing research and investment in green hydrogen production technologies, particularly electrolysis powered by renewable energy. Furthermore, by switching to green hydrogen, hydrogen buses now have more environmental credibility in addition to reducing carbon emissions. Municipalities and transit agencies aiming to meet ambitious emissions reduction targets may find hydrogen buses to be a more sustainable and desirable option as the price of green hydrogen production keeps falling.
Threat:
Competing technologies for zero emissions
Zero-emission technologies, especially battery-electric buses, which have a larger market share because of lower initial costs, a more developed infrastructure, and the perception of higher energy efficiency, are a serious threat to hydrogen buses. Additionally, the rapid development of battery technology has also made it possible for electric buses to achieve longer ranges and quicker charging times, posing a serious threat to the development of hydrogen buses, especially in areas with well-developed electric infrastructure.
Covid-19 Impact:
The COVID-19 pandemic had a wide range of effects on the market for hydrogen buses. Due to lockdowns and restrictions, it initially caused supply chains, manufacturing, and infrastructure construction for hydrogen to be disrupted, but it also brought attention to the significance of sustainable and clean transportation. Recovery efforts following the pandemic in many areas have refocused on green initiatives, potentially accelerating investments in infrastructure and hydrogen technology. Moreover, the pandemic's effects on the economy, such as budget restrictions for municipalities and transit systems, have also slowed the market's expansion.
The Transit Buses segment is expected to be the largest during the forecast period
The hydrogen bus market's largest share belongs to the transit bus segment. Transit buses are the backbone of many cities' mass transit systems and are primarily created for urban and suburban public transportation. Moreover, population growth, urbanization, environmental concerns, and government investments in public transportation infrastructure are some of the factors that influence the demand for transit buses. The popularity of transit buses in the market is also aided by the growing focus on switching to cleaner and more sustainable transit options, such as electric and hydrogen-powered buses.
The Solid Oxide Fuel Cells segment is expected to have the highest CAGR during the forecast period
The market's highest CAGRs were being experienced by the Solid Oxide Fuel Cells (SOFCs) segment. High efficiency, fuel flexibility (they can use a variety of fuels like hydrogen, natural gas, and biogas), and suitability for both stationary and mobile applications are just a few benefits that solid oxide fuel cells have to offer. Due to these characteristics, SOFC technology for power generation, distributed energy systems, and transportation has seen an increase in interest and investment. Additionally, SOFCs' strong growth in the fuel cell market is a result of ongoing research and development projects aimed at enhancing performance and lowering costs.
Region with largest share:
The largest market share was held by the Asia-Pacific region. This dominance was primarily attributed to the quick urbanization, industrialization, and economic development in nations like China, Japan, and South Korea, which led to a rise in demand for clean energy options. These countries have made significant investments in fuel cell and hydrogen technology for a range of uses, including stationary power generation and transportation. Moreover, the expansion of the fuel cell market in the Asia-Pacific region has also been aided by government policies, incentives, and programs that promote sustainable energy and lower carbon emissions.
Region with highest CAGR:
The market's highest CAGR is anticipated to be in the European region. Germany, the United Kingdom, and France were among the European nations making significant investments in fuel cell technology for various uses. This growth was largely fueled by the European Union's determination to cut greenhouse gas emissions and become carbon neutral. Additionally, the region is seeing an increase in the use of fuel cell systems in applications like transportation, stationary power generation, and industrial processes. Europe is positioned as a high-growth region in the fuel cell market due to its focus on sustainable energy solutions and its well-developed infrastructure for hydrogen production and distribution.

Key players in the market
Some of the key players in Hydrogen Buses Market include Alstom, Nova Bus Corporation, SunLine Transit Agency, ElringKlinger AG, Tata Motors Limited, New Flyer Industries Inc, Evo Bus, Ballard Power Systems, Hyundai Motor Company, CaetanoBus, Hino Motors Ltd., Thor Industries, Bluebus, Toyota Motor Corporation, Daimler AG, Yutong Bus Co., Ltd, Nikola Motor Company, Volvo Group and The Lion Electric Co.
Key Developments:
In July 2023, Hyundai Motor Company unveiled its completely redesigned, all-new Santa Fe today. The fifth-generation midsize SUV maintains its characteristic nature-meets-city charm while incorporating important upgrades molded by big data and centered on the most recent outdoor lifestyle trends.
In July 2023, Alstom, global leader in smart and sustainable mobility, and Akiem European rolling stock leasing company have signed a framework contract for 100 Traxx Universal multi-system (MS3) locomotives. The firm part of the order includes 65 locomotives. The total amount of the framework agreement is up 500 million euros.
In April 2023, Saskatoon Transit signs contract with Nova Bus for first two battery-electric buses. Saskatoon Transit is taking the first step in electrifying its bus fleet by signing a contract for two Nova LFSe+ electric buses. These will be the first two permanent battery-electric buses in Saskatoon Transit’s fleet and the first in Saskatchewan. The long-range battery-electric bus can travel more than 300 kilometres on a single charge.
Bus Types Covered:
• Transit Buses
• Coach Buses
• Other Bus Types
Power Outputs Covered:
• <150 kW
• 150-250 kW
• >250 kW
• Other Power Outputs
Transit Bus Models Covered:
• 30-Foot Transit Buses
• 40-Foot Transit Buses
• 60-Foot Transit Buses
• Other Transit Bus Models
Technologies Covered:
• Proton Exchange Membrane Fuel Cells
• Direct Methanol Fuel Cells
• Phosphoric Acid Fuel Cells
• Zinc-Air Fuel Cells
• Solid Oxide Fuel Cells
• Other Technologies
Applications Covered:
• Public Transportation
• Tourism
• Other Applications
Regions Covered:
• North America
o US
o Canada
o Mexico
• Europe
o Germany
o UK
o Italy
o France
o Spain
o Rest of Europe
• Asia Pacific
o Japan
o China
o India
o Australia
o New Zealand
o South Korea
o Rest of Asia Pacific
• South America
o Argentina
o Brazil
o Chile
o Rest of South America
• Middle East & Africa
o Saudi Arabia
o UAE
o Qatar
o South Africa
o Rest of Middle East & Africa
What our report offers:
- Market share assessments for the regional and country-level segments
- Strategic recommendations for the new entrants
- Covers Market data for the years 2021, 2022, 2023, 2026, and 2030
- Market Trends (Drivers, Constraints, Opportunities, Threats, Challenges, Investment Opportunities, and recommendations)
- Strategic recommendations in key business segments based on the market estimations
- Competitive landscaping mapping the key common trends
- Company profiling with detailed strategies, financials, and recent developments
- Supply chain trends mapping the latest technological advancements
Free Customization Offerings:
All the customers of this report will be entitled to receive one of the following free customization options:
• Company Profiling
o Comprehensive profiling of additional market players (up to 3)
o SWOT Analysis of key players (up to 3)
• Regional Segmentation
o Market estimations, Forecasts and CAGR of any prominent country as per the client's interest (Note: Depends on feasibility check)
• Competitive Benchmarking
Benchmarking of key players based on product portfolio, geographical presence, and strategic alliances
Table of Contents
1 Executive Summary
2 Preface
2.1 Abstract
2.2 Stake Holders
2.3 Research Scope
2.4 Research Methodology
2.4.1 Data Mining
2.4.2 Data Analysis
2.4.3 Data Validation
2.4.4 Research Approach
2.5 Research Sources
2.5.1 Primary Research Sources
2.5.2 Secondary Research Sources
2.5.3 Assumptions
3 Market Trend Analysis
3.1 Introduction
3.2 Drivers
3.3 Restraints
3.4 Opportunities
3.5 Threats
3.6 Technology Analysis
3.7 Application Analysis
3.8 Emerging Markets
3.9 Impact of Covid-19
4 Porters Five Force Analysis
4.1 Bargaining power of suppliers
4.2 Bargaining power of buyers
4.3 Threat of substitutes
4.4 Threat of new entrants
4.5 Competitive rivalry
5 Global Hydrogen Buses Market, By Bus Type
5.1 Introduction
5.2 Transit Buses
5.3 Coach Buses
5.4 Other Bus Types
6 Global Hydrogen Buses Market, By Power Output
6.1 Introduction
6.2 <150 kW
6.3 150-250 kW
6.4 >250 kW
6.5 Other Power Outputs
7 Global Hydrogen Buses Market, By Transit Bus Model
7.1 Introduction
7.2 30-Foot Transit Buses
7.3 40-Foot Transit Buses
7.4 60-Foot Transit Buses
7.5 Other Transit Bus Models
8 Global Hydrogen Buses Market, By Technology
8.1 Introduction
8.2 Proton Exchange Membrane Fuel Cells
8.3 Direct Methanol Fuel Cells
8.4 Phosphoric Acid Fuel Cells
8.5 Zinc-Air Fuel Cells
8.6 Solid Oxide Fuel Cells
8.7 Other Technologies
9 Global Hydrogen Buses Market, By Application
9.1 Introduction
9.2 Public Transportation
9.3 Tourism
9.4 Other Applications
10 Global Hydrogen Buses Market, By Geography
10.1 Introduction
10.2 North America
10.2.1 US
10.2.2 Canada
10.2.3 Mexico
10.3 Europe
10.3.1 Germany
10.3.2 UK
10.3.3 Italy
10.3.4 France
10.3.5 Spain
10.3.6 Rest of Europe
10.4 Asia Pacific
10.4.1 Japan
10.4.2 China
10.4.3 India
10.4.4 Australia
10.4.5 New Zealand
10.4.6 South Korea
10.4.7 Rest of Asia Pacific
10.5 South America
10.5.1 Argentina
10.5.2 Brazil
10.5.3 Chile
10.5.4 Rest of South America
10.6 Middle East & Africa
10.6.1 Saudi Arabia
10.6.2 UAE
10.6.3 Qatar
10.6.4 South Africa
10.6.5 Rest of Middle East & Africa
11 Key Developments
11.1 Agreements, Partnerships, Collaborations and Joint Ventures
11.2 Acquisitions & Mergers
11.3 New Product Launch
11.4 Expansions
11.5 Other Key Strategies
12 Company Profiling
12.1 Alstom
12.2 Nova Bus Corporation
12.3 SunLine Transit Agency
12.4 ElringKlinger AG
12.5 Tata Motors Limited
12.6 New Flyer Industries Inc
12.7 Evo Bus
12.8 Ballard Power Systems
12.9 Hyundai Motor Company
12.10 CaetanoBus
12.11 Hino Motors Ltd.
12.12 Thor Industries
12.13 Bluebus
12.14 Toyota Motor Corporation
12.15 Daimler AG
12.16 Yutong Bus Co., Ltd
12.17 Nikola Motor Company
12.18 Volvo Group
12.19 The Lion Electric Co
List of Tables
1 Global Hydrogen Buses Market Outlook, By Region (2021-2030) ($MN)
2 Global Hydrogen Buses Market Outlook, By Bus Type (2021-2030) ($MN)
3 Global Hydrogen Buses Market Outlook, By Transit Buses (2021-2030) ($MN)
4 Global Hydrogen Buses Market Outlook, By Coach Buses (2021-2030) ($MN)
5 Global Hydrogen Buses Market Outlook, By Other Bus Types (2021-2030) ($MN)
6 Global Hydrogen Buses Market Outlook, By Power Output (2021-2030) ($MN)
7 Global Hydrogen Buses Market Outlook, By <150 kW (2021-2030) ($MN)
8 Global Hydrogen Buses Market Outlook, By 150-250 kW (2021-2030) ($MN)
9 Global Hydrogen Buses Market Outlook, By >250 kW (2021-2030) ($MN)
10 Global Hydrogen Buses Market Outlook, By Other Power Outputs (2021-2030) ($MN)
11 Global Hydrogen Buses Market Outlook, By Transit Bus Model (2021-2030) ($MN)
12 Global Hydrogen Buses Market Outlook, By 30-Foot Transit Buses (2021-2030) ($MN)
13 Global Hydrogen Buses Market Outlook, By 40-Foot Transit Buses (2021-2030) ($MN)
14 Global Hydrogen Buses Market Outlook, By 60-Foot Transit Buses (2021-2030) ($MN)
15 Global Hydrogen Buses Market Outlook, By Other Transit Bus Models (2021-2030) ($MN)
16 Global Hydrogen Buses Market Outlook, By Technology (2021-2030) ($MN)
17 Global Hydrogen Buses Market Outlook, By Proton Exchange Membrane Fuel Cells (2021-2030) ($MN)
18 Global Hydrogen Buses Market Outlook, By Direct Methanol Fuel Cells (2021-2030) ($MN)
19 Global Hydrogen Buses Market Outlook, By Phosphoric Acid Fuel Cells (2021-2030) ($MN)
20 Global Hydrogen Buses Market Outlook, By Zinc-Air Fuel Cells (2021-2030) ($MN)
21 Global Hydrogen Buses Market Outlook, By Solid Oxide Fuel Cells (2021-2030) ($MN)
22 Global Hydrogen Buses Market Outlook, By Other Technologies (2021-2030) ($MN)
23 Global Hydrogen Buses Market Outlook, By Application (2021-2030) ($MN)
24 Global Hydrogen Buses Market Outlook, By Public Transportation (2021-2030) ($MN)
25 Global Hydrogen Buses Market Outlook, By Tourism (2021-2030) ($MN)
26 Global Hydrogen Buses Market Outlook, By Other Applications (2021-2030) ($MN)
27 North America Hydrogen Buses Market Outlook, By Country (2021-2030) ($MN)
28 North America Hydrogen Buses Market Outlook, By Bus Type (2021-2030) ($MN)
29 North America Hydrogen Buses Market Outlook, By Transit Buses (2021-2030) ($MN)
30 North America Hydrogen Buses Market Outlook, By Coach Buses (2021-2030) ($MN)
31 North America Hydrogen Buses Market Outlook, By Other Bus Types (2021-2030) ($MN)
32 North America Hydrogen Buses Market Outlook, By Power Output (2021-2030) ($MN)
33 North America Hydrogen Buses Market Outlook, By <150 kW (2021-2030) ($MN)
34 North America Hydrogen Buses Market Outlook, By 150-250 kW (2021-2030) ($MN)
35 North America Hydrogen Buses Market Outlook, By >250 kW (2021-2030) ($MN)
36 North America Hydrogen Buses Market Outlook, By Other Power Outputs (2021-2030) ($MN)
37 North America Hydrogen Buses Market Outlook, By Transit Bus Model (2021-2030) ($MN)
38 North America Hydrogen Buses Market Outlook, By 30-Foot Transit Buses (2021-2030) ($MN)
39 North America Hydrogen Buses Market Outlook, By 40-Foot Transit Buses (2021-2030) ($MN)
40 North America Hydrogen Buses Market Outlook, By 60-Foot Transit Buses (2021-2030) ($MN)
41 North America Hydrogen Buses Market Outlook, By Other Transit Bus Models (2021-2030) ($MN)
42 North America Hydrogen Buses Market Outlook, By Technology (2021-2030) ($MN)
43 North America Hydrogen Buses Market Outlook, By Proton Exchange Membrane Fuel Cells (2021-2030) ($MN)
44 North America Hydrogen Buses Market Outlook, By Direct Methanol Fuel Cells (2021-2030) ($MN)
45 North America Hydrogen Buses Market Outlook, By Phosphoric Acid Fuel Cells (2021-2030) ($MN)
46 North America Hydrogen Buses Market Outlook, By Zinc-Air Fuel Cells (2021-2030) ($MN)
47 North America Hydrogen Buses Market Outlook, By Solid Oxide Fuel Cells (2021-2030) ($MN)
48 North America Hydrogen Buses Market Outlook, By Other Technologies (2021-2030) ($MN)
49 North America Hydrogen Buses Market Outlook, By Application (2021-2030) ($MN)
50 North America Hydrogen Buses Market Outlook, By Public Transportation (2021-2030) ($MN)
51 North America Hydrogen Buses Market Outlook, By Tourism (2021-2030) ($MN)
52 North America Hydrogen Buses Market Outlook, By Other Applications (2021-2030) ($MN)
53 Europe Hydrogen Buses Market Outlook, By Country (2021-2030) ($MN)
54 Europe Hydrogen Buses Market Outlook, By Bus Type (2021-2030) ($MN)
55 Europe Hydrogen Buses Market Outlook, By Transit Buses (2021-2030) ($MN)
56 Europe Hydrogen Buses Market Outlook, By Coach Buses (2021-2030) ($MN)
57 Europe Hydrogen Buses Market Outlook, By Other Bus Types (2021-2030) ($MN)
58 Europe Hydrogen Buses Market Outlook, By Power Output (2021-2030) ($MN)
59 Europe Hydrogen Buses Market Outlook, By <150 kW (2021-2030) ($MN)
60 Europe Hydrogen Buses Market Outlook, By 150-250 kW (2021-2030) ($MN)
61 Europe Hydrogen Buses Market Outlook, By >250 kW (2021-2030) ($MN)
62 Europe Hydrogen Buses Market Outlook, By Other Power Outputs (2021-2030) ($MN)
63 Europe Hydrogen Buses Market Outlook, By Transit Bus Model (2021-2030) ($MN)
64 Europe Hydrogen Buses Market Outlook, By 30-Foot Transit Buses (2021-2030) ($MN)
65 Europe Hydrogen Buses Market Outlook, By 40-Foot Transit Buses (2021-2030) ($MN)
66 Europe Hydrogen Buses Market Outlook, By 60-Foot Transit Buses (2021-2030) ($MN)
67 Europe Hydrogen Buses Market Outlook, By Other Transit Bus Models (2021-2030) ($MN)
68 Europe Hydrogen Buses Market Outlook, By Technology (2021-2030) ($MN)
69 Europe Hydrogen Buses Market Outlook, By Proton Exchange Membrane Fuel Cells (2021-2030) ($MN)
70 Europe Hydrogen Buses Market Outlook, By Direct Methanol Fuel Cells (2021-2030) ($MN)
71 Europe Hydrogen Buses Market Outlook, By Phosphoric Acid Fuel Cells (2021-2030) ($MN)
72 Europe Hydrogen Buses Market Outlook, By Zinc-Air Fuel Cells (2021-2030) ($MN)
73 Europe Hydrogen Buses Market Outlook, By Solid Oxide Fuel Cells (2021-2030) ($MN)
74 Europe Hydrogen Buses Market Outlook, By Other Technologies (2021-2030) ($MN)
75 Europe Hydrogen Buses Market Outlook, By Application (2021-2030) ($MN)
76 Europe Hydrogen Buses Market Outlook, By Public Transportation (2021-2030) ($MN)
77 Europe Hydrogen Buses Market Outlook, By Tourism (2021-2030) ($MN)
78 Europe Hydrogen Buses Market Outlook, By Other Applications (2021-2030) ($MN)
79 Asia Pacific Hydrogen Buses Market Outlook, By Country (2021-2030) ($MN)
80 Asia Pacific Hydrogen Buses Market Outlook, By Bus Type (2021-2030) ($MN)
81 Asia Pacific Hydrogen Buses Market Outlook, By Transit Buses (2021-2030) ($MN)
82 Asia Pacific Hydrogen Buses Market Outlook, By Coach Buses (2021-2030) ($MN)
83 Asia Pacific Hydrogen Buses Market Outlook, By Other Bus Types (2021-2030) ($MN)
84 Asia Pacific Hydrogen Buses Market Outlook, By Power Output (2021-2030) ($MN)
85 Asia Pacific Hydrogen Buses Market Outlook, By <150 kW (2021-2030) ($MN)
86 Asia Pacific Hydrogen Buses Market Outlook, By 150-250 kW (2021-2030) ($MN)
87 Asia Pacific Hydrogen Buses Market Outlook, By >250 kW (2021-2030) ($MN)
88 Asia Pacific Hydrogen Buses Market Outlook, By Other Power Outputs (2021-2030) ($MN)
89 Asia Pacific Hydrogen Buses Market Outlook, By Transit Bus Model (2021-2030) ($MN)
90 Asia Pacific Hydrogen Buses Market Outlook, By 30-Foot Transit Buses (2021-2030) ($MN)
91 Asia Pacific Hydrogen Buses Market Outlook, By 40-Foot Transit Buses (2021-2030) ($MN)
92 Asia Pacific Hydrogen Buses Market Outlook, By 60-Foot Transit Buses (2021-2030) ($MN)
93 Asia Pacific Hydrogen Buses Market Outlook, By Other Transit Bus Models (2021-2030) ($MN)
94 Asia Pacific Hydrogen Buses Market Outlook, By Technology (2021-2030) ($MN)
95 Asia Pacific Hydrogen Buses Market Outlook, By Proton Exchange Membrane Fuel Cells (2021-2030) ($MN)
96 Asia Pacific Hydrogen Buses Market Outlook, By Direct Methanol Fuel Cells (2021-2030) ($MN)
97 Asia Pacific Hydrogen Buses Market Outlook, By Phosphoric Acid Fuel Cells (2021-2030) ($MN)
98 Asia Pacific Hydrogen Buses Market Outlook, By Zinc-Air Fuel Cells (2021-2030) ($MN)
99 Asia Pacific Hydrogen Buses Market Outlook, By Solid Oxide Fuel Cells (2021-2030) ($MN)
100 Asia Pacific Hydrogen Buses Market Outlook, By Other Technologies (2021-2030) ($MN)
101 Asia Pacific Hydrogen Buses Market Outlook, By Application (2021-2030) ($MN)
102 Asia Pacific Hydrogen Buses Market Outlook, By Public Transportation (2021-2030) ($MN)
103 Asia Pacific Hydrogen Buses Market Outlook, By Tourism (2021-2030) ($MN)
104 Asia Pacific Hydrogen Buses Market Outlook, By Other Applications (2021-2030) ($MN)
105 South America Hydrogen Buses Market Outlook, By Country (2021-2030) ($MN)
106 South America Hydrogen Buses Market Outlook, By Bus Type (2021-2030) ($MN)
107 South America Hydrogen Buses Market Outlook, By Transit Buses (2021-2030) ($MN)
108 South America Hydrogen Buses Market Outlook, By Coach Buses (2021-2030) ($MN)
109 South America Hydrogen Buses Market Outlook, By Other Bus Types (2021-2030) ($MN)
110 South America Hydrogen Buses Market Outlook, By Power Output (2021-2030) ($MN)
111 South America Hydrogen Buses Market Outlook, By <150 kW (2021-2030) ($MN)
112 South America Hydrogen Buses Market Outlook, By 150-250 kW (2021-2030) ($MN)
113 South America Hydrogen Buses Market Outlook, By >250 kW (2021-2030) ($MN)
114 South America Hydrogen Buses Market Outlook, By Other Power Outputs (2021-2030) ($MN)
115 South America Hydrogen Buses Market Outlook, By Transit Bus Model (2021-2030) ($MN)
116 South America Hydrogen Buses Market Outlook, By 30-Foot Transit Buses (2021-2030) ($MN)
117 South America Hydrogen Buses Market Outlook, By 40-Foot Transit Buses (2021-2030) ($MN)
118 South America Hydrogen Buses Market Outlook, By 60-Foot Transit Buses (2021-2030) ($MN)
119 South America Hydrogen Buses Market Outlook, By Other Transit Bus Models (2021-2030) ($MN)
120 South America Hydrogen Buses Market Outlook, By Technology (2021-2030) ($MN)
121 South America Hydrogen Buses Market Outlook, By Proton Exchange Membrane Fuel Cells (2021-2030) ($MN)
122 South America Hydrogen Buses Market Outlook, By Direct Methanol Fuel Cells (2021-2030) ($MN)
123 South America Hydrogen Buses Market Outlook, By Phosphoric Acid Fuel Cells (2021-2030) ($MN)
124 South America Hydrogen Buses Market Outlook, By Zinc-Air Fuel Cells (2021-2030) ($MN)
125 South America Hydrogen Buses Market Outlook, By Solid Oxide Fuel Cells (2021-2030) ($MN)
126 South America Hydrogen Buses Market Outlook, By Other Technologies (2021-2030) ($MN)
127 South America Hydrogen Buses Market Outlook, By Application (2021-2030) ($MN)
128 South America Hydrogen Buses Market Outlook, By Public Transportation (2021-2030) ($MN)
129 South America Hydrogen Buses Market Outlook, By Tourism (2021-2030) ($MN)
130 South America Hydrogen Buses Market Outlook, By Other Applications (2021-2030) ($MN)
131 Middle East & Africa Hydrogen Buses Market Outlook, By Country (2021-2030) ($MN)
132 Middle East & Africa Hydrogen Buses Market Outlook, By Bus Type (2021-2030) ($MN)
133 Middle East & Africa Hydrogen Buses Market Outlook, By Transit Buses (2021-2030) ($MN)
134 Middle East & Africa Hydrogen Buses Market Outlook, By Coach Buses (2021-2030) ($MN)
135 Middle East & Africa Hydrogen Buses Market Outlook, By Other Bus Types (2021-2030) ($MN)
136 Middle East & Africa Hydrogen Buses Market Outlook, By Power Output (2021-2030) ($MN)
137 Middle East & Africa Hydrogen Buses Market Outlook, By <150 kW (2021-2030) ($MN)
138 Middle East & Africa Hydrogen Buses Market Outlook, By 150-250 kW (2021-2030) ($MN)
139 Middle East & Africa Hydrogen Buses Market Outlook, By >250 kW (2021-2030) ($MN)
140 Middle East & Africa Hydrogen Buses Market Outlook, By Other Power Outputs (2021-2030) ($MN)
141 Middle East & Africa Hydrogen Buses Market Outlook, By Transit Bus Model (2021-2030) ($MN)
142 Middle East & Africa Hydrogen Buses Market Outlook, By 30-Foot Transit Buses (2021-2030) ($MN)
143 Middle East & Africa Hydrogen Buses Market Outlook, By 40-Foot Transit Buses (2021-2030) ($MN)
144 Middle East & Africa Hydrogen Buses Market Outlook, By 60-Foot Transit Buses (2021-2030) ($MN)
145 Middle East & Africa Hydrogen Buses Market Outlook, By Other Transit Bus Models (2021-2030) ($MN)
146 Middle East & Africa Hydrogen Buses Market Outlook, By Technology (2021-2030) ($MN)
147 Middle East & Africa Hydrogen Buses Market Outlook, By Proton Exchange Membrane Fuel Cells (2021-2030) ($MN)
148 Middle East & Africa Hydrogen Buses Market Outlook, By Direct Methanol Fuel Cells (2021-2030) ($MN)
149 Middle East & Africa Hydrogen Buses Market Outlook, By Phosphoric Acid Fuel Cells (2021-2030) ($MN)
150 Middle East & Africa Hydrogen Buses Market Outlook, By Zinc-Air Fuel Cells (2021-2030) ($MN)
151 Middle East & Africa Hydrogen Buses Market Outlook, By Solid Oxide Fuel Cells (2021-2030) ($MN)
152 Middle East & Africa Hydrogen Buses Market Outlook, By Other Technologies (2021-2030) ($MN)
153 Middle East & Africa Hydrogen Buses Market Outlook, By Application (2021-2030) ($MN)
154 Middle East & Africa Hydrogen Buses Market Outlook, By Public Transportation (2021-2030) ($MN)
155 Middle East & Africa Hydrogen Buses Market Outlook, By Tourism (2021-2030) ($MN)
156 Middle East & Africa Hydrogen Buses Market Outlook, By Other Applications (2021-2030) ($MN)
List of Figures
RESEARCH METHODOLOGY

We at ‘Stratistics’ opt for an extensive research approach which involves data mining, data validation, and data analysis. The various research sources include in-house repository, secondary research, competitor’s sources, social media research, client internal data, and primary research.
Our team of analysts prefers the most reliable and authenticated data sources in order to perform the comprehensive literature search. With access to most of the authenticated data bases our team highly considers the best mix of information through various sources to obtain extensive and accurate analysis.
Each report takes an average time of a month and a team of 4 industry analysts. The time may vary depending on the scope and data availability of the desired market report. The various parameters used in the market assessment are standardized in order to enhance the data accuracy.
Data Mining
The data is collected from several authenticated, reliable, paid and unpaid sources and is filtered depending on the scope & objective of the research. Our reports repository acts as an added advantage in this procedure. Data gathering from the raw material suppliers, distributors and the manufacturers is performed on a regular basis, this helps in the comprehensive understanding of the products value chain. Apart from the above mentioned sources the data is also collected from the industry consultants to ensure the objective of the study is in the right direction.
Market trends such as technological advancements, regulatory affairs, market dynamics (Drivers, Restraints, Opportunities and Challenges) are obtained from scientific journals, market related national & international associations and organizations.
Data Analysis
From the data that is collected depending on the scope & objective of the research the data is subjected for the analysis. The critical steps that we follow for the data analysis include:
- Product Lifecycle Analysis
- Competitor analysis
- Risk analysis
- Porters Analysis
- PESTEL Analysis
- SWOT Analysis
The data engineering is performed by the core industry experts considering both the Marketing Mix Modeling and the Demand Forecasting. The marketing mix modeling makes use of multiple-regression techniques to predict the optimal mix of marketing variables. Regression factor is based on a number of variables and how they relate to an outcome such as sales or profits.
Data Validation
The data validation is performed by the exhaustive primary research from the expert interviews. This includes telephonic interviews, focus groups, face to face interviews, and questionnaires to validate our research from all aspects. The industry experts we approach come from the leading firms, involved in the supply chain ranging from the suppliers, distributors to the manufacturers and consumers so as to ensure an unbiased analysis.
We are in touch with more than 15,000 industry experts with the right mix of consultants, CEO's, presidents, vice presidents, managers, experts from both supply side and demand side, executives and so on.
The data validation involves the primary research from the industry experts belonging to:
- Leading Companies
- Suppliers & Distributors
- Manufacturers
- Consumers
- Industry/Strategic Consultants
Apart from the data validation the primary research also helps in performing the fill gap research, i.e. providing solutions for the unmet needs of the research which helps in enhancing the reports quality.
For more details about research methodology, kindly write to us at info@strategymrc.com
Frequently Asked Questions
In case of any queries regarding this report, you can contact the customer service by filing the “Inquiry Before Buy” form available on the right hand side. You may also contact us through email: info@strategymrc.com or phone: +1-301-202-5929
Yes, the samples are available for all the published reports. You can request them by filling the “Request Sample” option available in this page.
Yes, you can request a sample with your specific requirements. All the customized samples will be provided as per the requirement with the real data masked.
All our reports are available in Digital PDF format. In case if you require them in any other formats, such as PPT, Excel etc you can submit a request through “Inquiry Before Buy” form available on the right hand side. You may also contact us through email: info@strategymrc.com or phone: +1-301-202-5929
We offer a free 15% customization with every purchase. This requirement can be fulfilled for both pre and post sale. You may send your customization requirements through email at info@strategymrc.com or call us on +1-301-202-5929.
We have 3 different licensing options available in electronic format.
- Single User Licence: Allows one person, typically the buyer, to have access to the ordered product. The ordered product cannot be distributed to anyone else.
- 2-5 User Licence: Allows the ordered product to be shared among a maximum of 5 people within your organisation.
- Corporate License: Allows the product to be shared among all employees of your organisation regardless of their geographical location.
All our reports are typically be emailed to you as an attachment.
To order any available report you need to register on our website. The payment can be made either through CCAvenue or PayPal payments gateways which accept all international cards.
We extend our support to 6 months post sale. A post sale customization is also provided to cover your unmet needs in the report.
Request Customization
We offer complimentary customization of up to 15% with every purchase. To share your customization requirements, feel free to email us at info@strategymrc.com or call us on +1-301-202-5929. .
Please Note: Customization within the 15% threshold is entirely free of charge. If your request exceeds this limit, we will conduct a feasibility assessment. Following that, a detailed quote and timeline will be provided.
WHY CHOOSE US ?

Assured Quality
Best in class reports with high standard of research integrity

24X7 Research Support
Continuous support to ensure the best customer experience.

Free Customization
Adding more values to your product of interest.

Safe & Secure Access
Providing a secured environment for all online transactions.

Trusted by 600+ Brands
Serving the most reputed brands across the world.