
Hyperlocal Weather Insights Market
Hyperlocal Weather Insights Market Forecasts to 2034 - Global Analysis By Component (Solutions, Services), Deployment Mode, Forecast Type, Technology, Application, End User and By Geography

|
Years Covered |
2023-2034 |
|
Estimated Year Value (2026) |
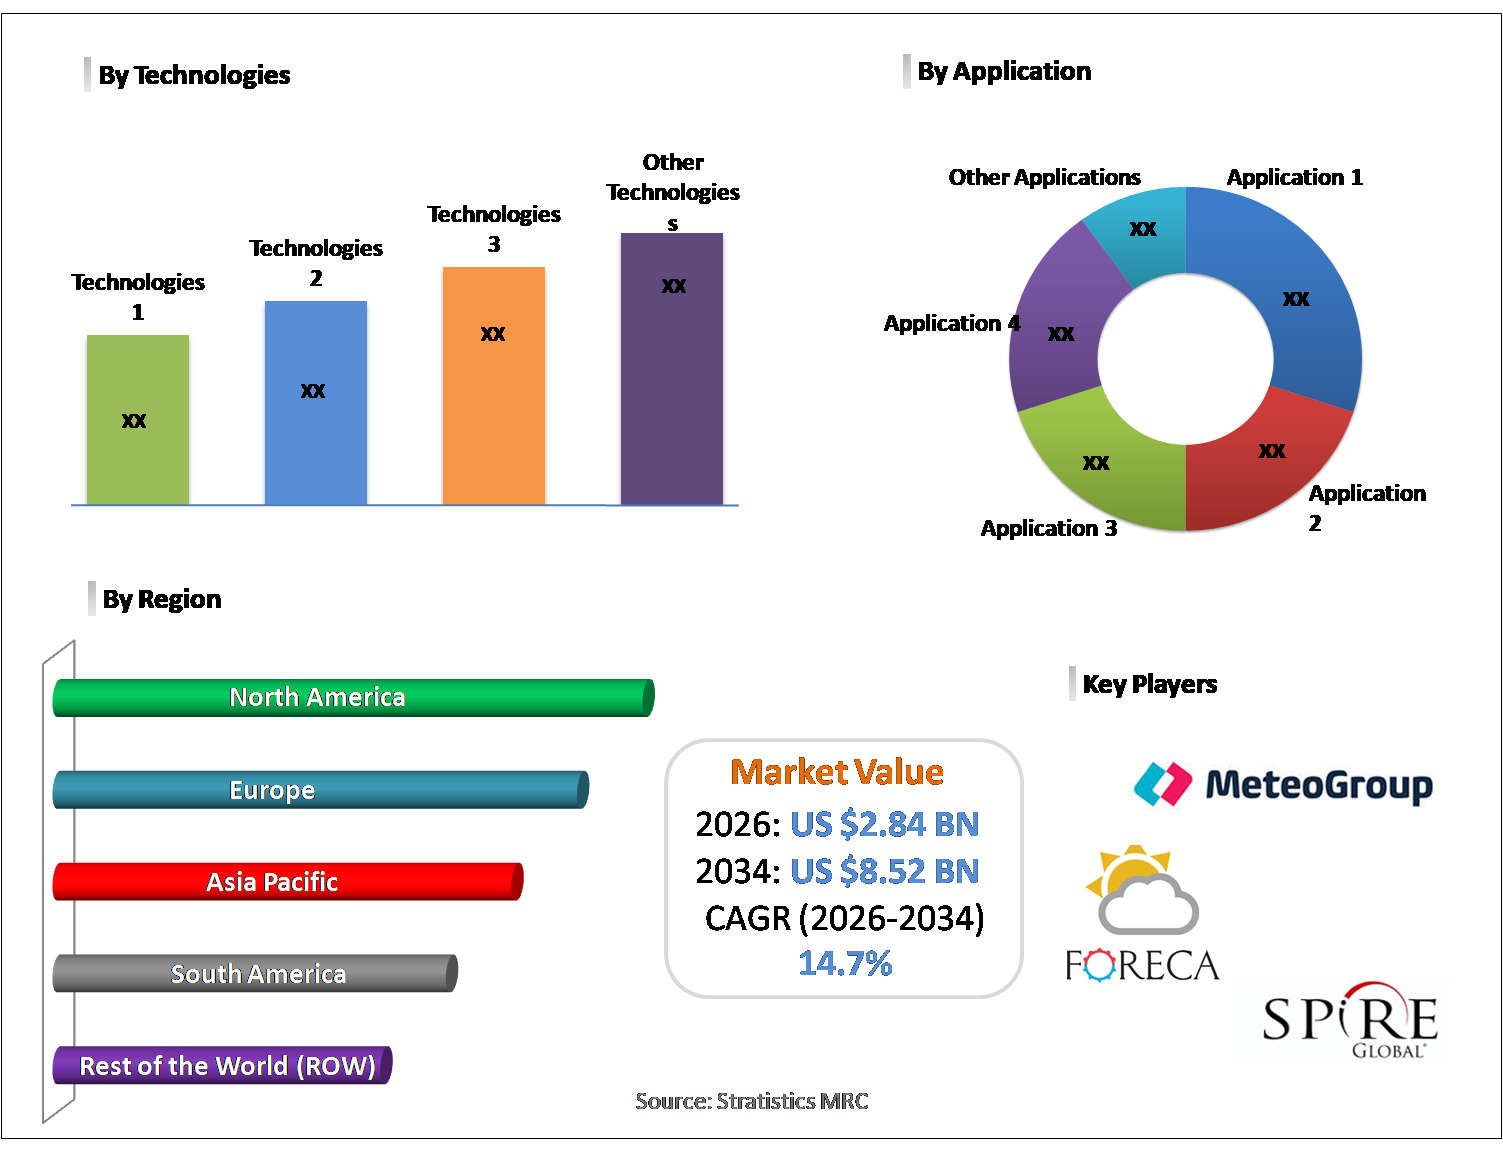
US $2.84 BN |
|
Projected Year Value (2034) |
US $8.52 BN |
|
CAGR (2026-2034) |
14.7% |
|
Regions Covered |
North America, Europe, Asia Pacific, South America, and Rest of the World (RoW) |
|
Countries Covered |
United States, Canada, Mexico, United Kingdom, Germany, France, Italy, Spain, Netherlands, Belgium, Sweden, Switzerland, Poland, Rest of Europe, China, Japan, India, South Korea, Australia, Indonesia, Thailand, Malaysia, Singapore, Vietnam, Rest of Asia Pacific, Brazil, Argentina, Colombia, Chile, Peru, Rest of South America, Saudi Arabia, United Arab Emirates, Qatar, Israel, Rest of Middle East, South Africa, Egypt, Morocco, and Rest of Africa. |
|
Largest Market |
North America |
|
Highest Growing Market |
Asia Pacific |
According to Stratistics MRC, the Global Hyperlocal Weather Insights Market is accounted for $2.84 billion in 2026 and is expected to reach $8.52 billion by 2034 growing at a CAGR of 14.7% during the forecast period. Hyperlocal weather insights refer to highly precise, location-specific weather intelligence delivered at neighborhood, street, or asset level using dense sensor networks, satellite data, and advanced predictive analytics. Unlike traditional regional forecasts, hyperlocal solutions provide real-time micro-weather conditions such as temperature, precipitation, wind, and air quality with fine spatial and temporal resolution. These insights support critical decision-making across industries including agriculture, transportation, energy, retail, and smart cities. By leveraging AI, IoT, and high-resolution modeling, hyperlocal weather insights enhance operational efficiency, risk mitigation, and situational awareness in dynamic environments.
Market Dynamics:
Driver:
Rising demand for location-specific forecasts
The growing need for highly precise, location-specific weather intelligence is a key driver of the hyperlocal weather insights market. Industries such as agriculture, logistics, energy, and retail increasingly depend on micro-level forecasts to optimize operations and mitigate weather related risks. Urbanization and smart city initiatives further amplify demand for street level environmental visibility. As businesses seek real time situational awareness to improve planning accuracy and operational resilience, investments in hyperlocal forecasting platforms continue to expand across both enterprise and public sector applications.
Restraint:
High cost of dense sensor networks
The high cost associated with deploying and maintaining dense weather sensor networks remains a major restraint for market growth. Hyperlocal forecasting requires extensive infrastructure, including ground-based stations, connectivity systems, and data processing platforms, which significantly increases capital and operational expenditures. Smaller organizations and developing regions often face budget limitations that restrict large-scale implementation. Additionally, ongoing maintenance, calibration, and data management expenses further elevate total ownership costs, slowing widespread adoption.
Opportunity:
Advancements in AI and high-resolution modeling
Rapid advancements in artificial intelligence, machine learning, and high-resolution numerical weather modeling present significant growth opportunities for the market. Modern algorithms enable faster processing of massive environmental datasets and improve forecast precision at micro-geographic levels. AI-driven predictive capabilities also enhance anomaly detection and short-term nowcasting. As cloud computing and edge analytics mature, organizations can deploy scalable, cost-efficient hyperlocal solutions. These technological improvements are expected to unlock new commercial applications and accelerate adoption worldwide.
Threat:
Data accuracy and reliability challenges
Data accuracy and reliability issues pose a notable threat to the market. Micro-forecasting depends heavily on the density, calibration, and consistency of sensor inputs, which can vary widely across regions. Incomplete coverage, data latency, and environmental interference may reduce forecast precision. If insights are perceived as unreliable, enterprise users may hesitate to depend on hyperlocal systems for mission-critical decisions. Ensuring standardized data validation and continuous model refinement remains essential to sustaining market confidence and long term adoption.
Covid-19 Impact:
The COVID-19 pandemic had a mixed impact on the hyperlocal weather insights market. Initial disruptions in infrastructure deployment and capital spending slowed some projects. However, the pandemic accelerated digital transformation and data-driven decision-making across industries. Increased reliance on logistics optimization, supply chain visibility, and remote monitoring highlighted the value of precise environmental intelligence. As economies recovered, demand for advanced weather analytics strengthened, positioning the market for steady post-pandemic growth supported by broader adoption of AI and IoT technologies.
The big data analytics segment is expected to be the largest during the forecast period
The big data analytics segment is expected to account for the largest market share during the forecast period, due to its critical role in processing vast volumes of weather and environmental data generated by satellites, sensors, and connected devices. Organizations rely on advanced analytics platforms to transform raw data into actionable, real-time insights. The increasing integration of cloud computing, AI, and predictive modeling further strengthens this segment. Its ability to support scalable, high-speed data processing makes it central to the effectiveness of hyperlocal weather intelligence solutions.
The aviation segment is expected to have the highest CAGR during the forecast period
Over the forecast period, the aviation segment is predicted to witness the highest growth rate, due to sector’s strong dependence on precise, real-time weather intelligence for flight safety and operational efficiency. Airlines, airports, and air traffic management authorities increasingly use hyperlocal forecasts to manage turbulence, runway conditions, and routing decisions. Growing air traffic volumes and rising emphasis on predictive risk management are accelerating adoption. As aviation digitization advances, demand for highly granular weather insights is expected to expand rapidly within this segment.
Region with largest share:
During the forecast period, the North America region is expected to hold the largest market share, due to advanced meteorological infrastructure, strong presence of leading weather technology providers, and widespread adoption of AI-driven analytics. The region benefits from mature smart city initiatives, high IoT penetration, and significant investments in aviation and logistics optimization. Government agencies and private enterprises continue to prioritize high-resolution weather intelligence for risk mitigation. These factors collectively reinforce North America’s leadership position in the hyperlocal weather insights market.
Region with highest CAGR:
Over the forecast period, the Asia Pacific region is anticipated to exhibit the highest CAGR, owing to rapid urbanization, expanding smart city programs, and increasing climate variability across the region. Countries such as China, India, Japan, and Southeast Asian nations are investing heavily in digital infrastructure, IoT deployment, and advanced meteorological capabilities. Growing demand from agriculture, aviation, and disaster management sectors is further fueling market expansion. As digital ecosystems mature, Asia Pacific is poised to become the fastest-growing regional market for hyperlocal weather insights.

Key players in the market
Some of the key players in Hyperlocal Weather Insights Market include AccuWeather, The Weather Company (IBM), Tomorrow.io, DTN, Vaisala, Spire Global, StormGeo, MeteoGroup, Weathernews Inc., Earth Networks, OpenWeatherMap, Foreca, Baron Weather, WeatherBug and Meteomatics.
Key Developments:
In December 2025, Akamai and Zuplo partnered to modernize AccuWeather’s API delivery by integrating Akamai’s global edge infrastructure with Zuplo’s developer-focused gateway. The initiative reduces latency, improves reliability, strengthens security, and simplifies API management while enabling new monetization models and a streamlined developer experience.
In June 2025, AccuWeather and Perplexity, the initiative integrates trusted meteorological data with conversational AI, enabling millions of users to receive faster, context-aware weather insights, strengthening engagement and setting a standard for forecast delivery.
Components Covered:
• Solutions
• Services
Deployment Modes Covered:
• Cloud-Based
• On Premise
• Hybrid
Forecast Types Covered:
• Nowcasting
• Short Term Forecast
• Medium Term Forecast
• Long Term Forecast
Technologies Covered:
• Artificial Intelligence & Machine Learning
• Internet of Things (IoT) Sensors
• Satellite-Based Monitoring
• Radar-Based Systems
• Big Data Analytics
Applications Covered:
• Agriculture
• Transportation & Logistics
• Aviation
• Energy & Utilities
• Retail
• Construction
End Users Covered:
• Weather Service Providers
• Individuals/Consumers
• Media & Broadcasting
Regions Covered:
• North America
o United States
o Canada
o Mexico
• Europe
o United Kingdom
o Germany
o France
o Italy
o Spain
o Netherlands
o Belgium
o Sweden
o Switzerland
o Poland
o Rest of Europe
• Asia Pacific
o China
o Japan
o India
o South Korea
o Australia
o Indonesia
o Thailand
o Malaysia
o Singapore
o Vietnam
o Rest of Asia Pacific
• South America
o Brazil
o Argentina
o Colombia
o Chile
o Peru
o Rest of South America
• Rest of the World (RoW)
o Middle East
§ Saudi Arabia
§ United Arab Emirates
§ Qatar
§ Israel
§ Rest of Middle East
o Africa
§ South Africa
§ Egypt
§ Morocco
§ Rest of Africa
What our report offers:
- Market share assessments for the regional and country-level segments
- Strategic recommendations for the new entrants
- Covers Market data for the years 2023, 2024, 2025, 2026, 2027, 2028, 2030, 2032 and 2034
- Market Trends (Drivers, Constraints, Opportunities, Threats, Challenges, Investment Opportunities, and recommendations)
- Strategic recommendations in key business segments based on the market estimations
- Competitive landscaping mapping the key common trends
- Company profiling with detailed strategies, financials, and recent developments
- Supply chain trends mapping the latest technological advancements
Free Customization Offerings:
All the customers of this report will be entitled to receive one of the following free customization options:
• Company Profiling
o Comprehensive profiling of additional market players (up to 3)
o SWOT Analysis of key players (up to 3)
• Regional Segmentation
o Market estimations, Forecasts and CAGR of any prominent country as per the client's interest (Note: Depends on feasibility check)
• Competitive Benchmarking
o Benchmarking of key players based on product portfolio, geographical presence, and strategic alliances
Table of Contents
1 Executive Summary
1.1 Market Snapshot and Key Highlights
1.2 Growth Drivers, Challenges, and Opportunities
1.3 Competitive Landscape Overview
1.4 Strategic Insights and Recommendations
2 Research Framework
2.1 Study Objectives and Scope
2.2 Stakeholder Analysis
2.3 Research Assumptions and Limitations
2.4 Research Methodology
2.4.1 Data Collection (Primary and Secondary)
2.4.2 Data Modeling and Estimation Techniques
2.4.3 Data Validation and Triangulation
2.4.4 Analytical and Forecasting Approach
3 Market Dynamics and Trend Analysis
3.1 Market Definition and Structure
3.2 Key Market Drivers
3.3 Market Restraints and Challenges
3.4 Growth Opportunities and Investment Hotspots
3.5 Industry Threats and Risk Assessment
3.6 Technology and Innovation Landscape
3.7 Emerging and High-Growth Markets
3.8 Regulatory and Policy Environment
3.9 Impact of COVID-19 and Recovery Outlook
4 Competitive and Strategic Assessment
4.1 Porter's Five Forces Analysis
4.1.1 Supplier Bargaining Power
4.1.2 Buyer Bargaining Power
4.1.3 Threat of Substitutes
4.1.4 Threat of New Entrants
4.1.5 Competitive Rivalry
4.2 Market Share Analysis of Key Players
4.3 Product Benchmarking and Performance Comparison
5 Global Hyperlocal Weather Insights Market, By Component
5.1 Solutions
5.2 Services
6 Global Hyperlocal Weather Insights Market, By Deployment Mode
6.1 Cloud-Based
6.2 On Premise
6.3 Hybrid
7 Global Hyperlocal Weather Insights Market, By Forecast Type
7.1 Nowcasting
7.2 Short Term Forecast
7.3 Medium Term Forecast
7.4 Long Term Forecast
8 Global Hyperlocal Weather Insights Market, By Technology
8.1 Artificial Intelligence & Machine Learning
8.2 Internet of Things (IoT) Sensors
8.3 Satellite-Based Monitoring
8.4 Radar-Based Systems
8.5 Big Data Analytics
9 Global Hyperlocal Weather Insights Market, By Application
9.1 Agriculture
9.2 Transportation & Logistics
9.3 Aviation
9.4 Energy & Utilities
9.5 Retail
9.6 Construction
10 Global Hyperlocal Weather Insights Market, By End User
10.1 Weather Service Providers
10.2 Individuals/Consumers
10.3 Media & Broadcasting
11 Global Hyperlocal Weather Insights Market, By Geography
11.1 North America
11.1.1 United States
11.1.2 Canada
11.1.3 Mexico
11.2 Europe
11.2.1 United Kingdom
11.2.2 Germany
11.2.3 France
11.2.4 Italy
11.2.5 Spain
11.2.6 Netherlands
11.2.7 Belgium
11.2.8 Sweden
11.2.9 Switzerland
11.2.10 Poland
11.2.11 Rest of Europe
11.3 Asia Pacific
11.3.1 China
11.3.2 Japan
11.3.3 India
11.3.4 South Korea
11.3.5 Australia
11.3.6 Indonesia
11.3.7 Thailand
11.3.8 Malaysia
11.3.9 Singapore
11.3.10 Vietnam
11.3.11 Rest of Asia Pacific
11.4 South America
11.4.1 Brazil
11.4.2 Argentina
11.4.3 Colombia
11.4.4 Chile
11.4.5 Peru
11.4.6 Rest of South America
11.5 Rest of the World (RoW)
11.5.1 Middle East
11.5.1.1 Saudi Arabia
11.5.1.2 United Arab Emirates
11.5.1.3 Qatar
11.5.1.4 Israel
11.5.1.5 Rest of Middle East
11.5.2 Africa
11.5.2.1 South Africa
11.5.2.2 Egypt
11.5.2.3 Morocco
11.5.2.4 Rest of Africa
12 Strategic Market Intelligence
12.1 Industry Value Network and Supply Chain Assessment
12.2 White-Space and Opportunity Mapping
12.3 Product Evolution and Market Life Cycle Analysis
12.4 Channel, Distributor, and Go-to-Market Assessment
13 Industry Developments and Strategic Initiatives
13.1 Mergers and Acquisitions
13.2 Partnerships, Alliances, and Joint Ventures
13.3 New Product Launches and Certifications
13.4 Capacity Expansion and Investments
13.5 Other Strategic Initiatives
14 Company Profiles
14.1 AccuWeather
14.2 The Weather Company (IBM)
14.3 Tomorrow.io
14.4 DTN
14.5 Vaisala
14.6 Spire Global
14.7 StormGeo
14.8 MeteoGroup
14.9 Weathernews Inc.
14.10 Earth Networks
14.11 OpenWeatherMap
14.12 Foreca
14.13 Baron Weather
14.14 WeatherBug
14.15 Meteomatics
List of Tables
1 Global Hyperlocal Weather Insights Market Outlook, By Region (2023-2034) ($MN)
2 Global Hyperlocal Weather Insights Market Outlook, By Component (2023-2034) ($MN)
3 Global Hyperlocal Weather Insights Market Outlook, By Solutions (2023-2034) ($MN)
4 Global Hyperlocal Weather Insights Market Outlook, By Services (2023-2034) ($MN)
5 Global Hyperlocal Weather Insights Market Outlook, By Deployment Mode (2023-2034) ($MN)
6 Global Hyperlocal Weather Insights Market Outlook, By Cloud-Based (2023-2034) ($MN)
7 Global Hyperlocal Weather Insights Market Outlook, By On Premise (2023-2034) ($MN)
8 Global Hyperlocal Weather Insights Market Outlook, By Hybrid (2023-2034) ($MN)
9 Global Hyperlocal Weather Insights Market Outlook, By Forecast Type (2023-2034) ($MN)
10 Global Hyperlocal Weather Insights Market Outlook, By Nowcasting (2023-2034) ($MN)
11 Global Hyperlocal Weather Insights Market Outlook, By Short Term Forecast (2023-2034) ($MN)
12 Global Hyperlocal Weather Insights Market Outlook, By Medium Term Forecast (2023-2034) ($MN)
13 Global Hyperlocal Weather Insights Market Outlook, By Long Term Forecast (2023-2034) ($MN)
14 Global Hyperlocal Weather Insights Market Outlook, By Technology (2023-2034) ($MN)
15 Global Hyperlocal Weather Insights Market Outlook, By Artificial Intelligence & Machine Learning (2023-2034) ($MN)
16 Global Hyperlocal Weather Insights Market Outlook, By Internet of Things (IoT) Sensors (2023-2034) ($MN)
17 Global Hyperlocal Weather Insights Market Outlook, By Satellite-Based Monitoring (2023-2034) ($MN)
18 Global Hyperlocal Weather Insights Market Outlook, By Radar-Based Systems (2023-2034) ($MN)
19 Global Hyperlocal Weather Insights Market Outlook, By Big Data Analytics (2023-2034) ($MN)
20 Global Hyperlocal Weather Insights Market Outlook, By Application (2023-2034) ($MN)
21 Global Hyperlocal Weather Insights Market Outlook, By Agriculture (2023-2034) ($MN)
22 Global Hyperlocal Weather Insights Market Outlook, By Transportation & Logistics (2023-2034) ($MN)
23 Global Hyperlocal Weather Insights Market Outlook, By Aviation (2023-2034) ($MN)
24 Global Hyperlocal Weather Insights Market Outlook, By Energy & Utilities (2023-2034) ($MN)
25 Global Hyperlocal Weather Insights Market Outlook, By Retail (2023-2034) ($MN)
26 Global Hyperlocal Weather Insights Market Outlook, By Construction (2023-2034) ($MN)
27 Global Hyperlocal Weather Insights Market Outlook, By End User (2023-2034) ($MN)
28 Global Hyperlocal Weather Insights Market Outlook, By Weather Service Providers (2023-2034) ($MN)
29 Global Hyperlocal Weather Insights Market Outlook, By Individuals/Consumers (2023-2034) ($MN)
30 Global Hyperlocal Weather Insights Market Outlook, By Media & Broadcasting (2023-2034) ($MN)
Note: Tables for North America, Europe, APAC, South America, and Rest of the World (RoW) Regions are also represented in the same manner as above.
List of Figures
RESEARCH METHODOLOGY

We at ‘Stratistics’ opt for an extensive research approach which involves data mining, data validation, and data analysis. The various research sources include in-house repository, secondary research, competitor’s sources, social media research, client internal data, and primary research.
Our team of analysts prefers the most reliable and authenticated data sources in order to perform the comprehensive literature search. With access to most of the authenticated data bases our team highly considers the best mix of information through various sources to obtain extensive and accurate analysis.
Each report takes an average time of a month and a team of 4 industry analysts. The time may vary depending on the scope and data availability of the desired market report. The various parameters used in the market assessment are standardized in order to enhance the data accuracy.
Data Mining
The data is collected from several authenticated, reliable, paid and unpaid sources and is filtered depending on the scope & objective of the research. Our reports repository acts as an added advantage in this procedure. Data gathering from the raw material suppliers, distributors and the manufacturers is performed on a regular basis, this helps in the comprehensive understanding of the products value chain. Apart from the above mentioned sources the data is also collected from the industry consultants to ensure the objective of the study is in the right direction.
Market trends such as technological advancements, regulatory affairs, market dynamics (Drivers, Restraints, Opportunities and Challenges) are obtained from scientific journals, market related national & international associations and organizations.
Data Analysis
From the data that is collected depending on the scope & objective of the research the data is subjected for the analysis. The critical steps that we follow for the data analysis include:
- Product Lifecycle Analysis
- Competitor analysis
- Risk analysis
- Porters Analysis
- PESTEL Analysis
- SWOT Analysis
The data engineering is performed by the core industry experts considering both the Marketing Mix Modeling and the Demand Forecasting. The marketing mix modeling makes use of multiple-regression techniques to predict the optimal mix of marketing variables. Regression factor is based on a number of variables and how they relate to an outcome such as sales or profits.
Data Validation
The data validation is performed by the exhaustive primary research from the expert interviews. This includes telephonic interviews, focus groups, face to face interviews, and questionnaires to validate our research from all aspects. The industry experts we approach come from the leading firms, involved in the supply chain ranging from the suppliers, distributors to the manufacturers and consumers so as to ensure an unbiased analysis.
We are in touch with more than 15,000 industry experts with the right mix of consultants, CEO's, presidents, vice presidents, managers, experts from both supply side and demand side, executives and so on.
The data validation involves the primary research from the industry experts belonging to:
- Leading Companies
- Suppliers & Distributors
- Manufacturers
- Consumers
- Industry/Strategic Consultants
Apart from the data validation the primary research also helps in performing the fill gap research, i.e. providing solutions for the unmet needs of the research which helps in enhancing the reports quality.
For more details about research methodology, kindly write to us at info@strategymrc.com
Frequently Asked Questions
In case of any queries regarding this report, you can contact the customer service by filing the “Inquiry Before Buy” form available on the right hand side. You may also contact us through email: info@strategymrc.com or phone: +1-301-202-5929
Yes, the samples are available for all the published reports. You can request them by filling the “Request Sample” option available in this page.
Yes, you can request a sample with your specific requirements. All the customized samples will be provided as per the requirement with the real data masked.
All our reports are available in Digital PDF format. In case if you require them in any other formats, such as PPT, Excel etc you can submit a request through “Inquiry Before Buy” form available on the right hand side. You may also contact us through email: info@strategymrc.com or phone: +1-301-202-5929
We offer a free 15% customization with every purchase. This requirement can be fulfilled for both pre and post sale. You may send your customization requirements through email at info@strategymrc.com or call us on +1-301-202-5929.
We have 3 different licensing options available in electronic format.
- Single User Licence: Allows one person, typically the buyer, to have access to the ordered product. The ordered product cannot be distributed to anyone else.
- 2-5 User Licence: Allows the ordered product to be shared among a maximum of 5 people within your organisation.
- Corporate License: Allows the product to be shared among all employees of your organisation regardless of their geographical location.
All our reports are typically be emailed to you as an attachment.
To order any available report you need to register on our website. The payment can be made either through CCAvenue or PayPal payments gateways which accept all international cards.
We extend our support to 6 months post sale. A post sale customization is also provided to cover your unmet needs in the report.
Request Customization
We offer complimentary customization of up to 15% with every purchase. To share your customization requirements, feel free to email us at info@strategymrc.com or call us on +1-301-202-5929. .
Please Note: Customization within the 15% threshold is entirely free of charge. If your request exceeds this limit, we will conduct a feasibility assessment. Following that, a detailed quote and timeline will be provided.
WHY CHOOSE US ?

Assured Quality
Best in class reports with high standard of research integrity

24X7 Research Support
Continuous support to ensure the best customer experience.

Free Customization
Adding more values to your product of interest.

Safe & Secure Access
Providing a secured environment for all online transactions.

Trusted by 600+ Brands
Serving the most reputed brands across the world.