
Inorganic Salts Market
Inorganic Salts Market Forecasts to 2028 – Global Analysis By Type (Ammonium Salts, Calcium Salts, Magnesium Salts), Form Crystals, Powder, Pellets ) and By Geography

|
Years Covered |
2020-2028 |
|
Estimated Year Value (2021) |
US $98.74 BN |
|
Projected Year Value (2028) |
US $159.60 BN |
|
CAGR (2021 - 2028) |
7.1% |
|
Regions Covered |
North America, Europe, Asia Pacific, South America, and Middle East & Africa |
|
Countries Covered |
US, Canada, Mexico, Germany, UK, Italy, France, Spain, Japan, China, India, Australia, New Zealand, South Korea, Rest of Asia Pacific, South America, Argentina, Brazil, Chile, Middle East & Africa, Saudi Arabia, UAE, Qatar, and South Africa |
|
Largest Market |
Asia Pacific |
|
Fastest Growing Market |
North America |
According to Stratistics MRC, the Global Inorganic Salts Market is accounted for $98.74 billion in 2021 and is expected to reach $159.60 billion by 2028 growing at a CAGR of 7.1% during the forecast period. Inorganic salt is necessary for human and animal nutrition. These salts can be found as ions in biological fluids. Inorganic salts are necessary for transmission of electrical impulses across cell membranes and other cells, hence they must be used. Nerve impulses, heart functions, and muscle contraction are all controlled by ions in inorganic salts.
Market Dynamics:
Driver:
Increasing demand of nutritional supplements
When the epidemic hit, people were restricted to their homes. In the first stages of the Covid- 19 contagion, infection rates soared and numerous people were affected by the virus, hospitals were over volume leading to the doctors and governments asking people with mild symptoms to quarantine at home. Vitamin C and zinc were suggested as it aid in decreasing the period of symptoms in patients diagnosed with coronavirus disease. Owing to the pandemic, the sales of vitamins and other supplements skyrocketed thereby acting as a driver for the market.
Restraint:
Adverse health effects
The toxic components in these salts are a restraint of the market. It has limited toxic materials such as Alkyl, chloroform and fluro carbons found in these salts. Owing to this, the use of these salts is restricted in several industries. The food market and construction market may decrease the acceptance rate. However, the toxic amount is at lesser levels which can affect the growth rate of the market.
Opportunity:
Rising demand in rubber industry
The use of these salts in the rubber industry will create plenty of growth opportunities. It has immense demand in the rubber industry. Particularly, the inorganic salts have a high need during the rubber vulcanization process. The diffusion of the rubber industry in several provinces is having a positive impact on this market. Rubber is used for numerous purposes across the globe. The manufacturing facility of the rubber is growing fast. This growth will have a positive effect on the overall market.
Threat:
High cost
The high cost of raw material and obtainability is reasons that affect the demand. The raw material prices keep fluctuating in the market. This is distressing the production of inorganic salts. Moreover, the market will require more time to improve its supply networks after pandemic. All these market limitations may hinder the growth and demand rate.
Sodium Salts segment is expected to be the largest during the forecast period
Sodium Salts segment is expected to dominate during the forecast period, owing to their wide range of applications across numerous industries. Large amounts of sodium chloride are employed in the production of other industrial chemicals as well as being used directly for ice and snow removal, water conditioning, and its use to manufacturing chlorine. Pharmaceutical substances are often converted into sodium salts because they are more stable and more soluble or bioavailable. Sodium salts of long-chain sulfonic acids are used in shampoos and toothpaste. Sodium nitrate is used as a nitrogen fertilizer and as a component of dynamic.
The Powder segment is expected to have the highest CAGR during the forecast period
The powder segment held the highest share CAGR in the market, as most of the inorganic salts are available in powder form which makes it ready to use as it is and the powder form readily dissolves in water. Inorganic salts separate in solutions into ions (or electrolytes). Inorganic salts are used in daily life, for instance, common salt (sodium chloride), baking powder (sodium bicarbonate), and calcium carbonate as a dietary source for calcium.
Region with highest share:
The Asia Pacific is projected to hold the highest market. The developing economies in Asia-Pacific are predictable to experience significant demand for inorganic salts as a result of the growth of the applications, owing to speedy economic development and urbanization. Moreover, the use of fertilizers in the agriculture industry is high. These are the reasons that drive demand for the market. There are China, India, Malaysia, and Thailand the industries having growth of agrochemicals.
Region with highest CAGR:
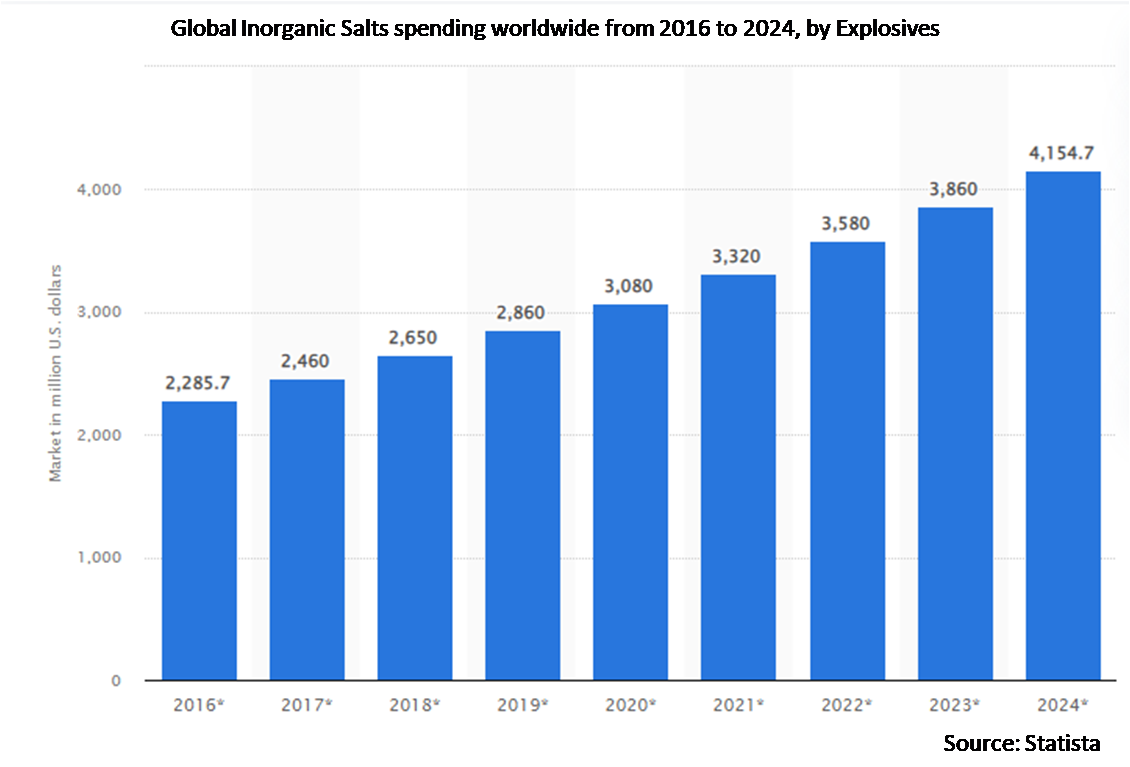
North America is projected to have the highest CAGR, due to the growing acceptance of salts comprising nitrates. These salts are used in developing explosives and ammunition. Moreover, increasing the implementation of fertilizers to boost farm yield is forecast to influence market growth. The rising adoption of the product that comprises nitrates, mostly for ammunition and explosives manufacturing, is predictable to boost the province’s market growth.

Key players in the market:
Some of the key players profiled in the Inorganic Salts Market include Arkema, BEHN MEYER, Eastman Chemical Company , Emerald Performance Materials, GFS Chemicals, Inc., Hunter Chemical, LLC, Laxness, Lenntech, LobaChemie Pvt. Ltd, Merck KGaA, Otsuka Chemical Co., Ltd, Pro Chem, Inc, Thermo Fisher Scientific Inc, Chevron.
Key developments:
In August 2021: LANXESS AG acquiredof Emerald Kalama Chemical. Through this acquisition, LANXESS expand its product portfolio to the consumer care sector including personal care products, cosmetics and exclusive fragrances, but also those found in food and beverages.
In April 2021: Chevron announced that it inaugurated an alkylation unit at its Salt Lake City refinery, setting a landmark for the industrialization of ionic liquids. The unit utilizes an ionic liquid catalyst as an alternative to the conventional hydrofluoric or sulfuric acid.
In April 2020: GFS Chemicals Inc. launched a corporate profile page and its newly redesigned e-commerce website corporate profiles pages. GFS Chemicals' new site provides information on the third-generation, privately owned, U.S.-based Fine Chemical manufacturing company located in Columbus, Ohio. The new website promotes the unique products and capabilities of the company's three strategic business divisions.
Types Covered:
• Ammonium Salts
• Calcium Salts
• Magnesium Salts
• Potassium Salts
• Sodium Salts
Forms Covered:
• Crystals
• Powder
• Pellets
Applications Covered:
• Catalysts
• Reagents
• Food Additives
• Pigments
End Users Covered:
• Agriculture
• Food Industry
• Pharmaceuticals
• Chemical
• Explosives
• Paints and Coatings
• Cosmetic and Personal Care
Regions Covered:
• North America
o US
o Canada
o Mexico
• Europe
o Germany
o UK
o Italy
o France
o Spain
o Rest of Europe
• Asia Pacific
o Japan
o China
o India
o Australia
o New Zealand
o South Korea
o Rest of Asia Pacific
• South America
o Argentina
o Brazil
o Chile
o Rest of South America
• Middle East & Africa
o Saudi Arabia
o UAE
o Qatar
o South Africa
o Rest of Middle East & Africa
What our report offers:
- Market share assessments for the regional and country-level segments
- Strategic recommendations for the new entrants
- Covers Market data for the years 2020, 2021, 2022, 2025 and 2028
- Market Trends (Drivers, Constraints, Opportunities, Threats, Challenges, Investment Opportunities, and recommendations)
- Strategic recommendations in key business segments based on the market estimations
- Competitive landscaping mapping the key common trends
- Company profiling with detailed strategies, financials, and recent developments
- Supply chain trends mapping the latest technological advancements
Free Customization Offerings:
All the customers of this report will be entitled to receive one of the following free customization options:
• Company Profiling
o Comprehensive profiling of additional market players (up to 3)
o SWOT Analysis of key players (up to 3)
• Regional Segmentation
o Market estimations, Forecasts and CAGR of any prominent country as per the client's interest (Note: Depends on feasibility check)
• Competitive Benchmarking
o Benchmarking of key players based on product portfolio, geographical presence, and strategic alliances
Table of Contents
1 Executive Summary
2 Preface
2.1 Abstract
2.2 Stake Holders
2.3 Research Scope
2.4 Research Methodology
2.4.1 Data Mining
2.4.2 Data Analysis
2.4.3 Data Validation
2.4.4 Research Approach
2.5 Research Sources
2.5.1 Primary Research Sources
2.5.2 Secondary Research Sources
2.5.3 Assumptions
3 Market Trend Analysis
3.1 Introduction
3.2 Drivers
3.3 Restraints
3.4 Opportunities
3.5 Threats
3.6 Application Analysis
3.7 End User Analysis
3.8 Emerging Markets
3.9 Impact of Covid-19
4 Porters Five Force Analysis
4.1 Bargaining power of suppliers
4.2 Bargaining power of buyers
4.3 Threat of substitutes
4.4 Threat of new entrants
4.5 Competitive rivalry
5 Global Inorganic Salts Market, By Type
5.1 Introduction
5.2 Ammonium Salts
5.3 Calcium Salts
5.4 Magnesium Salts
5.5 Potassium Salts
5.6 Sodium Salts
6 Global Inorganic Salts Market, By Form
6.1 Introduction
6.2 Crystals
6.3 Powder
6.4 Pellets
7 Global Inorganic Salts Market, By Application
7.1 Introduction
7.2 Catalysts
7.3 Reagents
7.4 Food Additives
7.5 Pigments
8 Global Inorganic Salts Market, By End User
8.1 Introduction
8.2 Agriculture
8.2.1 Fertilizers
8.2.2 Pesticides
8.2.3 Soil Treatment
8.3 Food Industry
8.3.1 Flavourants
8.3.2 Colour Enhancers
8.3.3 Rising Agents
8.3.4 Preservatives
8.4 Pharmaceuticals
8.4.1 Supplements
8.4.2 Therapeutics
8.4.2.1 Astringents
8.4.2.2 Antimicrobials
8.4.2.3 Antacid
8.4.3 Electrolytes
8.4.4 Intravenous Fluids (I.V) Fluid
8.5 Chemical
8.6 Explosives
8.7 Paints and Coatings
8.8 Cosmetic and Personal Care
8.8.1 Skin Care
8.8.1.1 Creams
8.8.1.2 Lotions
8.8.1.3 Sunscreen
8.8.2 Hair Care
8.8.2.1 Conditioners
8.8.2.2 Hair Colour
8.8.2.3 Shampoos
8.8.3 Make Up
8.8.4 Personal Care
8.8.4.1 Soaps
8.8.4.2 Oral Hygiene
8.8.4.3 Deodorants
9 Global Inorganic Salts Market, By Geography
9.1 Introduction
9.2 North America
9.2.1 US
9.2.2 Canada
9.2.3 Mexico
9.3 Europe
9.3.1 Germany
9.3.2 UK
9.3.3 Italy
9.3.4 France
9.3.5 Spain
9.3.6 Rest of Europe
9.4 Asia Pacific
9.4.1 Japan
9.4.2 China
9.4.3 India
9.4.4 Australia
9.4.5 New Zealand
9.4.6 South Korea
9.4.7 Rest of Asia Pacific
9.5 South America
9.5.1 Argentina
9.5.2 Brazil
9.5.3 Chile
9.5.4 Rest of South America
9.6 Middle East & Africa
9.6.1 Saudi Arabia
9.6.2 UAE
9.6.3 Qatar
9.6.4 South Africa
9.6.5 Rest of Middle East & Africa
10 Key Developments
10.1 Agreements, Partnerships, Collaborations and Joint Ventures
10.2 Acquisitions & Mergers
10.3 New Product Launch
10.4 Expansions
10.5 Other Key Strategies
11 Company Profiling
11.1 Arkema
11.2 BEHN MEYER
11.3 Eastman Chemical Company
11.4 Emerald Performance Materials
11.5 GFS Chemicals, Inc.
11.6 Hunter Chemical, LLC
11.7 Laxness
11.8 Lenntech
11.9 LobaChemie Pvt. Ltd
11.10 Merck KGaA
11.11 Otsuka Chemical Co., Ltd
11.12 Pro Chem, Inc
11.13 Thermo Fisher Scientific Inc
11.14 Chevron
List of Tables
1 Global Inorganic Salts Market Outlook, By Region (2020-2028) (US $MN)
2 Global Inorganic Salts Market Outlook, By Type (2020-2028) (US $MN)
3 Global Inorganic Salts Market Outlook, By Ammonium Salts (2020-2028) (US $MN)
4 Global Inorganic Salts Market Outlook, By Calcium Salts (2020-2028) (US $MN)
5 Global Inorganic Salts Market Outlook, By Magnesium Salts (2020-2028) (US $MN)
6 Global Inorganic Salts Market Outlook, By Potassium Salts (2020-2028) (US $MN)
7 Global Inorganic Salts Market Outlook, By Sodium Salts (2020-2028) (US $MN)
8 Global Inorganic Salts Market Outlook, By Form (2020-2028) (US $MN)
9 Global Inorganic Salts Market Outlook, By Crystals (2020-2028) (US $MN)
10 Global Inorganic Salts Market Outlook, By Powder (2020-2028) (US $MN)
11 Global Inorganic Salts Market Outlook, By Pellets (2020-2028) (US $MN)
12 Global Inorganic Salts Market Outlook, By Application (2020-2028) (US $MN)
13 Global Inorganic Salts Market Outlook, By Catalysts (2020-2028) (US $MN)
14 Global Inorganic Salts Market Outlook, By Reagents (2020-2028) (US $MN)
15 Global Inorganic Salts Market Outlook, By Food Additives (2020-2028) (US $MN)
16 Global Inorganic Salts Market Outlook, By Pigments (2020-2028) (US $MN)
17 Global Inorganic Salts Market Outlook, By End User (2020-2028) (US $MN)
18 Global Inorganic Salts Market Outlook, By Agriculture (2020-2028) (US $MN)
19 Global Inorganic Salts Market Outlook, By Fertilizers (2020-2028) (US $MN)
20 Global Inorganic Salts Market Outlook, By Pesticides (2020-2028) (US $MN)
21 Global Inorganic Salts Market Outlook, By Soil Treatment (2020-2028) (US $MN)
22 Global Inorganic Salts Market Outlook, By Food Industry (2020-2028) (US $MN)
23 Global Inorganic Salts Market Outlook, By Flavourants (2020-2028) (US $MN)
24 Global Inorganic Salts Market Outlook, By Colour Enhancers (2020-2028) (US $MN)
25 Global Inorganic Salts Market Outlook, By Rising Agents (2020-2028) (US $MN)
26 Global Inorganic Salts Market Outlook, By Preservatives (2020-2028) (US $MN)
27 Global Inorganic Salts Market Outlook, By Pharmaceuticals (2020-2028) (US $MN)
28 Global Inorganic Salts Market Outlook, By Supplements (2020-2028) (US $MN)
29 Global Inorganic Salts Market Outlook, By Therapeutics (2020-2028) (US $MN)
30 Global Inorganic Salts Market Outlook, By Electrolytes (2020-2028) (US $MN)
31 Global Inorganic Salts Market Outlook, By Intravenous Fluids (I.V) Fluid (2020-2028) (US $MN)
32 Global Inorganic Salts Market Outlook, By Chemical (2020-2028) (US $MN)
33 Global Inorganic Salts Market Outlook, By Explosives (2020-2028) (US $MN)
34 Global Inorganic Salts Market Outlook, By Paints and Coatings (2020-2028) (US $MN)
35 Global Inorganic Salts Market Outlook, By Cosmetic and Personal Care (2020-2028) (US $MN)
36 Global Inorganic Salts Market Outlook, By Skin Care (2020-2028) (US $MN)
Note- Tables for North America, Europe, APAC, South America, and Middle East & Africa Regions are also represented in the same manner as above.
List of Figures
RESEARCH METHODOLOGY

We at ‘Stratistics’ opt for an extensive research approach which involves data mining, data validation, and data analysis. The various research sources include in-house repository, secondary research, competitor’s sources, social media research, client internal data, and primary research.
Our team of analysts prefers the most reliable and authenticated data sources in order to perform the comprehensive literature search. With access to most of the authenticated data bases our team highly considers the best mix of information through various sources to obtain extensive and accurate analysis.
Each report takes an average time of a month and a team of 4 industry analysts. The time may vary depending on the scope and data availability of the desired market report. The various parameters used in the market assessment are standardized in order to enhance the data accuracy.
Data Mining
The data is collected from several authenticated, reliable, paid and unpaid sources and is filtered depending on the scope & objective of the research. Our reports repository acts as an added advantage in this procedure. Data gathering from the raw material suppliers, distributors and the manufacturers is performed on a regular basis, this helps in the comprehensive understanding of the products value chain. Apart from the above mentioned sources the data is also collected from the industry consultants to ensure the objective of the study is in the right direction.
Market trends such as technological advancements, regulatory affairs, market dynamics (Drivers, Restraints, Opportunities and Challenges) are obtained from scientific journals, market related national & international associations and organizations.
Data Analysis
From the data that is collected depending on the scope & objective of the research the data is subjected for the analysis. The critical steps that we follow for the data analysis include:
- Product Lifecycle Analysis
- Competitor analysis
- Risk analysis
- Porters Analysis
- PESTEL Analysis
- SWOT Analysis
The data engineering is performed by the core industry experts considering both the Marketing Mix Modeling and the Demand Forecasting. The marketing mix modeling makes use of multiple-regression techniques to predict the optimal mix of marketing variables. Regression factor is based on a number of variables and how they relate to an outcome such as sales or profits.
Data Validation
The data validation is performed by the exhaustive primary research from the expert interviews. This includes telephonic interviews, focus groups, face to face interviews, and questionnaires to validate our research from all aspects. The industry experts we approach come from the leading firms, involved in the supply chain ranging from the suppliers, distributors to the manufacturers and consumers so as to ensure an unbiased analysis.
We are in touch with more than 15,000 industry experts with the right mix of consultants, CEO's, presidents, vice presidents, managers, experts from both supply side and demand side, executives and so on.
The data validation involves the primary research from the industry experts belonging to:
- Leading Companies
- Suppliers & Distributors
- Manufacturers
- Consumers
- Industry/Strategic Consultants
Apart from the data validation the primary research also helps in performing the fill gap research, i.e. providing solutions for the unmet needs of the research which helps in enhancing the reports quality.
For more details about research methodology, kindly write to us at info@strategymrc.com
Frequently Asked Questions
In case of any queries regarding this report, you can contact the customer service by filing the “Inquiry Before Buy” form available on the right hand side. You may also contact us through email: info@strategymrc.com or phone: +1-301-202-5929
Yes, the samples are available for all the published reports. You can request them by filling the “Request Sample” option available in this page.
Yes, you can request a sample with your specific requirements. All the customized samples will be provided as per the requirement with the real data masked.
All our reports are available in Digital PDF format. In case if you require them in any other formats, such as PPT, Excel etc you can submit a request through “Inquiry Before Buy” form available on the right hand side. You may also contact us through email: info@strategymrc.com or phone: +1-301-202-5929
We offer a free 15% customization with every purchase. This requirement can be fulfilled for both pre and post sale. You may send your customization requirements through email at info@strategymrc.com or call us on +1-301-202-5929.
We have 3 different licensing options available in electronic format.
- Single User Licence: Allows one person, typically the buyer, to have access to the ordered product. The ordered product cannot be distributed to anyone else.
- 2-5 User Licence: Allows the ordered product to be shared among a maximum of 5 people within your organisation.
- Corporate License: Allows the product to be shared among all employees of your organisation regardless of their geographical location.
All our reports are typically be emailed to you as an attachment.
To order any available report you need to register on our website. The payment can be made either through CCAvenue or PayPal payments gateways which accept all international cards.
We extend our support to 6 months post sale. A post sale customization is also provided to cover your unmet needs in the report.
Request Customization
We offer complimentary customization of up to 15% with every purchase. To share your customization requirements, feel free to email us at info@strategymrc.com or call us on +1-301-202-5929. .
Please Note: Customization within the 15% threshold is entirely free of charge. If your request exceeds this limit, we will conduct a feasibility assessment. Following that, a detailed quote and timeline will be provided.
WHY CHOOSE US ?

Assured Quality
Best in class reports with high standard of research integrity

24X7 Research Support
Continuous support to ensure the best customer experience.

Free Customization
Adding more values to your product of interest.

Safe & Secure Access
Providing a secured environment for all online transactions.

Trusted by 600+ Brands
Serving the most reputed brands across the world.