
Intelligent Vehicle Networking Systems Market
Intelligent Vehicle Networking Systems Market Forecasts to 2034 - Global Analysis By Vehicle Type (Passenger Vehicles, Light Commercial Vehicles and Heavy Commercial Vehicles), Component, Technology, Application and By Geography

|
Years Covered |
2023-2034 |
|
Estimated Year Value (2026) |
US $2.13 BN |
|
Projected Year Value (2034) |
US $4.26 BN |
|
CAGR (2026-2034) |
9.0% |
|
Regions Covered |
North America, Europe, Asia Pacific, South America, and Rest of the World (RoW) |
|
Countries Covered |
United States, Canada, Mexico, United Kingdom, Germany, France, Italy, Spain, Netherlands, Belgium, Sweden, Switzerland, Poland, Rest of Europe, China, Japan, India, South Korea, Australia, Indonesia, Thailand, Malaysia, Singapore, Vietnam, Rest of Asia Pacific, Brazil, Argentina, Colombia, Chile, Peru, Rest of South America, Saudi Arabia, United Arab Emirates, Qatar, Israel, Rest of Middle East, South Africa, Egypt, Morocco, and Rest of Africa. |
|
Largest Market |
North America |
|
Highest Growing Market |
Asia Pacific |
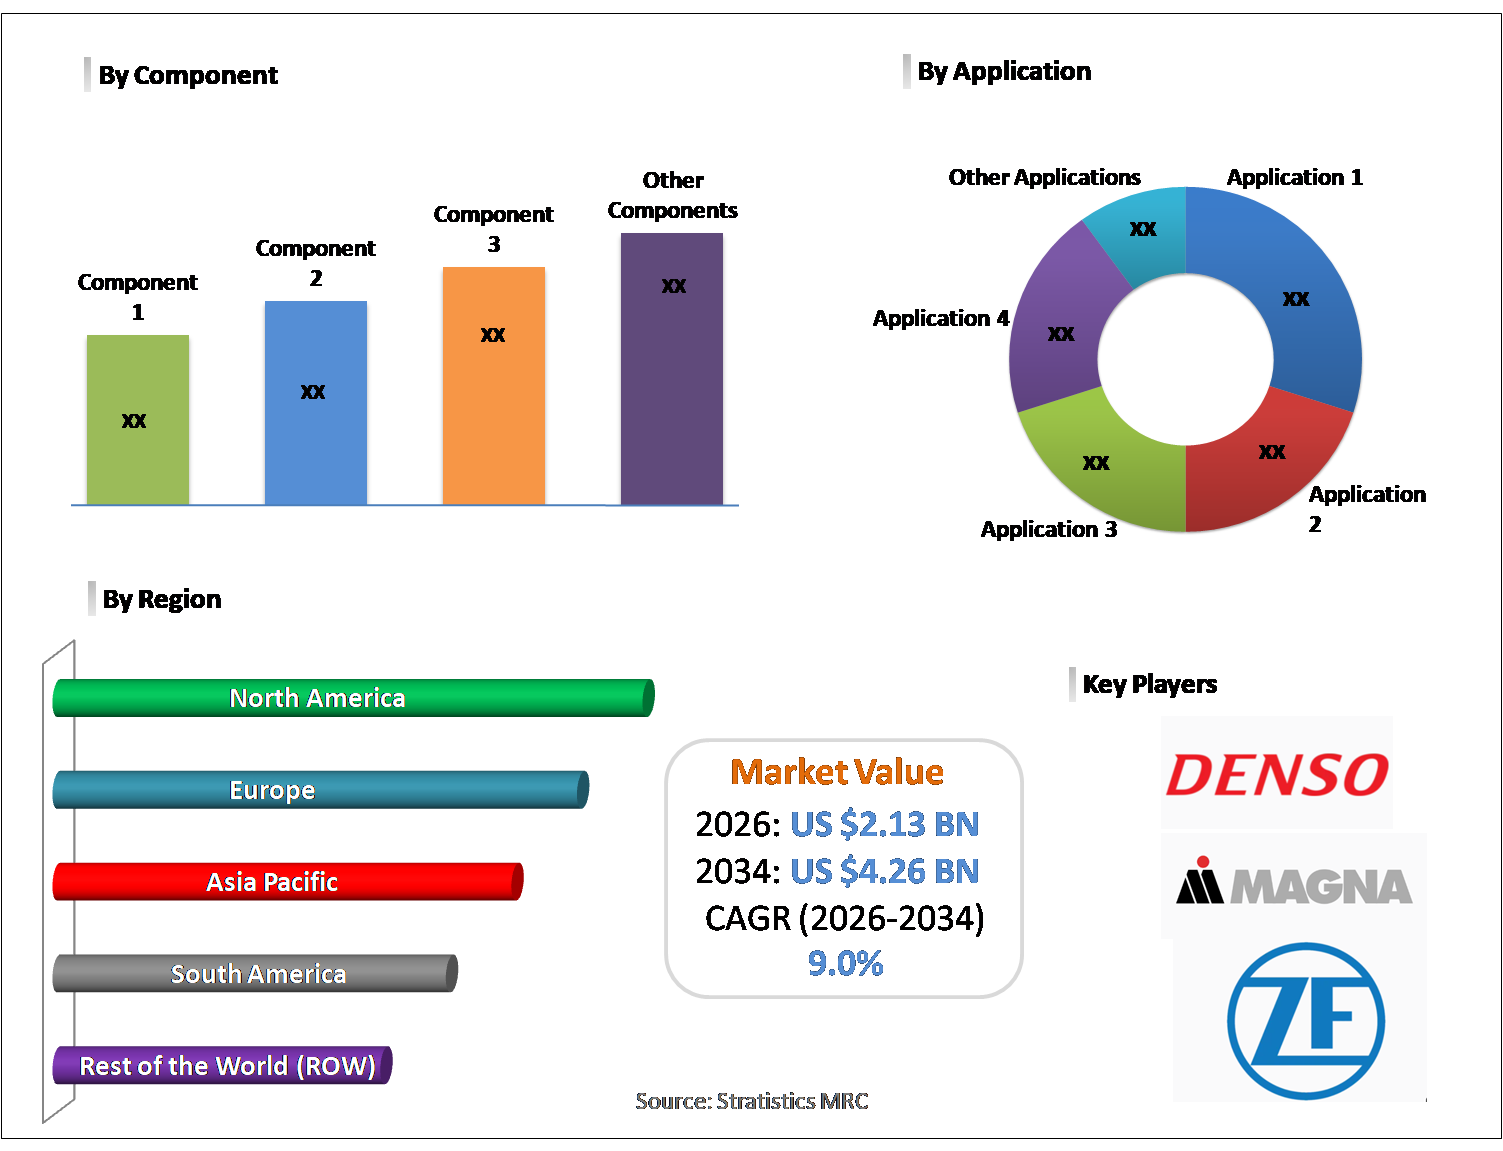
According to Stratistics MRC, the Global Intelligent Vehicle Networking Systems Market is accounted for $2.13 billion in 2026 and is expected to reach $4.26 billion by 2034 growing at a CAGR of 9.0% during the forecast period. Intelligent Vehicle Networking Systems (IVNS) are revolutionizing transportation by connecting vehicles through advanced communication frameworks for continuous data sharing. These systems enable interactions between vehicles (V2V) and with infrastructure (V2I), improving safety, traffic management, and autonomous driving performance. Using sensors, AI, and IoT technologies, IVNS can forecast traffic patterns, avoid accidents, and enhance route efficiency. They also contribute to smart city development by providing integrated urban mobility solutions. Broad implementation of IVNS can decrease traffic congestion, reduce environmental impact, and create a more reliable, efficient, and interconnected transportation network, paving the way for a smarter, safer travel experience.
According to McKinsey & Company (Automotive Software & Electronics Report), connected car technologies—including vehicle networking systems—could generate up to $310 billion in annual revenue by 2030, driven by data-enabled services, predictive maintenance, and mobility platforms. This underscores the economic scale of IVNS adoption.
Market Dynamics:
Driver:
Growing demand for road safety solutions
Increasing concerns over road accidents and fatalities are driving the adoption of Intelligent Vehicle Networking Systems. These systems provide collision alerts, predictive monitoring, and real-time interventions, improving overall road safety. Regulatory mandates and safety-focused investments from automotive companies are boosting IVNS integration. Advanced driver assistance technologies combined with vehicle networking ensure timely preventive measures during critical scenarios. Consumers’ growing focus on vehicle safety further accelerates market demand. As governments and manufacturers prioritize accident reduction, the implementation of IVNS becomes a key strategy to enhance safety standards and reduce traffic-related injuries worldwide.
Restraint:
High implementation costs
Implementing Intelligent Vehicle Networking Systems demands considerable spending on advanced hardware, software, sensors, and connectivity infrastructure. High initial costs and ongoing maintenance pose challenges for automakers and fleet operators, particularly smaller companies. Integrating IVNS into existing vehicles increases overall investment, making adoption slower in price-sensitive regions. Although these systems improve safety and operational efficiency in the long run, the financial burden remains a significant obstacle. High implementation costs hinder the expansion of IVNS, limiting market penetration, and creating barriers for regions and organizations that cannot afford the necessary technological upgrades and continuous system management.
Opportunity:
Development of 5G and advanced communication networks
The expansion of 5G and advanced communication networks provides new growth avenues for IVNS. Fast, low-latency connectivity facilitates smooth vehicle-to-vehicle and vehicle-to-infrastructure communication, enhancing road safety, traffic flow, and autonomous vehicle operations. These networks support real-time analytics, cloud integration, and AI-enabled decision-making within vehicles. Global 5G deployment allows IVNS providers to introduce innovative applications, such as predictive traffic control, smart routing, and improved infotainment. Utilizing advanced connectivity can boost system reliability, efficiency, and adoption, offering significant opportunities for intelligent vehicle networking solutions in both urban and highway transportation networks.
Threat:
Rapid technological obsolescence
The rapid advancement of automotive technology, such as AI, sensors, and communication standards, can make existing IVNS systems obsolete quickly. Frequent upgrades are required, raising costs and complicating maintenance. Early adopters may encounter compatibility issues with newer vehicles or infrastructure, reducing efficiency and performance. This constant evolution may deter long-term investment and slow adoption rates. IVNS providers unable to keep pace with technological changes risk losing market share. Maintaining technological relevance is crucial, as the fast-moving automotive innovation landscape poses a continuous threat to the competitiveness and sustainability of intelligent vehicle networking solutions.
Covid-19 Impact:
The COVID-19 crisis significantly affected the Intelligent Vehicle Networking Systems market by disrupting production, supply chains, and vehicle sales worldwide. Lockdowns hindered the manufacturing of vehicles and essential networking hardware, delaying system deployment. Declines in consumer demand and fleet operations further slowed adoption. Conversely, the pandemic emphasized the value of connected and autonomous vehicle technologies for contactless travel, remote monitoring, and improved traffic management. With economic recovery underway, interest in IVNS is projected to rise, fueled by a focus on smart mobility, digital infrastructure, and resilient urban transportation systems, creating opportunities for renewed growth and long-term market expansion.
The passenger vehicles segment is expected to be the largest during the forecast period
The passenger vehicles segment is expected to account for the largest market share during the forecast period, driven by the increasing incorporation of connected and smart technologies in personal automobiles. Rising consumer interest in safety systems, real-time route guidance, infotainment, and V2X communication fuels growth in this segment. Automakers are embedding IVNS solutions into passenger cars to enhance driving experience, ensure safety, and meet regulatory requirements. Urban mobility demands and heightened awareness of vehicle connectivity advantages further support adoption. As a result, passenger vehicles remain the leading segment, reflecting the strong market preference for intelligent networking systems in personal transportation compared to commercial vehicle categories.
The automotive ethernet segment is expected to have the highest CAGR during the forecast period
Over the forecast period, the automotive ethernet segment is predicted to witness the highest growth rate, driven by its high-speed communication capabilities and compatibility with autonomous and ADAS technologies. Modern vehicles produce enormous volumes of data from cameras, sensors, and infotainment systems, requiring a dependable network infrastructure. Automotive Ethernet meets these demands by offering scalable, reliable, and real-time connectivity, outperforming conventional in-vehicle networks. The rising focus on connected and intelligent vehicles, along with the push for standardized networking solutions, is accelerating Automotive Ethernet adoption, positioning it as the segment with the highest growth potential in the IVNS market.
Region with largest share:
During the forecast period, the North America region is expected to hold the largest market share, supported by advanced automotive technology, strong infrastructure, and government initiatives promoting connected and autonomous vehicles. The region’s adoption of electric vehicles, smart transportation systems, and urban mobility projects contributes significantly to IVNS growth. Rising consumer demand for safety, connectivity, and infotainment features motivates automakers to implement these systems in passenger and commercial vehicles. Combined with active research and development, established automotive networks, and regulatory support, North America maintains a dominant position in the global IVNS market, reflecting both technological advancement and strong market acceptance of intelligent vehicle networking solutions.
Region with highest CAGR:
Over the forecast period, the Asia Pacific region is anticipated to exhibit the highest CAGR, driven by rapid urban development, increasing vehicle production, and rising adoption of connected and autonomous technologies. Smart city projects, advanced transport infrastructure, and digitalization initiatives are fueling IVNS implementation across the region. Growing consumer interest in vehicle safety, infotainment, and connectivity further boosts market expansion. Major automotive and technology companies are actively targeting Asia Pacific to capture emerging opportunities. Combined, these factors make the region the fastest-growing hub for intelligent vehicle networking systems, reflecting strong demand and rapid technological adoption.

Key players in the market
Some of the key players in Intelligent Vehicle Networking Systems Market include Bosch, DENSO, MAGNA, AISIN, ZF Friedrichshafen AG, AUTOLIV, BorgWarner, Mitsubishi Electric, NXP Semiconductors, Texas Instruments, Infineon Technologies, Continental, STMicroelectronics, Microchip Technology, Elmos Semiconductor, Analog Devices, Renesas Electronics and Aptiv.
Key Developments:
In December 2025, Denso Corporation and Delphy Groep BV have entered into a Joint Development Agreement, to advance technologies that support stable planned cultivation within data-driven smart horticulture systems. The agreement deepens the collaboration initiated under an April 2025 Memorandum of Understanding, with both companies now formally aligned on developing next-generation cultivation and prediction tools for greenhouse growers.
In December 2025, Mitsubishi Electric Corporation announced that it has invested in and signed a strategic alliance agreement with Tulip Interfaces, Inc., a Massachusetts, USA-based leader no-code platforms for system operations without programming to support manufacturing digitalization. Tulip Interfaces is also an expert in introducing manufacturing-targeted microservices, which divide large-scale systems into small, independent services to enable flexible development and operations.
In September 2025, Bosch and Alibaba Group announced an expanded strategic partnership to accelerate digital transformation through advanced cloud computing and AI technologies. The enhanced collaboration will focus on cloud-based enterprise operations, AI-driven business innovations, and e-commerce expansion.
Vehicle Types Covered:
• Passenger Vehicles
• Light Commercial Vehicles
• Heavy Commercial Vehicles
Components Covered:
• Transceivers
• Controllers & Gateways
• Software Platforms
• Hardware Modules
Technologies Covered:
• CAN (Controller Area Network)
• LIN (Local Interconnect Network)
• FlexRay
• Automotive Ethernet
• MOST (Media Oriented Systems Transport)
Applications Covered:
• Powertrain & Chassis Control
• Safety & ADAS (Advanced Driver Assistance Systems)
• Infotainment
• Telematics
• Body Electronics
• Connected Services
Regions Covered:
• North America
o United States
o Canada
o Mexico
• Europe
o United Kingdom
o Germany
o France
o Italy
o Spain
o Netherlands
o Belgium
o Sweden
o Switzerland
o Poland
o Rest of Europe
• Asia Pacific
o China
o Japan
o India
o South Korea
o Australia
o Indonesia
o Thailand
o Malaysia
o Singapore
o Vietnam
o Rest of Asia Pacific
• South America
o Brazil
o Argentina
o Colombia
o Chile
o Peru
o Rest of South America
• Rest of the World (RoW)
o Middle East
§ Saudi Arabia
§ United Arab Emirates
§ Qatar
§ Israel
§ Rest of Middle East
o Africa
§ South Africa
§ Egypt
§ Morocco
§ Rest of Africa
What our report offers:
- Market share assessments for the regional and country-level segments
- Strategic recommendations for the new entrants
- Covers Market data for the years 2023, 2024, 2025, 2026, 2027, 2028, 2030, 2032 and 2034
- Market Trends (Drivers, Constraints, Opportunities, Threats, Challenges, Investment Opportunities, and recommendations)
- Strategic recommendations in key business segments based on the market estimations
- Competitive landscaping mapping the key common trends
- Company profiling with detailed strategies, financials, and recent developments
- Supply chain trends mapping the latest technological advancements
Free Customization Offerings:
All the customers of this report will be entitled to receive one of the following free customization options:
• Company Profiling
o Comprehensive profiling of additional market players (up to 3)
o SWOT Analysis of key players (up to 3)
• Regional Segmentation
o Market estimations, Forecasts and CAGR of any prominent country as per the client's interest (Note: Depends on feasibility check)
• Competitive Benchmarking
o Benchmarking of key players based on product portfolio, geographical presence, and strategic alliances
Table of Contents
1 Executive Summary
1.1 Market Snapshot and Key Highlights
1.2 Growth Drivers, Challenges, and Opportunities
1.3 Competitive Landscape Overview
1.4 Strategic Insights and Recommendations
2 Research Framework
2.1 Study Objectives and Scope
2.2 Stakeholder Analysis
2.3 Research Assumptions and Limitations
2.4 Research Methodology
2.4.1 Data Collection (Primary and Secondary)
2.4.2 Data Modeling and Estimation Techniques
2.4.3 Data Validation and Triangulation
2.4.4 Analytical and Forecasting Approach
3 Market Dynamics and Trend Analysis
3.1 Market Definition and Structure
3.2 Key Market Drivers
3.3 Market Restraints and Challenges
3.4 Growth Opportunities and Investment Hotspots
3.5 Industry Threats and Risk Assessment
3.6 Technology and Innovation Landscape
3.7 Emerging and High-Growth Markets
3.8 Regulatory and Policy Environment
3.9 Impact of COVID-19 and Recovery Outlook
4 Competitive and Strategic Assessment
4.1 Porter's Five Forces Analysis
4.1.1 Supplier Bargaining Power
4.1.2 Buyer Bargaining Power
4.1.3 Threat of Substitutes
4.1.4 Threat of New Entrants
4.1.5 Competitive Rivalry
4.2 Market Share Analysis of Key Players
4.3 Product Benchmarking and Performance Comparison
5 Global Intelligent Vehicle Networking Systems Market, By Vehicle Type
5.1 Passenger Vehicles
5.2 Light Commercial Vehicles
5.3 Heavy Commercial Vehicles
6 Global Intelligent Vehicle Networking Systems Market, By Component
6.1 Transceivers
6.2 Controllers & Gateways
6.3 Software Platforms
6.4 Hardware Modules
7 Global Intelligent Vehicle Networking Systems Market, By Technology
7.1 CAN (Controller Area Network)
7.2 LIN (Local Interconnect Network)
7.3 FlexRay
7.4 Automotive Ethernet
7.5 MOST (Media Oriented Systems Transport)
8 Global Intelligent Vehicle Networking Systems Market, By Application
8.1 Powertrain & Chassis Control
8.2 Safety & ADAS (Advanced Driver Assistance Systems)
8.3 Infotainment
8.4 Telematics
8.5 Body Electronics
8.6 Connected Services
9 Global Intelligent Vehicle Networking Systems Market, By Geography
9.1 North America
9.1.1 United States
9.1.2 Canada
9.1.3 Mexico
9.2 Europe
9.2.1 United Kingdom
9.2.2 Germany
9.2.3 France
9.2.4 Italy
9.2.5 Spain
9.2.6 Netherlands
9.2.7 Belgium
9.2.8 Sweden
9.2.9 Switzerland
9.2.10 Poland
9.2.11 Rest of Europe
9.3 Asia Pacific
9.3.1 China
9.3.2 Japan
9.3.3 India
9.3.4 South Korea
9.3.5 Australia
9.3.6 Indonesia
9.3.7 Thailand
9.3.8 Malaysia
9.3.9 Singapore
9.3.10 Vietnam
9.3.11 Rest of Asia Pacific
9.4 South America
9.4.1 Brazil
9.4.2 Argentina
9.4.3 Colombia
9.4.4 Chile
9.4.5 Peru
9.4.6 Rest of South America
9.5 Rest of the World (RoW)
9.5.1 Middle East
9.5.1.1 Saudi Arabia
9.5.1.2 United Arab Emirates
9.5.1.3 Qatar
9.5.1.4 Israel
9.5.1.5 Rest of Middle East
9.5.2 Africa
9.5.2.1 South Africa
9.5.2.2 Egypt
9.5.2.3 Morocco
9.5.2.4 Rest of Africa
10 Strategic Market Intelligence
10.1 Industry Value Network and Supply Chain Assessment
10.2 White-Space and Opportunity Mapping
10.3 Product Evolution and Market Life Cycle Analysis
10.4 Channel, Distributor, and Go-to-Market Assessment
11 Industry Developments and Strategic Initiatives
11.1 Mergers and Acquisitions
11.2 Partnerships, Alliances, and Joint Ventures
11.3 New Product Launches and Certifications
11.4 Capacity Expansion and Investments
11.5 Other Strategic Initiatives
12 Company Profiles
12.1 Bosch
12.2 DENSO
12.3 MAGNA
12.4 AISIN
12.5 ZF Friedrichshafen AG
12.6 AUTOLIV
12.7 BorgWarner
12.8 Mitsubishi Electric
12.9 NXP Semiconductors
12.10 Texas Instruments
12.11 Infineon Technologies
12.12 Continental
12.13 STMicroelectronics
12.14 Microchip Technology
12.15 Elmos Semiconductor
12.16 Analog Devices
12.17 Renesas Electronics
12.18 Aptiv
List of Tables
1 Global Intelligent Vehicle Networking Systems Market Outlook, By Region (2023-2034) ($MN)
2 Global Intelligent Vehicle Networking Systems Market Outlook, By Vehicle Type (2023-2034) ($MN)
3 Global Intelligent Vehicle Networking Systems Market Outlook, By Passenger Vehicles (2023-2034) ($MN)
4 Global Intelligent Vehicle Networking Systems Market Outlook, By Light Commercial Vehicles (2023-2034) ($MN)
5 Global Intelligent Vehicle Networking Systems Market Outlook, By Heavy Commercial Vehicles (2023-2034) ($MN)
6 Global Intelligent Vehicle Networking Systems Market Outlook, By Component (2023-2034) ($MN)
7 Global Intelligent Vehicle Networking Systems Market Outlook, By Transceivers (2023-2034) ($MN)
8 Global Intelligent Vehicle Networking Systems Market Outlook, By Controllers & Gateways (2023-2034) ($MN)
9 Global Intelligent Vehicle Networking Systems Market Outlook, By Software Platforms (2023-2034) ($MN)
10 Global Intelligent Vehicle Networking Systems Market Outlook, By Hardware Modules (2023-2034) ($MN)
11 Global Intelligent Vehicle Networking Systems Market Outlook, By Technology (2023-2034) ($MN)
12 Global Intelligent Vehicle Networking Systems Market Outlook, By CAN (Controller Area Network) (2023-2034) ($MN)
13 Global Intelligent Vehicle Networking Systems Market Outlook, By LIN (Local Interconnect Network) (2023-2034) ($MN)
14 Global Intelligent Vehicle Networking Systems Market Outlook, By FlexRay (2023-2034) ($MN)
15 Global Intelligent Vehicle Networking Systems Market Outlook, By Automotive Ethernet (2023-2034) ($MN)
16 Global Intelligent Vehicle Networking Systems Market Outlook, By MOST (Media Oriented Systems Transport) (2023-2034) ($MN)
17 Global Intelligent Vehicle Networking Systems Market Outlook, By Application (2023-2034) ($MN)
18 Global Intelligent Vehicle Networking Systems Market Outlook, By Powertrain & Chassis Control (2023-2034) ($MN)
19 Global Intelligent Vehicle Networking Systems Market Outlook, By Safety & ADAS (Advanced Driver Assistance Systems) (2023-2034) ($MN)
20 Global Intelligent Vehicle Networking Systems Market Outlook, By Infotainment (2023-2034) ($MN)
21 Global Intelligent Vehicle Networking Systems Market Outlook, By Telematics (2023-2034) ($MN)
22 Global Intelligent Vehicle Networking Systems Market Outlook, By Body Electronics (2023-2034) ($MN)
23 Global Intelligent Vehicle Networking Systems Market Outlook, By Connected Services (2023-2034) ($MN)
Note: Tables for North America, Europe, APAC, South America, and Rest of the World (RoW) Regions are also represented in the same manner as above.
List of Figures
RESEARCH METHODOLOGY

We at ‘Stratistics’ opt for an extensive research approach which involves data mining, data validation, and data analysis. The various research sources include in-house repository, secondary research, competitor’s sources, social media research, client internal data, and primary research.
Our team of analysts prefers the most reliable and authenticated data sources in order to perform the comprehensive literature search. With access to most of the authenticated data bases our team highly considers the best mix of information through various sources to obtain extensive and accurate analysis.
Each report takes an average time of a month and a team of 4 industry analysts. The time may vary depending on the scope and data availability of the desired market report. The various parameters used in the market assessment are standardized in order to enhance the data accuracy.
Data Mining
The data is collected from several authenticated, reliable, paid and unpaid sources and is filtered depending on the scope & objective of the research. Our reports repository acts as an added advantage in this procedure. Data gathering from the raw material suppliers, distributors and the manufacturers is performed on a regular basis, this helps in the comprehensive understanding of the products value chain. Apart from the above mentioned sources the data is also collected from the industry consultants to ensure the objective of the study is in the right direction.
Market trends such as technological advancements, regulatory affairs, market dynamics (Drivers, Restraints, Opportunities and Challenges) are obtained from scientific journals, market related national & international associations and organizations.
Data Analysis
From the data that is collected depending on the scope & objective of the research the data is subjected for the analysis. The critical steps that we follow for the data analysis include:
- Product Lifecycle Analysis
- Competitor analysis
- Risk analysis
- Porters Analysis
- PESTEL Analysis
- SWOT Analysis
The data engineering is performed by the core industry experts considering both the Marketing Mix Modeling and the Demand Forecasting. The marketing mix modeling makes use of multiple-regression techniques to predict the optimal mix of marketing variables. Regression factor is based on a number of variables and how they relate to an outcome such as sales or profits.
Data Validation
The data validation is performed by the exhaustive primary research from the expert interviews. This includes telephonic interviews, focus groups, face to face interviews, and questionnaires to validate our research from all aspects. The industry experts we approach come from the leading firms, involved in the supply chain ranging from the suppliers, distributors to the manufacturers and consumers so as to ensure an unbiased analysis.
We are in touch with more than 15,000 industry experts with the right mix of consultants, CEO's, presidents, vice presidents, managers, experts from both supply side and demand side, executives and so on.
The data validation involves the primary research from the industry experts belonging to:
- Leading Companies
- Suppliers & Distributors
- Manufacturers
- Consumers
- Industry/Strategic Consultants
Apart from the data validation the primary research also helps in performing the fill gap research, i.e. providing solutions for the unmet needs of the research which helps in enhancing the reports quality.
For more details about research methodology, kindly write to us at info@strategymrc.com
Frequently Asked Questions
In case of any queries regarding this report, you can contact the customer service by filing the “Inquiry Before Buy” form available on the right hand side. You may also contact us through email: info@strategymrc.com or phone: +1-301-202-5929
Yes, the samples are available for all the published reports. You can request them by filling the “Request Sample” option available in this page.
Yes, you can request a sample with your specific requirements. All the customized samples will be provided as per the requirement with the real data masked.
All our reports are available in Digital PDF format. In case if you require them in any other formats, such as PPT, Excel etc you can submit a request through “Inquiry Before Buy” form available on the right hand side. You may also contact us through email: info@strategymrc.com or phone: +1-301-202-5929
We offer a free 15% customization with every purchase. This requirement can be fulfilled for both pre and post sale. You may send your customization requirements through email at info@strategymrc.com or call us on +1-301-202-5929.
We have 3 different licensing options available in electronic format.
- Single User Licence: Allows one person, typically the buyer, to have access to the ordered product. The ordered product cannot be distributed to anyone else.
- 2-5 User Licence: Allows the ordered product to be shared among a maximum of 5 people within your organisation.
- Corporate License: Allows the product to be shared among all employees of your organisation regardless of their geographical location.
All our reports are typically be emailed to you as an attachment.
To order any available report you need to register on our website. The payment can be made either through CCAvenue or PayPal payments gateways which accept all international cards.
We extend our support to 6 months post sale. A post sale customization is also provided to cover your unmet needs in the report.
Request Customization
We offer complimentary customization of up to 15% with every purchase. To share your customization requirements, feel free to email us at info@strategymrc.com or call us on +1-301-202-5929. .
Please Note: Customization within the 15% threshold is entirely free of charge. If your request exceeds this limit, we will conduct a feasibility assessment. Following that, a detailed quote and timeline will be provided.
WHY CHOOSE US ?

Assured Quality
Best in class reports with high standard of research integrity

24X7 Research Support
Continuous support to ensure the best customer experience.

Free Customization
Adding more values to your product of interest.

Safe & Secure Access
Providing a secured environment for all online transactions.

Trusted by 600+ Brands
Serving the most reputed brands across the world.