
Interactive Patient Engagement Solutions Market
Interactive Patient Engagement Solutions Market Forecasts to 2028 – Global Analysis By Type (Inpatient, Outpatient), Product (In Room Television, Interactive Bedside Terminal, Smart Bands), Application, and By Geography

|
Years Covered |
2020-2028 |
|
Estimated Year Value (2021) |
US $125.06 MN |
|
Projected Year Value (2028) |
US $407.94 MN |
|
CAGR (2021 - 2028) |
18.4% |
|
Regions Covered |
North America, Europe, Asia Pacific, South America, and Middle East & Africa |
|
Countries Covered |
US, Canada, Mexico, Germany, UK, Italy, France, Spain, Japan, China, India, Australia, New Zealand, South Korea, Rest of Asia Pacific, South America, Argentina, Brazil, Chile, Middle East & Africa, Saudi Arabia, UAE, Qatar, and South Africa |
|
Largest Market |
Asia Pacific |
|
Fastest Growing Market |
North America |
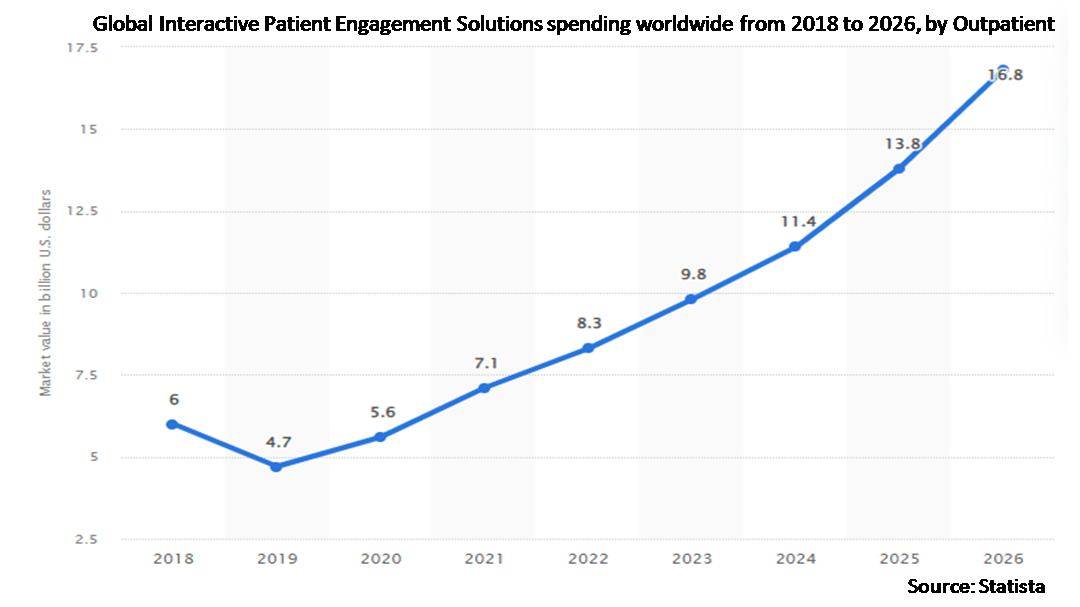
According to Stratistics MRC, the Global Interactive Patient Engagement Solutions Market is accounted for $125.06 million in 2021 and is expected to reach $407.94 million by 2028 growing at a CAGR of 18.4% during the forecast period. Patient engagement is a well-established process in which healthcare providers and patients work together to improve health. This concept is used to describe everything from patient portals to social media strategies, from tracking vitals with wearables to patients actively participating in their own health and wellness. It combines a patient’s knowledge, skills, ability, and willingness to manage their own care more effectively which will help in improving health outcomes, drive better patient care, and achieve lower costs.
Market Dynamics:
Driver:
Growing penetration of the internet
The never-ending growth in the accessibility of internet around the world along with numerous technological advancements comprising blockchain, cloud services, Internet of Things (IoT), Artificial Intelligence (AI), and 5G among others have significantly boosted the economic growth in the last two decades. For instance, as of April 2021, there were more than 4.5 billion users that were actively using the internet globally. In addition, the growth in ICT sector has significantly contributed towards GDP growth, labor productivity, and R&D spending among other transformations of economies in different nations of the globe.
Restraint:
Financial crunches due to the pandemic
Healthcare facilities across the globe have been overwhelmed by the large number of patients visiting them on a daily basis. Small and medium-sized hospitals in most regions have been adversely impacted by the pandemic. This has created a financial crunch for such hospitals, which ultimately makes it difficult for them to adopt interactive patient engagement solutions. Patients believe that the interactive patient engagement services offered by hospitals can increase the hospital bills and they won't be able to pay for it due to increased lay off in jobs taking place. This is expected to hamper the adoption of such solutions.
Opportunity:
Rising new product launches
Majorly, the technological advancements are playing a key role in flourishing the market. Companies are developing audio and video devices to enable physically challenged patients to communicate easily with hospital staff. The development of Epoxy’s smart solutions brings advanced nurse call features, which enable patients to call nurses from patient’s room, patient’s toilet in which patient’s calls can be sent directly to the relevant staff members enabling Instant communication. These products enhance patient safety, enriched patient satisfaction, and increased staff efficiency.
Threat:
Data breaches and security issues
The data hosted by the vendor is not secured and may lead to data breaches. Patient information is considered sensitive, and a high degree of privacy needs to be maintained so that this information is accessible to authorized users only. When a patient accesses engagement solutions using, their own device using the internet facility offered by the hospital, the chances of data security breach increases; most of these solutions display a patient’s vital reading and diagnostic charts. For example, the solutions offered by eVideon and Lincor integrate a hospitals’ EHR systems to provide detailed information to the patient right from diagnosis to treatment offered.
The hospitals segment is expected to be the largest during the forecast period
The hospitals segment is estimated to have a lucrative growth. The hospitals are increasingly generating revenue prospects for solution providers in the interactive patient engagement solutions market, with relentless focus of the healthcare systems on improving patient outcomes. The role of patient engagement in driving patient customer loyalty in hospital settings is a key pivot that has spurred the deployment of such systems in interactive patient engagement solutions market. Physicians and other clinicians are harnessing patient engagement solutions to engage patients, empower them in better and timely decision making, and educate them on range of topics ranging from disease processes, medications, and diagnostics.
The in-room television segment is expected to have the highest CAGR during the forecast period
The in-room television segment is anticipated to witness the fastest CAGR growth during the forecast period due to the rising development of TV-based solutions and the increased adoption of in-room televisions by hospitals. The interactive in-room television system encourages active patient engagement by offering bedside access to education, positive distraction and communication tools. This technology delivers improved patient experience, health outcomes and hospital productivity.
Region with highest share:
Asia Pacific is projected to hold the largest market share during the forecast period. In particular, economies in the Asia Pacific region have recently witnessed rise in revenue prospects of interactive engagement solutions. Moreover, the rising demand in the Asia Pacific interactive patient engagement solutions market hinges mainly on the growing focus of healthcare providers to educate patients and their caregivers on the benefits of such systems in empowering decision making.
Region with highest CAGR:
North America is projected to have the highest CAGR over the forecast period due to the rising awareness about digital healthcare products, and the favourable government initiatives. In addition, supportive government policies for digitization of pharmaceutical sector, and growing occurrence of chronic diseases are also predicted to boost the region’s market growth in the imminent time. For instance, as per the Centers for Disease Control and Prevention, as of January 2021, 6 in 10 adults in the United States have a chronic disease, and 4 in 10 adults in the country have two or more.

Key players in the market
Some of the key players profiled in the Interactive Patient Engagement Solutions Market include Aceso Interactive, Inc, Advantech Co., Ltd, Allen Technologies, ARBOR Technology Corp, Barco, Epic Systems Corporation, GetWellNetwork, Inc, HCI, Inc, HealthHub Patient Engagement Solutions, Hospedia, i3solutions, Inc, Lincor Solutions, Onyx Healthcare, Inc, Remedi Technology, and SONIFI Health.
Key Developments:
In January 2021, GetWellNetwork announced the acquisition of Docent Health, an innovative enterprise consumer engagement platform that enables healthcare organizations to scale personalized outreach through AI-enabled communication technology. Docent Health primarily leverages intelligent, real-time text messaging to improve patient outcomes and retention by guiding patients to the “next best step” in their care across episodes, a critical time when patients often don’t know what additional services they need or are at risk of seeking care outside of their home network.
In September 2020, Siemens and SONIFI Health today announced that SONIFI Health has joined the growing Siemens Connect Ecosystem – a network that brings together experts in software development, IT, cybersecurity, remote and digital services, and business intelligence.
Types Covered:
• Inpatient
• Outpatient
Products Covered:
• In Room Television
• Interactive Bedside Terminal
• Smart Bands
• Tablets
Applications Covered:
• Financial Health Management
• Health Management
• Home Healthcare Management
• Patient Education
• Social Management
End Users Covered:
• Clinics/Ambulatory Care Settings
• Hospitals
• Individual Users
Regions Covered:
• North America
o US
o Canada
o Mexico
• Europe
o Germany
o UK
o Italy
o France
o Spain
o Rest of Europe
• Asia Pacific
o Japan
o China
o India
o Australia
o New Zealand
o South Korea
o Rest of Asia Pacific
• South America
o Argentina
o Brazil
o Chile
o Rest of South America
• Middle East & Africa
o Saudi Arabia
o UAE
o Qatar
o South Africa
o Rest of Middle East & Africa
What our report offers:
- Market share assessments for the regional and country-level segments
- Strategic recommendations for the new entrants
- Covers Market data for the years 2020, 2021, 2022, 2025, and 2028
- Market Trends (Drivers, Constraints, Opportunities, Threats, Challenges, Investment Opportunities, and recommendations)
- Strategic recommendations in key business segments based on the market estimations
- Competitive landscaping mapping the key common trends
- Company profiling with detailed strategies, financials, and recent developments
- Supply chain trends mapping the latest technological advancements
Free Customization Offerings:
All the customers of this report will be entitled to receive one of the following free customization options:
• Company Profiling
o Comprehensive profiling of additional market players (up to 3)
o SWOT Analysis of key players (up to 3)
• Regional Segmentation
o Market estimations, Forecasts and CAGR of any prominent country as per the client's interest (Note: Depends on feasibility check)
• Competitive Benchmarking
o Benchmarking of key players based on product portfolio, geographical presence, and strategic alliances
Table of Contents
1 Executive Summary
2 Preface
2.1 Abstract
2.2 Stake Holders
2.3 Research Scope
2.4 Research Methodology
2.4.1 Data Mining
2.4.2 Data Analysis
2.4.3 Data Validation
2.4.4 Research Approach
2.5 Research Sources
2.5.1 Primary Research Sources
2.5.2 Secondary Research Sources
2.5.3 Assumptions
3 Market Trend Analysis
3.1 Introduction
3.2 Drivers
3.3 Restraints
3.4 Opportunities
3.5 Threats
3.6 Product Analysis
3.7 Application Analysis
3.8 End User Analysis
3.9 Emerging Markets
3.10 Impact of Covid-19
4 Porters Five Force Analysis
4.1 Bargaining power of suppliers
4.2 Bargaining power of buyers
4.3 Threat of substitutes
4.4 Threat of new entrants
4.5 Competitive rivalry
5 Global Interactive Patient Engagement Solutions Market, By Type
5.1 Introduction
5.2 Inpatient
5.3 Outpatient
6 Global Interactive Patient Engagement Solutions Market, By Product
6.1 Introduction
6.2 In Room Television
6.3 Interactive Bedside Terminal
6.4 Smart Bands
6.5 Tablets
7 Global Interactive Patient Engagement Solutions Market, By Application
7.1 Introduction
7.2 Financial Health Management
7.3 Health Management
7.4 Home Healthcare Management
7.5 Patient Education
7.6 Social Management
8 Global Interactive Patient Engagement Solutions Market, By End User
8.1 Introduction
8.2 Clinics/Ambulatory Care Settings
8.3 Hospitals
8.4 Individual Users
9 Global Interactive Patient Engagement Solutions Market, By Geography
9.1 Introduction
9.2 North America
9.2.1 US
9.2.2 Canada
9.2.3 Mexico
9.3 Europe
9.3.1 Germany
9.3.2 UK
9.3.3 Italy
9.3.4 France
9.3.5 Spain
9.3.6 Rest of Europe
9.4 Asia Pacific
9.4.1 Japan
9.4.2 China
9.4.3 India
9.4.4 Australia
9.4.5 New Zealand
9.4.6 South Korea
9.4.7 Rest of Asia Pacific
9.5 South America
9.5.1 Argentina
9.5.2 Brazil
9.5.3 Chile
9.5.4 Rest of South America
9.6 Middle East & Africa
9.6.1 Saudi Arabia
9.6.2 UAE
9.6.3 Qatar
9.6.4 South Africa
9.6.5 Rest of Middle East & Africa
10 Key Developments
10.1 Agreements, Partnerships, Collaborations and Joint Ventures
10.2 Acquisitions & Mergers
10.3 New Product Launch
10.4 Expansions
10.5 Other Key Strategies
11 Company Profiling
11.1 Aceso Interactive, Inc
11.2 Advantech Co., Ltd
11.3 Allen Technologies
11.4 ARBOR Technology Corp
11.5 Barco
11.6 Epic Systems Corporation
11.7 GetWellNetwork, Inc
11.8 HCI, Inc
11.9 HealthHub Patient Engagement Solutions
11.10 Hospedia
11.11 i3solutions, Inc
11.12 Lincor Solutions
11.13 Onyx Healthcare, Inc
11.14 Remedi Technology
11.15 SONIFI Health
List of Tables
1 Global Interactive Patient Engagement Solutions Market Outlook, By Region (2020-2028) ($MN)
2 Global Interactive Patient Engagement Solutions Market Outlook, By Type (2020-2028) ($MN)
3 Global Interactive Patient Engagement Solutions Market Outlook, By Inpatient (2020-2028) ($MN)
4 Global Interactive Patient Engagement Solutions Market Outlook, By Outpatient (2020-2028) ($MN)
5 Global Interactive Patient Engagement Solutions Market Outlook, By Product (2020-2028) ($MN)
6 Global Interactive Patient Engagement Solutions Market Outlook, By In Room Television (2020-2028) ($MN)
7 Global Interactive Patient Engagement Solutions Market Outlook, By Interactive Bedside Terminal (2020-2028) ($MN)
8 Global Interactive Patient Engagement Solutions Market Outlook, By Smart Bands (2020-2028) ($MN)
9 Global Interactive Patient Engagement Solutions Market Outlook, By Tablets (2020-2028) ($MN)
10 Global Interactive Patient Engagement Solutions Market Outlook, By Application (2020-2028) ($MN)
11 Global Interactive Patient Engagement Solutions Market Outlook, By Financial Health Management (2020-2028) ($MN)
12 Global Interactive Patient Engagement Solutions Market Outlook, By Health Management (2020-2028) ($MN)
13 Global Interactive Patient Engagement Solutions Market Outlook, By Home Healthcare Management (2020-2028) ($MN)
14 Global Interactive Patient Engagement Solutions Market Outlook, By Patient Education (2020-2028) ($MN)
15 Global Interactive Patient Engagement Solutions Market Outlook, By Social Management (2020-2028) ($MN)
16 Global Interactive Patient Engagement Solutions Market Outlook, By End User (2020-2028) ($MN)
17 Global Interactive Patient Engagement Solutions Market Outlook, By Clinics/Ambulatory Care Settings (2020-2028) ($MN)
18 Global Interactive Patient Engagement Solutions Market Outlook, By Hospitals (2020-2028) ($MN)
19 Global Interactive Patient Engagement Solutions Market Outlook, By Individual Users (2020-2028) ($MN)
20 North America Interactive Patient Engagement Solutions Market Outlook, By Country (2020-2028) ($MN)
21 North America Interactive Patient Engagement Solutions Market Outlook, By Type (2020-2028) ($MN)
22 North America Interactive Patient Engagement Solutions Market Outlook, By Inpatient (2020-2028) ($MN)
23 North America Interactive Patient Engagement Solutions Market Outlook, By Outpatient (2020-2028) ($MN)
24 North America Interactive Patient Engagement Solutions Market Outlook, By Product (2020-2028) ($MN)
25 North America Interactive Patient Engagement Solutions Market Outlook, By In Room Television (2020-2028) ($MN)
26 North America Interactive Patient Engagement Solutions Market Outlook, By Interactive Bedside Terminal (2020-2028) ($MN)
27 North America Interactive Patient Engagement Solutions Market Outlook, By Smart Bands (2020-2028) ($MN)
28 North America Interactive Patient Engagement Solutions Market Outlook, By Tablets (2020-2028) ($MN)
29 North America Interactive Patient Engagement Solutions Market Outlook, By Application (2020-2028) ($MN)
30 North America Interactive Patient Engagement Solutions Market Outlook, By Financial Health Management (2020-2028) ($MN)
31 North America Interactive Patient Engagement Solutions Market Outlook, By Health Management (2020-2028) ($MN)
32 North America Interactive Patient Engagement Solutions Market Outlook, By Home Healthcare Management (2020-2028) ($MN)
33 North America Interactive Patient Engagement Solutions Market Outlook, By Patient Education (2020-2028) ($MN)
34 North America Interactive Patient Engagement Solutions Market Outlook, By Social Management (2020-2028) ($MN)
35 North America Interactive Patient Engagement Solutions Market Outlook, By End User (2020-2028) ($MN)
36 North America Interactive Patient Engagement Solutions Market Outlook, By Clinics/Ambulatory Care Settings (2020-2028) ($MN)
37 North America Interactive Patient Engagement Solutions Market Outlook, By Hospitals (2020-2028) ($MN)
38 North America Interactive Patient Engagement Solutions Market Outlook, By Individual Users (2020-2028) ($MN)
39 Europe Interactive Patient Engagement Solutions Market Outlook, By Country (2020-2028) ($MN)
40 Europe Interactive Patient Engagement Solutions Market Outlook, By Type (2020-2028) ($MN)
41 Europe Interactive Patient Engagement Solutions Market Outlook, By Inpatient (2020-2028) ($MN)
42 Europe Interactive Patient Engagement Solutions Market Outlook, By Outpatient (2020-2028) ($MN)
43 Europe Interactive Patient Engagement Solutions Market Outlook, By Product (2020-2028) ($MN)
44 Europe Interactive Patient Engagement Solutions Market Outlook, By In Room Television (2020-2028) ($MN)
45 Europe Interactive Patient Engagement Solutions Market Outlook, By Interactive Bedside Terminal (2020-2028) ($MN)
46 Europe Interactive Patient Engagement Solutions Market Outlook, By Smart Bands (2020-2028) ($MN)
47 Europe Interactive Patient Engagement Solutions Market Outlook, By Tablets (2020-2028) ($MN)
48 Europe Interactive Patient Engagement Solutions Market Outlook, By Application (2020-2028) ($MN)
49 Europe Interactive Patient Engagement Solutions Market Outlook, By Financial Health Management (2020-2028) ($MN)
50 Europe Interactive Patient Engagement Solutions Market Outlook, By Health Management (2020-2028) ($MN)
51 Europe Interactive Patient Engagement Solutions Market Outlook, By Home Healthcare Management (2020-2028) ($MN)
52 Europe Interactive Patient Engagement Solutions Market Outlook, By Patient Education (2020-2028) ($MN)
53 Europe Interactive Patient Engagement Solutions Market Outlook, By Social Management (2020-2028) ($MN)
54 Europe Interactive Patient Engagement Solutions Market Outlook, By End User (2020-2028) ($MN)
55 Europe Interactive Patient Engagement Solutions Market Outlook, By Clinics/Ambulatory Care Settings (2020-2028) ($MN)
56 Europe Interactive Patient Engagement Solutions Market Outlook, By Hospitals (2020-2028) ($MN)
57 Europe Interactive Patient Engagement Solutions Market Outlook, By Individual Users (2020-2028) ($MN)
58 Asia Pacific Interactive Patient Engagement Solutions Market Outlook, By Country (2020-2028) ($MN)
59 Asia Pacific Interactive Patient Engagement Solutions Market Outlook, By Type (2020-2028) ($MN)
60 Asia Pacific Interactive Patient Engagement Solutions Market Outlook, By Inpatient (2020-2028) ($MN)
61 Asia Pacific Interactive Patient Engagement Solutions Market Outlook, By Outpatient (2020-2028) ($MN)
62 Asia Pacific Interactive Patient Engagement Solutions Market Outlook, By Product (2020-2028) ($MN)
63 Asia Pacific Interactive Patient Engagement Solutions Market Outlook, By In Room Television (2020-2028) ($MN)
64 Asia Pacific Interactive Patient Engagement Solutions Market Outlook, By Interactive Bedside Terminal (2020-2028) ($MN)
65 Asia Pacific Interactive Patient Engagement Solutions Market Outlook, By Smart Bands (2020-2028) ($MN)
66 Asia Pacific Interactive Patient Engagement Solutions Market Outlook, By Tablets (2020-2028) ($MN)
67 Asia Pacific Interactive Patient Engagement Solutions Market Outlook, By Application (2020-2028) ($MN)
68 Asia Pacific Interactive Patient Engagement Solutions Market Outlook, By Financial Health Management (2020-2028) ($MN)
69 Asia Pacific Interactive Patient Engagement Solutions Market Outlook, By Health Management (2020-2028) ($MN)
70 Asia Pacific Interactive Patient Engagement Solutions Market Outlook, By Home Healthcare Management (2020-2028) ($MN)
71 Asia Pacific Interactive Patient Engagement Solutions Market Outlook, By Patient Education (2020-2028) ($MN)
72 Asia Pacific Interactive Patient Engagement Solutions Market Outlook, By Social Management (2020-2028) ($MN)
73 Asia Pacific Interactive Patient Engagement Solutions Market Outlook, By End User (2020-2028) ($MN)
74 Asia Pacific Interactive Patient Engagement Solutions Market Outlook, By Clinics/Ambulatory Care Settings (2020-2028) ($MN)
75 Asia Pacific Interactive Patient Engagement Solutions Market Outlook, By Hospitals (2020-2028) ($MN)
76 Asia Pacific Interactive Patient Engagement Solutions Market Outlook, By Individual Users (2020-2028) ($MN)
77 South America Interactive Patient Engagement Solutions Market Outlook, By Country (2020-2028) ($MN)
78 South America Interactive Patient Engagement Solutions Market Outlook, By Type (2020-2028) ($MN)
79 South America Interactive Patient Engagement Solutions Market Outlook, By Inpatient (2020-2028) ($MN)
80 South America Interactive Patient Engagement Solutions Market Outlook, By Outpatient (2020-2028) ($MN)
81 South America Interactive Patient Engagement Solutions Market Outlook, By Product (2020-2028) ($MN)
82 South America Interactive Patient Engagement Solutions Market Outlook, By In Room Television (2020-2028) ($MN)
83 South America Interactive Patient Engagement Solutions Market Outlook, By Interactive Bedside Terminal (2020-2028) ($MN)
84 South America Interactive Patient Engagement Solutions Market Outlook, By Smart Bands (2020-2028) ($MN)
85 South America Interactive Patient Engagement Solutions Market Outlook, By Tablets (2020-2028) ($MN)
86 South America Interactive Patient Engagement Solutions Market Outlook, By Application (2020-2028) ($MN)
87 South America Interactive Patient Engagement Solutions Market Outlook, By Financial Health Management (2020-2028) ($MN)
88 South America Interactive Patient Engagement Solutions Market Outlook, By Health Management (2020-2028) ($MN)
89 South America Interactive Patient Engagement Solutions Market Outlook, By Home Healthcare Management (2020-2028) ($MN)
90 South America Interactive Patient Engagement Solutions Market Outlook, By Patient Education (2020-2028) ($MN)
91 South America Interactive Patient Engagement Solutions Market Outlook, By Social Management (2020-2028) ($MN)
92 South America Interactive Patient Engagement Solutions Market Outlook, By End User (2020-2028) ($MN)
93 South America Interactive Patient Engagement Solutions Market Outlook, By Clinics/Ambulatory Care Settings (2020-2028) ($MN)
94 South America Interactive Patient Engagement Solutions Market Outlook, By Hospitals (2020-2028) ($MN)
95 South America Interactive Patient Engagement Solutions Market Outlook, By Individual Users (2020-2028) ($MN)
96 Middle East & Africa Interactive Patient Engagement Solutions Market Outlook, By Country (2020-2028) ($MN)
97 Middle East & Africa Interactive Patient Engagement Solutions Market Outlook, By Type (2020-2028) ($MN)
98 Middle East & Africa Interactive Patient Engagement Solutions Market Outlook, By Inpatient (2020-2028) ($MN)
99 Middle East & Africa Interactive Patient Engagement Solutions Market Outlook, By Outpatient (2020-2028) ($MN)
100 Middle East & Africa Interactive Patient Engagement Solutions Market Outlook, By Product (2020-2028) ($MN)
101 Middle East & Africa Interactive Patient Engagement Solutions Market Outlook, By In Room Television (2020-2028) ($MN)
102 Middle East & Africa Interactive Patient Engagement Solutions Market Outlook, By Interactive Bedside Terminal (2020-2028) ($MN)
103 Middle East & Africa Interactive Patient Engagement Solutions Market Outlook, By Smart Bands (2020-2028) ($MN)
104 Middle East & Africa Interactive Patient Engagement Solutions Market Outlook, By Tablets (2020-2028) ($MN)
105 Middle East & Africa Interactive Patient Engagement Solutions Market Outlook, By Application (2020-2028) ($MN)
106 Middle East & Africa Interactive Patient Engagement Solutions Market Outlook, By Financial Health Management (2020-2028) ($MN)
107 Middle East & Africa Interactive Patient Engagement Solutions Market Outlook, By Health Management (2020-2028) ($MN)
108 Middle East & Africa Interactive Patient Engagement Solutions Market Outlook, By Home Healthcare Management (2020-2028) ($MN)
109 Middle East & Africa Interactive Patient Engagement Solutions Market Outlook, By Patient Education (2020-2028) ($MN)
110 Middle East & Africa Interactive Patient Engagement Solutions Market Outlook, By Social Management (2020-2028) ($MN)
111 Middle East & Africa Interactive Patient Engagement Solutions Market Outlook, By End User (2020-2028) ($MN)
112 Middle East & Africa Interactive Patient Engagement Solutions Market Outlook, By Clinics/Ambulatory Care Settings (2020-2028) ($MN)
113 Middle East & Africa Interactive Patient Engagement Solutions Market Outlook, By Hospitals (2020-2028) ($MN)
114 Middle East & Africa Interactive Patient Engagement Solutions Market Outlook, By Individual Users (2020-2028) ($MN)
List of Figures
RESEARCH METHODOLOGY

We at ‘Stratistics’ opt for an extensive research approach which involves data mining, data validation, and data analysis. The various research sources include in-house repository, secondary research, competitor’s sources, social media research, client internal data, and primary research.
Our team of analysts prefers the most reliable and authenticated data sources in order to perform the comprehensive literature search. With access to most of the authenticated data bases our team highly considers the best mix of information through various sources to obtain extensive and accurate analysis.
Each report takes an average time of a month and a team of 4 industry analysts. The time may vary depending on the scope and data availability of the desired market report. The various parameters used in the market assessment are standardized in order to enhance the data accuracy.
Data Mining
The data is collected from several authenticated, reliable, paid and unpaid sources and is filtered depending on the scope & objective of the research. Our reports repository acts as an added advantage in this procedure. Data gathering from the raw material suppliers, distributors and the manufacturers is performed on a regular basis, this helps in the comprehensive understanding of the products value chain. Apart from the above mentioned sources the data is also collected from the industry consultants to ensure the objective of the study is in the right direction.
Market trends such as technological advancements, regulatory affairs, market dynamics (Drivers, Restraints, Opportunities and Challenges) are obtained from scientific journals, market related national & international associations and organizations.
Data Analysis
From the data that is collected depending on the scope & objective of the research the data is subjected for the analysis. The critical steps that we follow for the data analysis include:
- Product Lifecycle Analysis
- Competitor analysis
- Risk analysis
- Porters Analysis
- PESTEL Analysis
- SWOT Analysis
The data engineering is performed by the core industry experts considering both the Marketing Mix Modeling and the Demand Forecasting. The marketing mix modeling makes use of multiple-regression techniques to predict the optimal mix of marketing variables. Regression factor is based on a number of variables and how they relate to an outcome such as sales or profits.
Data Validation
The data validation is performed by the exhaustive primary research from the expert interviews. This includes telephonic interviews, focus groups, face to face interviews, and questionnaires to validate our research from all aspects. The industry experts we approach come from the leading firms, involved in the supply chain ranging from the suppliers, distributors to the manufacturers and consumers so as to ensure an unbiased analysis.
We are in touch with more than 15,000 industry experts with the right mix of consultants, CEO's, presidents, vice presidents, managers, experts from both supply side and demand side, executives and so on.
The data validation involves the primary research from the industry experts belonging to:
- Leading Companies
- Suppliers & Distributors
- Manufacturers
- Consumers
- Industry/Strategic Consultants
Apart from the data validation the primary research also helps in performing the fill gap research, i.e. providing solutions for the unmet needs of the research which helps in enhancing the reports quality.
For more details about research methodology, kindly write to us at info@strategymrc.com
Frequently Asked Questions
In case of any queries regarding this report, you can contact the customer service by filing the “Inquiry Before Buy” form available on the right hand side. You may also contact us through email: info@strategymrc.com or phone: +1-301-202-5929
Yes, the samples are available for all the published reports. You can request them by filling the “Request Sample” option available in this page.
Yes, you can request a sample with your specific requirements. All the customized samples will be provided as per the requirement with the real data masked.
All our reports are available in Digital PDF format. In case if you require them in any other formats, such as PPT, Excel etc you can submit a request through “Inquiry Before Buy” form available on the right hand side. You may also contact us through email: info@strategymrc.com or phone: +1-301-202-5929
We offer a free 15% customization with every purchase. This requirement can be fulfilled for both pre and post sale. You may send your customization requirements through email at info@strategymrc.com or call us on +1-301-202-5929.
We have 3 different licensing options available in electronic format.
- Single User Licence: Allows one person, typically the buyer, to have access to the ordered product. The ordered product cannot be distributed to anyone else.
- 2-5 User Licence: Allows the ordered product to be shared among a maximum of 5 people within your organisation.
- Corporate License: Allows the product to be shared among all employees of your organisation regardless of their geographical location.
All our reports are typically be emailed to you as an attachment.
To order any available report you need to register on our website. The payment can be made either through CCAvenue or PayPal payments gateways which accept all international cards.
We extend our support to 6 months post sale. A post sale customization is also provided to cover your unmet needs in the report.
Request Customization
We offer complimentary customization of up to 15% with every purchase. To share your customization requirements, feel free to email us at info@strategymrc.com or call us on +1-301-202-5929. .
Please Note: Customization within the 15% threshold is entirely free of charge. If your request exceeds this limit, we will conduct a feasibility assessment. Following that, a detailed quote and timeline will be provided.
WHY CHOOSE US ?

Assured Quality
Best in class reports with high standard of research integrity

24X7 Research Support
Continuous support to ensure the best customer experience.

Free Customization
Adding more values to your product of interest.

Safe & Secure Access
Providing a secured environment for all online transactions.

Trusted by 600+ Brands
Serving the most reputed brands across the world.