
Internet Of Vehicle Market
Internet of Vehicle Market Forecasts to 2028 - Global Analysis By Component (Hardware, Service and Software), Networking Technology (Bluetooth, Cellular, Wi-Fi and Other Networking Technologies), Communication Type and By Geography

|
Years Covered |
2020-2028 |
|
Estimated Year Value (2022) |
US $117.89 BN |
|
Projected Year Value (2028) |
US $414.27 BN |
|
CAGR (2022 - 2028) |
23.3% |
|
Regions Covered |
North America, Europe, Asia Pacific, South America, and Middle East & Africa |
|
Countries Covered |
US, Canada, Mexico, Germany, UK, Italy, France, Spain, Japan, China, India, Australia, New Zealand, South Korea, Rest of Asia Pacific, South America, Argentina, Brazil, Chile, Middle East & Africa, Saudi Arabia, UAE, Qatar, and South Africa |
|
Largest Market |
North America |
|
Fastest Growing Market |
Asia Pacific |
According to Stratistics MRC, the Global Internet of Vehicle Market is accounted for $117.89 billion in 2022 and is expected to reach $414.27 billion by 2028 growing at a CAGR of 23.3% during the forecast period. The Internet of Vehicles (IoV) is a network that integrates three networks; a vehicular mobile internet network, an intra-vehicle network, and an inter-vehicle network. IoV is characterized as a vast dispersed system for information exchange & wireless connection between vehicle2X based on the idea of fusing different networks into one (where X includes internet, roads, people, and vehicles, among others). It employs customary data exchange and communication protocols. Intelligent traffic management, intelligent dynamic information service, and intelligent vehicle control are all provided by this integrated system.
According to the National Highway Traffic Safety Administration (NHTSA), the average commuter in the U.S. spends thirty-eight hours annually stuck in traffic. It collectively leads to 5.5 billion extra hours of travel and the purchase of an additional 2.9 billion gallons of fuel. This wasted fuel and time cost the U.S. economy around US$ 121 billion every year.
Market Dynamics:
Driver:
Safety and Economic Savings
The Internet of Things (IoT) and Automotive & Transportation Policy Principles were the subject of a report issued by Intel in 2019. It was discovered that more than 90% of collisions in the US are the result of human mistake. Crash rates can be significantly reduced by connected autonomous vehicles functioning in an IoT system that, in some situations, can navigate without human input. For instance, if only 10% of vehicles were autonomous, 1,100 road fatalities may be avoided in the United States each year, saving around USD 38 billion. Similarly, if 90% of vehicles were autonomous, USD 447 billion could be saved and 21,700 traffic fatalities might be avoided. Therefore, during the time of the forecast, these factors will propel the market's expansion.
Restraint:
Security and Privacy Concerns
The internet of vehicles establishes a network of interconnected devices and integrates various services, technologies, and communication protocols, posing information security concerns. The system becomes susceptible to several kinds of malicious interference, including distributed denial-of-service (DDoS) assaults. They can be aimed at different places, such the vehicle itself or the network that transmits the data. In the Internet of Vehicles; its components including the accelerator, steering wheel, brakes, GPS, and alarms can all be accessible remotely, and a successful breach or hack could result in fatalities. These problems will therefore prevent consumers from adopting the internet of automobiles.
Opportunity:
Implementation in traffic control
Traffic management is a major revenue source for the internet of vehicles, with applications ranging from smart traffic lights that may optimise traffic flow by evaluating the present road situation to adaptable lighting systems that take weather conditions into consideration. Additionally, sensors and beacons can direct cars to open parking spaces, and real-time information from CCTV cameras can instantly alert rescue personnel when a driver is involved in an accident. As a result, the market will rise due to the growing use of IoV in traffic and parking management.
Threat:
Huge amounts of information to process
Big data is a benefit of IoV technology, but managing the continuous influx of data presents serious difficulties for providers. One gigabyte of data is processed by connected vehicles every second, and as more infrastructure items become online and require connectivity, this amount is certain to rise. Cloud computing can be hampered and the system damaged by insufficient storage or slow network speeds.
Covid-19 Impact
COVID-19 has Influenced Telecommunications and Connected Infrastructure Policy. Despite the pandemic's detrimental effects, particularly with regard to funding for R&D in autonomous driving, testing activities have persisted, and expectations are optimistic. Significant regulatory adjustments are being enacted, particularly in the U.S. and China, as Wi-Fi demand rises during the pandemic. China has allocated specific bandwidth for the use of C-V2X on the 5.9 GHz spectrum starting in 2020. During the predicted period, the nation also plans to deploy the system on 90% of the main roads and localities. Although adopting such policies would take a lot of time, it will encourage and reassure important parties to invest in an IoV network. As a result, COVID-19's regulatory changes will have an impact on the market's expansion.
The service segment is expected to be the largest during the forecast period
The service segment is estimated to have a lucrative growth, as the service model generates regular revenues and, more crucially, long-term customer relationships. For instance, Volkswagen's Car-Net service costs USD 200 per year or USD 18 per month and offers consumers navigation tools, security features, and maintenance support, among other features. Therefore, these elements are to blame for this segment's supremacy.
The Wi-Fi segment is expected to have the highest CAGR during the forecast period
The Wi-Fi segment is anticipated to witness the fastest CAGR growth during the forecast period, due to the successful data exchange for both low and high frequency connections, with a failure rate of less than 1%. Furthermore, in-car Wi-Fi allows for on-the-go networking through mobile hotspots and eliminates the need for cellular services. The expansion of this market segment is attributed to these factors.
Region with highest share:
North America is projected to hold the largest market share during the forecast period owing to the National Highway Traffic Safety Administration (NHTSA) estimates that the typical American commuter wastes 38 hours per year in traffic. It results in an overall increase in travel time of 5.5 billion hours and fuel purchases of an extra 2.9 billion gallons. The U.S. economy suffers a yearly loss of about US$121 billion due to this squandered fuel and time. With better traffic management and self-driving cars, the internet of vehicles network can increase productivity and efficiency. These elements will fuel the market's expansion in this area.
Region with highest CAGR:
Asia Pacific is projected to have the highest CAGR over the forecast period. In Japan, supportive regulatory measures are being put in place to facilitate IoV architectural testing and expand engineering capability. China is also the world leader in 5G networking in terms of adoption rate and implementation due to the country's early launch. Additionally, the nation is swiftly developing new IoV technological standards and federal-level regulations. As a result, these elements are to blame for the market's quick expansion in this area.

Key players in the market
Some of the key players profiled in the Internet of Vehicle Market include Apple Inc., Audi AG, Cisco Systems, Inc., Cloud Your Car, Google LLC, Ford Motor Company, IBM Corporation, Intel Corporation, NXP Semiconductors, Texas Instruments, SAP SE, Veniam, Volkswagen
Key Developments:
In February 2021, Ford and Google announced a unique six-year strategic partnership to reinvent the connected car/vehicle experience. From 2023, millions of future Ford and Lincoln vehicles at all price points will be powered by Android, with Google apps and services built-in.
In November 2020, NXP Semiconductors announced a strategic relationship with Amazon Web Services (AWS). The collaboration aims to deliver a secure, edge-to-cloud compute solution for next-generation vehicles that can enable new cloud-powered services.
Components Covered:
• Hardware
• Service
• Software
Networking Technologies Covered:
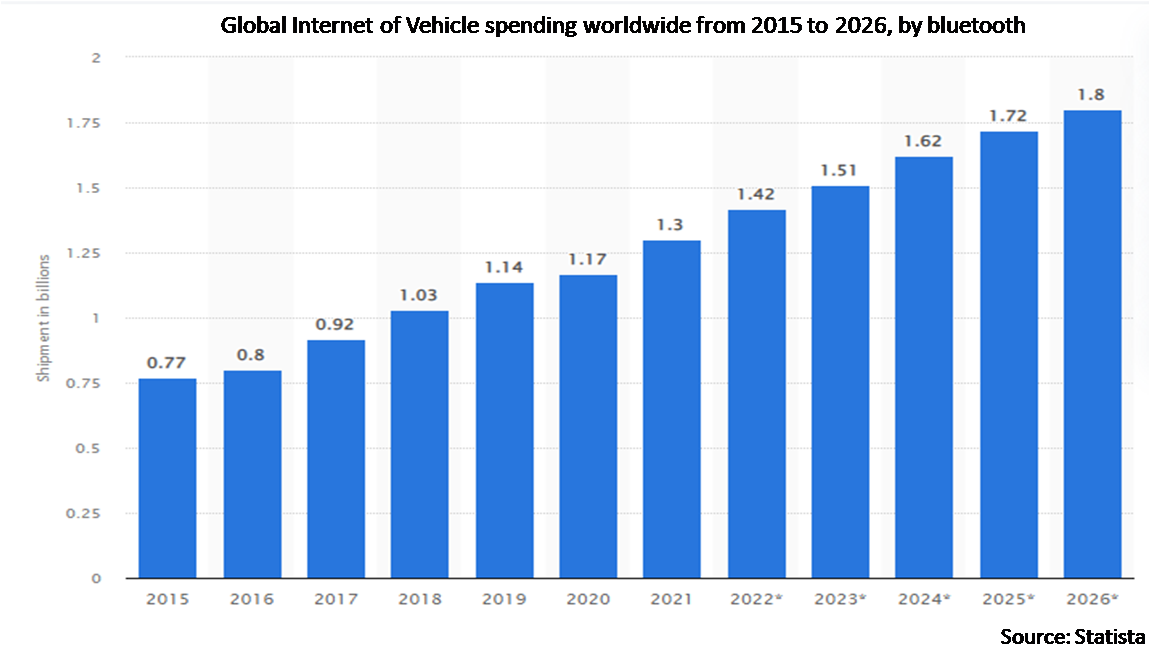
• Bluetooth
• Cellular
• Wi-Fi
• Other Networking Technologies
Communication Types Covered:
• Vehicle-to-Infrastructure (V2I)
• Vehicle-to-Vehicle (V2V)
• Other Communication Types
Regions Covered:
• North America
o US
o Canada
o Mexico
• Europe
o Germany
o UK
o Italy
o France
o Spain
o Rest of Europe
• Asia Pacific
o Japan
o China
o India
o Australia
o New Zealand
o South Korea
o Rest of Asia Pacific
• South America
o Argentina
o Brazil
o Chile
o Rest of South America
• Middle East & Africa
o Saudi Arabia
o UAE
o Qatar
o South Africa
o Rest of Middle East & Africa
What our report offers:
- Market share assessments for the regional and country-level segments
- Strategic recommendations for the new entrants
- Covers Market data for the years 2020, 2021, 2022, 2025, and 2028
- Market Trends (Drivers, Constraints, Opportunities, Threats, Challenges, Investment Opportunities, and recommendations)
- Strategic recommendations in key business segments based on the market estimations
- Competitive landscaping mapping the key common trends
- Company profiling with detailed strategies, financials, and recent developments
- Supply chain trends mapping the latest technological advancements
Free Customization Offerings:
All the customers of this report will be entitled to receive one of the following free customization options:
• Company Profiling
o Comprehensive profiling of additional market players (up to 3)
o SWOT Analysis of key players (up to 3)
• Regional Segmentation
o Market estimations, Forecasts and CAGR of any prominent country as per the client's interest (Note: Depends on feasibility check)
• Competitive Benchmarking
o Benchmarking of key players based on product portfolio, geographical presence, and strategic alliances
Table of Contents
1 Executive Summary
2 Preface
2.1 Abstract
2.2 Stake Holders
2.3 Research Scope
2.4 Research Methodology
2.4.1 Data Mining
2.4.2 Data Analysis
2.4.3 Data Validation
2.4.4 Research Approach
2.5 Research Sources
2.5.1 Primary Research Sources
2.5.2 Secondary Research Sources
2.5.3 Assumptions
3 Market Trend Analysis
3.1 Introduction
3.2 Drivers
3.3 Restraints
3.4 Opportunities
3.5 Threats
3.6 Emerging Markets
3.7 Impact of Covid-19
4 Porters Five Force Analysis
4.1 Bargaining power of suppliers
4.2 Bargaining power of buyers
4.3 Threat of substitutes
4.4 Threat of new entrants
4.5 Competitive rivalry
5 Global Internet of Vehicle Market, By Component
5.1 Introduction
5.2 Hardware
5.3 Service
5.4 Software
6 Global Internet of Vehicle Market, By Networking Technology
6.1 Introduction
6.2 Bluetooth
6.3 Cellular
6.4 Wi-Fi
6.5 Other Networking Technologies
7 Global Internet of Vehicle Market, By Communication Type
7.1 Introduction
7.2 Vehicle-to-Infrastructure (V2I)
7.3 Vehicle-to-Vehicle (V2V)
7.4 Other Communication Types
8 Global Internet of Vehicle Market, By Geography
8.1 Introduction
8.2 North America
8.2.1 US
8.2.2 Canada
8.2.3 Mexico
8.3 Europe
8.3.1 Germany
8.3.2 UK
8.3.3 Italy
8.3.4 France
8.3.5 Spain
8.3.6 Rest of Europe
8.4 Asia Pacific
8.4.1 Japan
8.4.2 China
8.4.3 India
8.4.4 Australia
8.4.5 New Zealand
8.4.6 South Korea
8.4.7 Rest of Asia Pacific
8.5 South America
8.5.1 Argentina
8.5.2 Brazil
8.5.3 Chile
8.5.4 Rest of South America
8.6 Middle East & Africa
8.6.1 Saudi Arabia
8.6.2 UAE
8.6.3 Qatar
8.6.4 South Africa
8.6.5 Rest of Middle East & Africa
9 Key Developments
9.1 Agreements, Partnerships, Collaborations and Joint Ventures
9.2 Acquisitions & Mergers
9.3 New Product Launch
9.4 Expansions
9.5 Other Key Strategies
10 Company Profiling
10.1 Apple Inc.
10.2 Audi AG
10.3 Cisco Systems, Inc.
10.4 Cloud Your Car
10.5 Google LLC
10.6 Ford Motor Company
10.7 IBM Corporation
10.8 Intel Corporation
10.9 NXP Semiconductors
10.10 Texas Instruments
10.11 SAP SE
10.12 Veniam
10.13 Volkswagen
List of Tables
1 Global Internet of Vehicle Market Outlook, By Region (2020-2028) ($MN)
2 Global Internet of Vehicle Market Outlook, By Component (2020-2028) ($MN)
3 Global Internet of Vehicle Market Outlook, By Hardware (2020-2028) ($MN)
4 Global Internet of Vehicle Market Outlook, By Service (2020-2028) ($MN)
5 Global Internet of Vehicle Market Outlook, By Software (2020-2028) ($MN)
6 Global Internet of Vehicle Market Outlook, By Networking Technology (2020-2028) ($MN)
7 Global Internet of Vehicle Market Outlook, By Bluetooth (2020-2028) ($MN)
8 Global Internet of Vehicle Market Outlook, By Cellular (2020-2028) ($MN)
9 Global Internet of Vehicle Market Outlook, By Wi-Fi (2020-2028) ($MN)
10 Global Internet of Vehicle Market Outlook, By Other Networking Technologies (2020-2028) ($MN)
11 Global Internet of Vehicle Market Outlook, By Communication Type (2020-2028) ($MN)
12 Global Internet of Vehicle Market Outlook, By Vehicle-to-Infrastructure (V2I) (2020-2028) ($MN)
13 Global Internet of Vehicle Market Outlook, By Vehicle-to-Vehicle (V2V) (2020-2028) ($MN)
14 Global Internet of Vehicle Market Outlook, By Other Communication Types (2020-2028) ($MN)
15 North America Internet of Vehicle Market Outlook, By Country (2020-2028) ($MN)
16 North America Internet of Vehicle Market Outlook, By Component (2020-2028) ($MN)
17 North America Internet of Vehicle Market Outlook, By Hardware (2020-2028) ($MN)
18 North America Internet of Vehicle Market Outlook, By Service (2020-2028) ($MN)
19 North America Internet of Vehicle Market Outlook, By Software (2020-2028) ($MN)
20 North America Internet of Vehicle Market Outlook, By Networking Technology (2020-2028) ($MN)
21 North America Internet of Vehicle Market Outlook, By Bluetooth (2020-2028) ($MN)
22 North America Internet of Vehicle Market Outlook, By Cellular (2020-2028) ($MN)
23 North America Internet of Vehicle Market Outlook, By Wi-Fi (2020-2028) ($MN)
24 North America Internet of Vehicle Market Outlook, By Other Networking Technologies (2020-2028) ($MN)
25 North America Internet of Vehicle Market Outlook, By Communication Type (2020-2028) ($MN)
26 North America Internet of Vehicle Market Outlook, By Vehicle-to-Infrastructure (V2I) (2020-2028) ($MN)
27 North America Internet of Vehicle Market Outlook, By Vehicle-to-Vehicle (V2V) (2020-2028) ($MN)
28 North America Internet of Vehicle Market Outlook, By Other Communication Types (2020-2028) ($MN)
29 Europe Internet of Vehicle Market Outlook, By Country (2020-2028) ($MN)
30 Europe Internet of Vehicle Market Outlook, By Component (2020-2028) ($MN)
31 Europe Internet of Vehicle Market Outlook, By Hardware (2020-2028) ($MN)
32 Europe Internet of Vehicle Market Outlook, By Service (2020-2028) ($MN)
33 Europe Internet of Vehicle Market Outlook, By Software (2020-2028) ($MN)
34 Europe Internet of Vehicle Market Outlook, By Networking Technology (2020-2028) ($MN)
35 Europe Internet of Vehicle Market Outlook, By Bluetooth (2020-2028) ($MN)
36 Europe Internet of Vehicle Market Outlook, By Cellular (2020-2028) ($MN)
37 Europe Internet of Vehicle Market Outlook, By Wi-Fi (2020-2028) ($MN)
38 Europe Internet of Vehicle Market Outlook, By Other Networking Technologies (2020-2028) ($MN)
39 Europe Internet of Vehicle Market Outlook, By Communication Type (2020-2028) ($MN)
40 Europe Internet of Vehicle Market Outlook, By Vehicle-to-Infrastructure (V2I) (2020-2028) ($MN)
41 Europe Internet of Vehicle Market Outlook, By Vehicle-to-Vehicle (V2V) (2020-2028) ($MN)
42 Europe Internet of Vehicle Market Outlook, By Other Communication Types (2020-2028) ($MN)
43 Asia Pacific Internet of Vehicle Market Outlook, By Country (2020-2028) ($MN)
44 Asia Pacific Internet of Vehicle Market Outlook, By Component (2020-2028) ($MN)
45 Asia Pacific Internet of Vehicle Market Outlook, By Hardware (2020-2028) ($MN)
46 Asia Pacific Internet of Vehicle Market Outlook, By Service (2020-2028) ($MN)
47 Asia Pacific Internet of Vehicle Market Outlook, By Software (2020-2028) ($MN)
48 Asia Pacific Internet of Vehicle Market Outlook, By Networking Technology (2020-2028) ($MN)
49 Asia Pacific Internet of Vehicle Market Outlook, By Bluetooth (2020-2028) ($MN)
50 Asia Pacific Internet of Vehicle Market Outlook, By Cellular (2020-2028) ($MN)
51 Asia Pacific Internet of Vehicle Market Outlook, By Wi-Fi (2020-2028) ($MN)
52 Asia Pacific Internet of Vehicle Market Outlook, By Other Networking Technologies (2020-2028) ($MN)
53 Asia Pacific Internet of Vehicle Market Outlook, By Communication Type (2020-2028) ($MN)
54 Asia Pacific Internet of Vehicle Market Outlook, By Vehicle-to-Infrastructure (V2I) (2020-2028) ($MN)
55 Asia Pacific Internet of Vehicle Market Outlook, By Vehicle-to-Vehicle (V2V) (2020-2028) ($MN)
56 Asia Pacific Internet of Vehicle Market Outlook, By Other Communication Types (2020-2028) ($MN)
57 South America Internet of Vehicle Market Outlook, By Country (2020-2028) ($MN)
58 South America Internet of Vehicle Market Outlook, By Component (2020-2028) ($MN)
59 South America Internet of Vehicle Market Outlook, By Hardware (2020-2028) ($MN)
60 South America Internet of Vehicle Market Outlook, By Service (2020-2028) ($MN)
61 South America Internet of Vehicle Market Outlook, By Software (2020-2028) ($MN)
62 South America Internet of Vehicle Market Outlook, By Networking Technology (2020-2028) ($MN)
63 South America Internet of Vehicle Market Outlook, By Bluetooth (2020-2028) ($MN)
64 South America Internet of Vehicle Market Outlook, By Cellular (2020-2028) ($MN)
65 South America Internet of Vehicle Market Outlook, By Wi-Fi (2020-2028) ($MN)
66 South America Internet of Vehicle Market Outlook, By Other Networking Technologies (2020-2028) ($MN)
67 South America Internet of Vehicle Market Outlook, By Communication Type (2020-2028) ($MN)
68 South America Internet of Vehicle Market Outlook, By Vehicle-to-Infrastructure (V2I) (2020-2028) ($MN)
69 South America Internet of Vehicle Market Outlook, By Vehicle-to-Vehicle (V2V) (2020-2028) ($MN)
70 South America Internet of Vehicle Market Outlook, By Other Communication Types (2020-2028) ($MN)
71 Middle East & Africa Internet of Vehicle Market Outlook, By Country (2020-2028) ($MN)
72 Middle East & Africa Internet of Vehicle Market Outlook, By Component (2020-2028) ($MN)
73 Middle East & Africa Internet of Vehicle Market Outlook, By Hardware (2020-2028) ($MN)
74 Middle East & Africa Internet of Vehicle Market Outlook, By Service (2020-2028) ($MN)
75 Middle East & Africa Internet of Vehicle Market Outlook, By Software (2020-2028) ($MN)
76 Middle East & Africa Internet of Vehicle Market Outlook, By Networking Technology (2020-2028) ($MN)
77 Middle East & Africa Internet of Vehicle Market Outlook, By Bluetooth (2020-2028) ($MN)
78 Middle East & Africa Internet of Vehicle Market Outlook, By Cellular (2020-2028) ($MN)
79 Middle East & Africa Internet of Vehicle Market Outlook, By Wi-Fi (2020-2028) ($MN)
80 Middle East & Africa Internet of Vehicle Market Outlook, By Other Networking Technologies (2020-2028) ($MN)
81 Middle East & Africa Internet of Vehicle Market Outlook, By Communication Type (2020-2028) ($MN)
82 Middle East & Africa Internet of Vehicle Market Outlook, By Vehicle-to-Infrastructure (V2I) (2020-2028) ($MN)
83 Middle East & Africa Internet of Vehicle Market Outlook, By Vehicle-to-Vehicle (V2V) (2020-2028) ($MN)
84 Middle East & Africa Internet of Vehicle Market Outlook, By Other Communication Types (2020-2028) ($MN)
List of Figures
RESEARCH METHODOLOGY

We at ‘Stratistics’ opt for an extensive research approach which involves data mining, data validation, and data analysis. The various research sources include in-house repository, secondary research, competitor’s sources, social media research, client internal data, and primary research.
Our team of analysts prefers the most reliable and authenticated data sources in order to perform the comprehensive literature search. With access to most of the authenticated data bases our team highly considers the best mix of information through various sources to obtain extensive and accurate analysis.
Each report takes an average time of a month and a team of 4 industry analysts. The time may vary depending on the scope and data availability of the desired market report. The various parameters used in the market assessment are standardized in order to enhance the data accuracy.
Data Mining
The data is collected from several authenticated, reliable, paid and unpaid sources and is filtered depending on the scope & objective of the research. Our reports repository acts as an added advantage in this procedure. Data gathering from the raw material suppliers, distributors and the manufacturers is performed on a regular basis, this helps in the comprehensive understanding of the products value chain. Apart from the above mentioned sources the data is also collected from the industry consultants to ensure the objective of the study is in the right direction.
Market trends such as technological advancements, regulatory affairs, market dynamics (Drivers, Restraints, Opportunities and Challenges) are obtained from scientific journals, market related national & international associations and organizations.
Data Analysis
From the data that is collected depending on the scope & objective of the research the data is subjected for the analysis. The critical steps that we follow for the data analysis include:
- Product Lifecycle Analysis
- Competitor analysis
- Risk analysis
- Porters Analysis
- PESTEL Analysis
- SWOT Analysis
The data engineering is performed by the core industry experts considering both the Marketing Mix Modeling and the Demand Forecasting. The marketing mix modeling makes use of multiple-regression techniques to predict the optimal mix of marketing variables. Regression factor is based on a number of variables and how they relate to an outcome such as sales or profits.
Data Validation
The data validation is performed by the exhaustive primary research from the expert interviews. This includes telephonic interviews, focus groups, face to face interviews, and questionnaires to validate our research from all aspects. The industry experts we approach come from the leading firms, involved in the supply chain ranging from the suppliers, distributors to the manufacturers and consumers so as to ensure an unbiased analysis.
We are in touch with more than 15,000 industry experts with the right mix of consultants, CEO's, presidents, vice presidents, managers, experts from both supply side and demand side, executives and so on.
The data validation involves the primary research from the industry experts belonging to:
- Leading Companies
- Suppliers & Distributors
- Manufacturers
- Consumers
- Industry/Strategic Consultants
Apart from the data validation the primary research also helps in performing the fill gap research, i.e. providing solutions for the unmet needs of the research which helps in enhancing the reports quality.
For more details about research methodology, kindly write to us at info@strategymrc.com
Frequently Asked Questions
In case of any queries regarding this report, you can contact the customer service by filing the “Inquiry Before Buy” form available on the right hand side. You may also contact us through email: info@strategymrc.com or phone: +1-301-202-5929
Yes, the samples are available for all the published reports. You can request them by filling the “Request Sample” option available in this page.
Yes, you can request a sample with your specific requirements. All the customized samples will be provided as per the requirement with the real data masked.
All our reports are available in Digital PDF format. In case if you require them in any other formats, such as PPT, Excel etc you can submit a request through “Inquiry Before Buy” form available on the right hand side. You may also contact us through email: info@strategymrc.com or phone: +1-301-202-5929
We offer a free 15% customization with every purchase. This requirement can be fulfilled for both pre and post sale. You may send your customization requirements through email at info@strategymrc.com or call us on +1-301-202-5929.
We have 3 different licensing options available in electronic format.
- Single User Licence: Allows one person, typically the buyer, to have access to the ordered product. The ordered product cannot be distributed to anyone else.
- 2-5 User Licence: Allows the ordered product to be shared among a maximum of 5 people within your organisation.
- Corporate License: Allows the product to be shared among all employees of your organisation regardless of their geographical location.
All our reports are typically be emailed to you as an attachment.
To order any available report you need to register on our website. The payment can be made either through CCAvenue or PayPal payments gateways which accept all international cards.
We extend our support to 6 months post sale. A post sale customization is also provided to cover your unmet needs in the report.
Request Customization
We offer complimentary customization of up to 15% with every purchase. To share your customization requirements, feel free to email us at info@strategymrc.com or call us on +1-301-202-5929. .
Please Note: Customization within the 15% threshold is entirely free of charge. If your request exceeds this limit, we will conduct a feasibility assessment. Following that, a detailed quote and timeline will be provided.
WHY CHOOSE US ?

Assured Quality
Best in class reports with high standard of research integrity

24X7 Research Support
Continuous support to ensure the best customer experience.

Free Customization
Adding more values to your product of interest.

Safe & Secure Access
Providing a secured environment for all online transactions.

Trusted by 600+ Brands
Serving the most reputed brands across the world.