
Large Industrial Displays Market
Large Industrial Displays Market Forecasts to 2028 – Global Analysis By Size (20”-40”, Above 40”), Product Type (Open Frame Displays, Panel Mount Displays), Technology (Liquid Crystal Display (LCD), Light Emitting Diode (LED)), and By Geography

|
Years Covered |
2020-2028 |
|
Estimated Year Value (2021) |
US $2.65 BN |
|
Projected Year Value (2028) |
US $3.98 BN |
|
CAGR (2021 - 2028) |
6.0% |
|
Regions Covered |
North America, Europe, Asia Pacific, South America, and Middle East & Africa |
|
Countries Covered |
US, Canada, Mexico, Germany, UK, Italy, France, Spain, Japan, China, India, Australia, New Zealand, South Korea, Rest of Asia Pacific, South America, Argentina, Brazil, Chile, Middle East & Africa, Saudi Arabia, UAE, Qatar, and South Africa |
|
Largest Market |
North America |
|
Highest Growing Market |
Asia Pacific |
According to Stratistics MRC, the Global Large Industrial Displays Market is accounted for $2.65 billion in 2021 and is expected to reach $3.98 billion by 2028 growing at a CAGR of 6.0% during the forecast period. Large industrial displays refer to displays used in industrial control processes or equipment. It adopts industrial-grade liquid crystal display, which can adapt to extreme environment, high price, stable operation and long service life. Thinner, larger industrial displays exceed their wider equivalents in terms of performance, resolution, and space consumption, greatly increasing the productivity of real-time data visibility.
Market Dynamics:
Driver:
Meeting diverse visual display demand in industrial environments
As the billboard industry continues to face the heat of environmental regulations, the large industrial displays remain sought-after as they provide an effective means of communication. Furthermore, as industrial robotics and automation is gathering pace, high-performance large industrial displays are becoming a necessity for visibility of real-time data that drives productivity. Surging demand for human-machine interface devices to monitor manufacturing processes is likely to impart a new dimension to applications of large industrial displays. Design differentiation will remain a key focus area for manufacturers, aiming sales closure, which has initiated the entry of a series of new-age displays - flexible, foldable, and slimmer.
Restraint:
Negative effects of OLEDs
OLEDs are ideal for devices like mobile phones, as consumers are likely to change these regularly, which is less likely with a bigger purchase, like a television. The organic materials used in OLEDs are affected by the environment, they’re sensitive to moisture and screen discoloration occurs if subjected to direct sunlight and heat. However, while the positives of OLED technology are many, its list of negatives is quite stark. Issues with heat, moisture, loss of brightness, pixel burnout and expense to the customer, soon take away from its positives.
Opportunity:
Emerging applications of flexible displays
New grounds within industries are evolving the addition of electronics and technologies for the development of the large industrial displays market. The consumer preference towards a single board computer integration i.e. all-in-one concept and a user-friendly touch monitor, is designed to serve as a reliable and flexible platform, which is anticipated to result in the healthy growth of the large industrial displays market.
Threat:
Battle of adoption’ from ‘screen-less
It has been observed, recently, that slimmer large industrial displays beat their wider equivalents in terms of performance, resolution, and space consumption, which enhances their degree of marketability. As end users’ quest for optimizing manufacturing capabilities can be better met with slim-framed large industrial displays, their adoption is likely to remain high in key industries, such as automotive & transportation, and electrical & electronics. However, large industrial displays are likely to face the ‘battle of adoption’ from the latest breakthrough technology, i.e. screen-less displays 4k display resolution and projectors. With massive energy demands of large industrial displays, it is highly likely that the ‘screen-less’ will pose strong competition to both, large displays and touchscreen displays.
The organic light emitting diode (OLED) segment is expected to be the largest during the forecast period
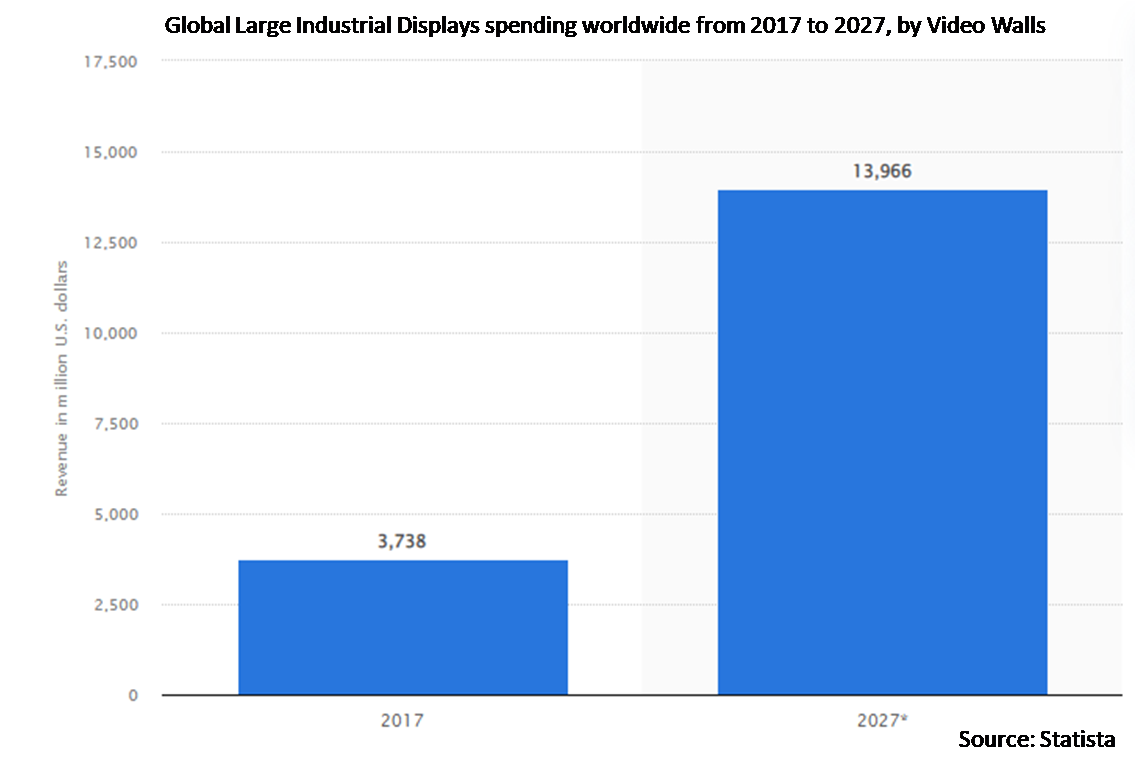
The organic light emitting diode (OLED) segment is estimated to have a lucrative growth. The increasing demand for video walls can be directly related to the global development of the OLED technology. The growing influences such as green technology and safety security concerns are anticipated to boost the development of the large industrial displays market. Manufacturers are continuously enhancing and refining their pipeline competencies and its well-established existence in the large industrial displays market by introducing new technology OLED products. Besides digital signage, the lightweight OLEDs are also marking a flourishing trend in the large industrial displays market.
The oil & gas segment is expected to have the highest CAGR during the forecast period
The oil & gas segment is anticipated to witness the fastest CAGR growth during the forecast period. The oil and gas has played a vital role in the economic transformation of the world, but the industry is on the cusp of a new era. Digital transformation can deliver increased operational efficiency and workplace safety, as well as minimize the environmental impact of the industry. Large industrial displays are especially significant in the oil & gas industry where understanding rough ambient conditions, extreme temperatures, a high degree of pollution and operation is not only a key primarily to safety but also to improving profitability.
Region with largest share:
North America is projected to hold the largest market share during the forecast period. The U.S. and Canada have been, and will continue to spectate the growth in the manufacturing capabilities of numerous industries, as innovation drives automation and advancement in the landscape. The requirement for high clarity megapixel display screens and technological advancements has fueled the large industrial display system market in North America. The rising demand for industrial display monitors makes North America the leading holder of industrial display system industry share.
Region with highest CAGR:
Asia Pacific is projected to have the highest CAGR over the forecast period. China accounted largest market share due to presence of major manufacturers of large industrial displays in the country. As foreign investments move towards developing countries, demand for automation and IoT is likely to influence sales of large industrial displays in East Asia. Besides, the growing demand for consumer electronics and the shift in preferences of the people towards smart home and smart office environments, the rise in disposable incomes of the population is also majorly driving growth in the large industrial display market.

Key players in the market:
Some of the key players profiled in the Large Industrial Displays Market include Arista Corporation, Axiomtek, AU Optronics, BOE Technology Group, Daktronics, Elo Touch Solutions, IP Displays, Neuro Logic Display, Kontron, NEC Display Solutions, Pro-face, Samsung, Sharp, Sparton Corporation, and Winmate.
Key Developments:
In January 2020, Axiomtek introduced the GOT115-319, a 15-inch fanless touch panel computer with a thickness of only 50 mm to use in space-constrained environments. It is powered by the Intel Celeron processor N3350 or Intel Pentium processor N4200 with the Intel GFX controller onboard.
In July 2019, Neuro Logic Display launched the new PM-10.1-DVI-28 rugged display, which is designed and certified for installation in military aircraft. To meet the challenging lighting conditions common in a military aircraft cockpit, the PM-10.1-DVI-28 features a Dual-Mode, High-Brite/NVIS backlight system with luminance adjustment from 1300 cd/m2 for visibility in glaring direct sunlight conditions, down to <0.5 cd/m2 for night time NVIS compatible conditions suitable for viewing with NVGs.
Sizes Covered:
• 20”-40”
• Above 40”
Product Types Covered:
• Open Frame Displays
• Panel Mount Displays
• Industrial Monitors
• Video Walls
Technologies Covered:
• Liquid Crystal Display (LCD)
• Light Emitting Diode (LED)
• Organic Light Emitting Diode (OLED)
End Users Covered:
• Discrete Manufacturing
• Process Manufacturing
• Oil & Gas
• Industrial Energy
Regions Covered:
• North America
o US
o Canada
o Mexico
• Europe
o Germany
o UK
o Italy
o France
o Spain
o Rest of Europe
• Asia Pacific
o Japan
o China
o India
o Australia
o New Zealand
o South Korea
o Rest of Asia Pacific
• South America
o Argentina
o Brazil
o Chile
o Rest of South America
• Middle East & Africa
o Saudi Arabia
o UAE
o Qatar
o South Africa
o Rest of Middle East & Africa
What our report offers:
- Market share assessments for the regional and country-level segments
- Strategic recommendations for the new entrants
- Covers Market data for the years 2020, 2021, 2022, 2025, and 2028
- Market Trends (Drivers, Constraints, Opportunities, Threats, Challenges, Investment Opportunities, and recommendations)
- Strategic recommendations in key business segments based on the market estimations
- Competitive landscaping mapping the key common trends
- Company profiling with detailed strategies, financials, and recent developments
- Supply chain trends mapping the latest technological advancements
Free Customization Offerings:
All the customers of this report will be entitled to receive one of the following free customization options:
• Company Profiling
o Comprehensive profiling of additional market players (up to 3)
o SWOT Analysis of key players (up to 3)
• Regional Segmentation
o Market estimations, Forecasts and CAGR of any prominent country as per the client's interest (Note: Depends on feasibility check)
• Competitive Benchmarking
o Benchmarking of key players based on product portfolio, geographical presence, and strategic alliances
Table of Contents
1 Executive Summary
2 Preface
2.1 Abstract
2.2 Stake Holders
2.3 Research Scope
2.4 Research Methodology
2.4.1 Data Mining
2.4.2 Data Analysis
2.4.3 Data Validation
2.4.4 Research Approach
2.5 Research Sources
2.5.1 Primary Research Sources
2.5.2 Secondary Research Sources
2.5.3 Assumptions
3 Market Trend Analysis
3.1 Introduction
3.2 Drivers
3.3 Restraints
3.4 Opportunities
3.5 Threats
3.6 Product Analysis
3.7 Technology Analysis
3.8 End User Analysis
3.9 Emerging Markets
3.10 Impact of Covid-19
4 Porters Five Force Analysis
4.1 Bargaining power of suppliers
4.2 Bargaining power of buyers
4.3 Threat of substitutes
4.4 Threat of new entrants
4.5 Competitive rivalry
5 Global Large Industrial Displays Market, By Size
5.1 Introduction
5.2 20”-40”
5.3 Above 40”
6 Global Large Industrial Displays Market, By Product Type
6.1 Introduction
6.2 Open Frame Displays
6.3 Panel Mount Displays
6.4 Industrial Monitors
6.5 Video Walls
6.5.1 Less than 6 Screens
6.5.2 Above 6 Screens
7 Global Large Industrial Displays Market, By Technology
7.1 Introduction
7.2 Liquid Crystal Display (LCD)
7.3 Light Emitting Diode (LED)
7.4 Organic Light Emitting Diode (OLED)
8 Global Large Industrial Displays Market, By End User
8.1 Introduction
8.2 Discrete Manufacturing
8.2.1 Automotive and Transportation
8.2.2 General Manufacturing
8.2.3 Electronics & Electricals
8.3 Process Manufacturing
8.3.1 Chemicals & Pharmaceutical
8.3.2 Food & Beverage
8.4 Oil & Gas
8.5 Industrial Energy
9 Global Large Industrial Displays Market, By Geography
9.1 Introduction
9.2 North America
9.2.1 US
9.2.2 Canada
9.2.3 Mexico
9.3 Europe
9.3.1 Germany
9.3.2 UK
9.3.3 Italy
9.3.4 France
9.3.5 Spain
9.3.6 Rest of Europe
9.4 Asia Pacific
9.4.1 Japan
9.4.2 China
9.4.3 India
9.4.4 Australia
9.4.5 New Zealand
9.4.6 South Korea
9.4.7 Rest of Asia Pacific
9.5 South America
9.5.1 Argentina
9.5.2 Brazil
9.5.3 Chile
9.5.4 Rest of South America
9.6 Middle East & Africa
9.6.1 Saudi Arabia
9.6.2 UAE
9.6.3 Qatar
9.6.4 South Africa
9.6.5 Rest of Middle East & Africa
10 Key Developments
10.1 Agreements, Partnerships, Collaborations and Joint Ventures
10.2 Acquisitions & Mergers
10.3 New Product Launch
10.4 Expansions
10.5 Other Key Strategies
11 Company Profiling
11.1 Arista Corporation
11.2 Axiomtek
11.3 AU Optronics
11.4 BOE Technology Group
11.5 Daktronics
11.6 Elo Touch Solutions
11.7 IP Displays
11.8 Neuro Logic Display
11.9 Kontron
11.10 NEC Display Solutions
11.11 Pro-face
11.12 Samsung
11.13 Sharp
11.14 Sparton Corporation
11.15 Winmate
List of Tables
1 Global Large Industrial Displays Market Outlook, By Region (2019-2028) ($MN)
2 Global Large Industrial Displays Market Outlook, By Size (2019-2028) ($MN)
3 Global Large Industrial Displays Market Outlook, By 20”-40” (2019-2028) ($MN)
4 Global Large Industrial Displays Market Outlook, By Above 40” (2019-2028) ($MN)
5 Global Large Industrial Displays Market Outlook, By Product Type (2019-2028) ($MN)
6 Global Large Industrial Displays Market Outlook, By Open Frame Displays (2019-2028) ($MN)
7 Global Large Industrial Displays Market Outlook, By Panel Mount Displays (2019-2028) ($MN)
8 Global Large Industrial Displays Market Outlook, By Industrial Monitors (2019-2028) ($MN)
9 Global Large Industrial Displays Market Outlook, By Video Walls (2019-2028) ($MN)
10 Global Large Industrial Displays Market Outlook, By Less than 6 Screens (2019-2028) ($MN)
11 Global Large Industrial Displays Market Outlook, By Above 6 Screens (2019-2028) ($MN)
12 Global Large Industrial Displays Market Outlook, By Technology (2019-2028) ($MN)
13 Global Large Industrial Displays Market Outlook, By Liquid Crystal Display (LCD) (2019-2028) ($MN)
14 Global Large Industrial Displays Market Outlook, By Light Emitting Diode (LED) (2019-2028) ($MN)
15 Global Large Industrial Displays Market Outlook, By Organic Light Emitting Diode (OLED) (2019-2028) ($MN)
16 Global Large Industrial Displays Market Outlook, By End User (2019-2028) ($MN)
17 Global Large Industrial Displays Market Outlook, By Discrete Manufacturing (2019-2028) ($MN)
18 Global Large Industrial Displays Market Outlook, By Automotive and Transportation (2019-2028) ($MN)
19 Global Large Industrial Displays Market Outlook, By General Manufacturing (2019-2028) ($MN)
20 Global Large Industrial Displays Market Outlook, By Electronics & Electricals (2019-2028) ($MN)
21 Global Large Industrial Displays Market Outlook, By Process Manufacturing (2019-2028) ($MN)
22 Global Large Industrial Displays Market Outlook, By Chemicals & Pharmaceutical (2019-2028) ($MN)
23 Global Large Industrial Displays Market Outlook, By Food & Beverage (2019-2028) ($MN)
24 Global Large Industrial Displays Market Outlook, By Oil & Gas (2019-2028) ($MN)
25 Global Large Industrial Displays Market Outlook, By Industrial Energy (2019-2028) ($MN)
26 North America Large Industrial Displays Market Outlook, By Country (2019-2028) ($MN)
27 North America Large Industrial Displays Market Outlook, By Size (2019-2028) ($MN)
28 North America Large Industrial Displays Market Outlook, By 20”-40” (2019-2028) ($MN)
29 North America Large Industrial Displays Market Outlook, By Above 40” (2019-2028) ($MN)
30 North America Large Industrial Displays Market Outlook, By Product Type (2019-2028) ($MN)
31 North America Large Industrial Displays Market Outlook, By Open Frame Displays (2019-2028) ($MN)
32 North America Large Industrial Displays Market Outlook, By Panel Mount Displays (2019-2028) ($MN)
33 North America Large Industrial Displays Market Outlook, By Industrial Monitors (2019-2028) ($MN)
34 North America Large Industrial Displays Market Outlook, By Video Walls (2019-2028) ($MN)
35 North America Large Industrial Displays Market Outlook, By Less than 6 Screens (2019-2028) ($MN)
36 North America Large Industrial Displays Market Outlook, By Above 6 Screens (2019-2028) ($MN)
37 North America Large Industrial Displays Market Outlook, By Technology (2019-2028) ($MN)
38 North America Large Industrial Displays Market Outlook, By Liquid Crystal Display (LCD) (2019-2028) ($MN)
39 North America Large Industrial Displays Market Outlook, By Light Emitting Diode (LED) (2019-2028) ($MN)
40 North America Large Industrial Displays Market Outlook, By Organic Light Emitting Diode (OLED) (2019-2028) ($MN)
41 North America Large Industrial Displays Market Outlook, By End User (2019-2028) ($MN)
42 North America Large Industrial Displays Market Outlook, By Discrete Manufacturing (2019-2028) ($MN)
43 North America Large Industrial Displays Market Outlook, By Automotive and Transportation (2019-2028) ($MN)
44 North America Large Industrial Displays Market Outlook, By General Manufacturing (2019-2028) ($MN)
45 North America Large Industrial Displays Market Outlook, By Electronics & Electricals (2019-2028) ($MN)
46 North America Large Industrial Displays Market Outlook, By Process Manufacturing (2019-2028) ($MN)
47 North America Large Industrial Displays Market Outlook, By Chemicals & Pharmaceutical (2019-2028) ($MN)
48 North America Large Industrial Displays Market Outlook, By Food & Beverage (2019-2028) ($MN)
49 North America Large Industrial Displays Market Outlook, By Oil & Gas (2019-2028) ($MN)
50 North America Large Industrial Displays Market Outlook, By Industrial Energy (2019-2028) ($MN)
51 Europe Large Industrial Displays Market Outlook, By Country (2019-2028) ($MN)
52 Europe Large Industrial Displays Market Outlook, By Size (2019-2028) ($MN)
53 Europe Large Industrial Displays Market Outlook, By 20”-40” (2019-2028) ($MN)
54 Europe Large Industrial Displays Market Outlook, By Above 40” (2019-2028) ($MN)
55 Europe Large Industrial Displays Market Outlook, By Product Type (2019-2028) ($MN)
56 Europe Large Industrial Displays Market Outlook, By Open Frame Displays (2019-2028) ($MN)
57 Europe Large Industrial Displays Market Outlook, By Panel Mount Displays (2019-2028) ($MN)
58 Europe Large Industrial Displays Market Outlook, By Industrial Monitors (2019-2028) ($MN)
59 Europe Large Industrial Displays Market Outlook, By Video Walls (2019-2028) ($MN)
60 Europe Large Industrial Displays Market Outlook, By Less than 6 Screens (2019-2028) ($MN)
61 Europe Large Industrial Displays Market Outlook, By Above 6 Screens (2019-2028) ($MN)
62 Europe Large Industrial Displays Market Outlook, By Technology (2019-2028) ($MN)
63 Europe Large Industrial Displays Market Outlook, By Liquid Crystal Display (LCD) (2019-2028) ($MN)
64 Europe Large Industrial Displays Market Outlook, By Light Emitting Diode (LED) (2019-2028) ($MN)
65 Europe Large Industrial Displays Market Outlook, By Organic Light Emitting Diode (OLED) (2019-2028) ($MN)
66 Europe Large Industrial Displays Market Outlook, By End User (2019-2028) ($MN)
67 Europe Large Industrial Displays Market Outlook, By Discrete Manufacturing (2019-2028) ($MN)
68 Europe Large Industrial Displays Market Outlook, By Automotive and Transportation (2019-2028) ($MN)
69 Europe Large Industrial Displays Market Outlook, By General Manufacturing (2019-2028) ($MN)
70 Europe Large Industrial Displays Market Outlook, By Electronics & Electricals (2019-2028) ($MN)
71 Europe Large Industrial Displays Market Outlook, By Process Manufacturing (2019-2028) ($MN)
72 Europe Large Industrial Displays Market Outlook, By Chemicals & Pharmaceutical (2019-2028) ($MN)
73 Europe Large Industrial Displays Market Outlook, By Food & Beverage (2019-2028) ($MN)
74 Europe Large Industrial Displays Market Outlook, By Oil & Gas (2019-2028) ($MN)
75 Europe Large Industrial Displays Market Outlook, By Industrial Energy (2019-2028) ($MN)
76 Asia Pacific Large Industrial Displays Market Outlook, By Country (2019-2028) ($MN)
77 Asia Pacific Large Industrial Displays Market Outlook, By Size (2019-2028) ($MN)
78 Asia Pacific Large Industrial Displays Market Outlook, By 20”-40” (2019-2028) ($MN)
79 Asia Pacific Large Industrial Displays Market Outlook, By Above 40” (2019-2028) ($MN)
80 Asia Pacific Large Industrial Displays Market Outlook, By Product Type (2019-2028) ($MN)
81 Asia Pacific Large Industrial Displays Market Outlook, By Open Frame Displays (2019-2028) ($MN)
82 Asia Pacific Large Industrial Displays Market Outlook, By Panel Mount Displays (2019-2028) ($MN)
83 Asia Pacific Large Industrial Displays Market Outlook, By Industrial Monitors (2019-2028) ($MN)
84 Asia Pacific Large Industrial Displays Market Outlook, By Video Walls (2019-2028) ($MN)
85 Asia Pacific Large Industrial Displays Market Outlook, By Less than 6 Screens (2019-2028) ($MN)
86 Asia Pacific Large Industrial Displays Market Outlook, By Above 6 Screens (2019-2028) ($MN)
87 Asia Pacific Large Industrial Displays Market Outlook, By Technology (2019-2028) ($MN)
88 Asia Pacific Large Industrial Displays Market Outlook, By Liquid Crystal Display (LCD) (2019-2028) ($MN)
89 Asia Pacific Large Industrial Displays Market Outlook, By Light Emitting Diode (LED) (2019-2028) ($MN)
90 Asia Pacific Large Industrial Displays Market Outlook, By Organic Light Emitting Diode (OLED) (2019-2028) ($MN)
91 Asia Pacific Large Industrial Displays Market Outlook, By End User (2019-2028) ($MN)
92 Asia Pacific Large Industrial Displays Market Outlook, By Discrete Manufacturing (2019-2028) ($MN)
93 Asia Pacific Large Industrial Displays Market Outlook, By Automotive and Transportation (2019-2028) ($MN)
94 Asia Pacific Large Industrial Displays Market Outlook, By General Manufacturing (2019-2028) ($MN)
95 Asia Pacific Large Industrial Displays Market Outlook, By Electronics & Electricals (2019-2028) ($MN)
96 Asia Pacific Large Industrial Displays Market Outlook, By Process Manufacturing (2019-2028) ($MN)
97 Asia Pacific Large Industrial Displays Market Outlook, By Chemicals & Pharmaceutical (2019-2028) ($MN)
98 Asia Pacific Large Industrial Displays Market Outlook, By Food & Beverage (2019-2028) ($MN)
99 Asia Pacific Large Industrial Displays Market Outlook, By Oil & Gas (2019-2028) ($MN)
100 Asia Pacific Large Industrial Displays Market Outlook, By Industrial Energy (2019-2028) ($MN)
101 South America Large Industrial Displays Market Outlook, By Country (2019-2028) ($MN)
102 South America Large Industrial Displays Market Outlook, By Size (2019-2028) ($MN)
103 South America Large Industrial Displays Market Outlook, By 20”-40” (2019-2028) ($MN)
104 South America Large Industrial Displays Market Outlook, By Above 40” (2019-2028) ($MN)
105 South America Large Industrial Displays Market Outlook, By Product Type (2019-2028) ($MN)
106 South America Large Industrial Displays Market Outlook, By Open Frame Displays (2019-2028) ($MN)
107 South America Large Industrial Displays Market Outlook, By Panel Mount Displays (2019-2028) ($MN)
108 South America Large Industrial Displays Market Outlook, By Industrial Monitors (2019-2028) ($MN)
109 South America Large Industrial Displays Market Outlook, By Video Walls (2019-2028) ($MN)
110 South America Large Industrial Displays Market Outlook, By Less than 6 Screens (2019-2028) ($MN)
111 South America Large Industrial Displays Market Outlook, By Above 6 Screens (2019-2028) ($MN)
112 South America Large Industrial Displays Market Outlook, By Technology (2019-2028) ($MN)
113 South America Large Industrial Displays Market Outlook, By Liquid Crystal Display (LCD) (2019-2028) ($MN)
114 South America Large Industrial Displays Market Outlook, By Light Emitting Diode (LED) (2019-2028) ($MN)
115 South America Large Industrial Displays Market Outlook, By Organic Light Emitting Diode (OLED) (2019-2028) ($MN)
116 South America Large Industrial Displays Market Outlook, By End User (2019-2028) ($MN)
117 South America Large Industrial Displays Market Outlook, By Discrete Manufacturing (2019-2028) ($MN)
118 South America Large Industrial Displays Market Outlook, By Automotive and Transportation (2019-2028) ($MN)
119 South America Large Industrial Displays Market Outlook, By General Manufacturing (2019-2028) ($MN)
120 South America Large Industrial Displays Market Outlook, By Electronics & Electricals (2019-2028) ($MN)
121 South America Large Industrial Displays Market Outlook, By Process Manufacturing (2019-2028) ($MN)
122 South America Large Industrial Displays Market Outlook, By Chemicals & Pharmaceutical (2019-2028) ($MN)
123 South America Large Industrial Displays Market Outlook, By Food & Beverage (2019-2028) ($MN)
124 South America Large Industrial Displays Market Outlook, By Oil & Gas (2019-2028) ($MN)
125 South America Large Industrial Displays Market Outlook, By Industrial Energy (2019-2028) ($MN)
126 Middle East & Africa Large Industrial Displays Market Outlook, By Country (2019-2028) ($MN)
127 Middle East & Africa Large Industrial Displays Market Outlook, By Size (2019-2028) ($MN)
128 Middle East & Africa Large Industrial Displays Market Outlook, By 20”-40” (2019-2028) ($MN)
129 Middle East & Africa Large Industrial Displays Market Outlook, By Above 40” (2019-2028) ($MN)
130 Middle East & Africa Large Industrial Displays Market Outlook, By Product Type (2019-2028) ($MN)
131 Middle East & Africa Large Industrial Displays Market Outlook, By Open Frame Displays (2019-2028) ($MN)
132 Middle East & Africa Large Industrial Displays Market Outlook, By Panel Mount Displays (2019-2028) ($MN)
133 Middle East & Africa Large Industrial Displays Market Outlook, By Industrial Monitors (2019-2028) ($MN)
134 Middle East & Africa Large Industrial Displays Market Outlook, By Video Walls (2019-2028) ($MN)
135 Middle East & Africa Large Industrial Displays Market Outlook, By Less than 6 Screens (2019-2028) ($MN)
136 Middle East & Africa Large Industrial Displays Market Outlook, By Above 6 Screens (2019-2028) ($MN)
137 Middle East & Africa Large Industrial Displays Market Outlook, By Technology (2019-2028) ($MN)
138 Middle East & Africa Large Industrial Displays Market Outlook, By Liquid Crystal Display (LCD) (2019-2028) ($MN)
139 Middle East & Africa Large Industrial Displays Market Outlook, By Light Emitting Diode (LED) (2019-2028) ($MN)
140 Middle East & Africa Large Industrial Displays Market Outlook, By Organic Light Emitting Diode (OLED) (2019-2028) ($MN)
141 Middle East & Africa Large Industrial Displays Market Outlook, By End User (2019-2028) ($MN)
142 Middle East & Africa Large Industrial Displays Market Outlook, By Discrete Manufacturing (2019-2028) ($MN)
143 Middle East & Africa Large Industrial Displays Market Outlook, By Automotive and Transportation (2019-2028) ($MN)
144 Middle East & Africa Large Industrial Displays Market Outlook, By General Manufacturing (2019-2028) ($MN)
145 Middle East & Africa Large Industrial Displays Market Outlook, By Electronics & Electricals (2019-2028) ($MN)
146 Middle East & Africa Large Industrial Displays Market Outlook, By Process Manufacturing (2019-2028) ($MN)
147 Middle East & Africa Large Industrial Displays Market Outlook, By Chemicals & Pharmaceutical (2019-2028) ($MN)
148 Middle East & Africa Large Industrial Displays Market Outlook, By Food & Beverage (2019-2028) ($MN)
149 Middle East & Africa Large Industrial Displays Market Outlook, By Oil & Gas (2019-2028) ($MN)
150 Middle East & Africa Large Industrial Displays Market Outlook, By Industrial Energy (2019-2028) ($MN)
List of Figures
RESEARCH METHODOLOGY

We at ‘Stratistics’ opt for an extensive research approach which involves data mining, data validation, and data analysis. The various research sources include in-house repository, secondary research, competitor’s sources, social media research, client internal data, and primary research.
Our team of analysts prefers the most reliable and authenticated data sources in order to perform the comprehensive literature search. With access to most of the authenticated data bases our team highly considers the best mix of information through various sources to obtain extensive and accurate analysis.
Each report takes an average time of a month and a team of 4 industry analysts. The time may vary depending on the scope and data availability of the desired market report. The various parameters used in the market assessment are standardized in order to enhance the data accuracy.
Data Mining
The data is collected from several authenticated, reliable, paid and unpaid sources and is filtered depending on the scope & objective of the research. Our reports repository acts as an added advantage in this procedure. Data gathering from the raw material suppliers, distributors and the manufacturers is performed on a regular basis, this helps in the comprehensive understanding of the products value chain. Apart from the above mentioned sources the data is also collected from the industry consultants to ensure the objective of the study is in the right direction.
Market trends such as technological advancements, regulatory affairs, market dynamics (Drivers, Restraints, Opportunities and Challenges) are obtained from scientific journals, market related national & international associations and organizations.
Data Analysis
From the data that is collected depending on the scope & objective of the research the data is subjected for the analysis. The critical steps that we follow for the data analysis include:
- Product Lifecycle Analysis
- Competitor analysis
- Risk analysis
- Porters Analysis
- PESTEL Analysis
- SWOT Analysis
The data engineering is performed by the core industry experts considering both the Marketing Mix Modeling and the Demand Forecasting. The marketing mix modeling makes use of multiple-regression techniques to predict the optimal mix of marketing variables. Regression factor is based on a number of variables and how they relate to an outcome such as sales or profits.
Data Validation
The data validation is performed by the exhaustive primary research from the expert interviews. This includes telephonic interviews, focus groups, face to face interviews, and questionnaires to validate our research from all aspects. The industry experts we approach come from the leading firms, involved in the supply chain ranging from the suppliers, distributors to the manufacturers and consumers so as to ensure an unbiased analysis.
We are in touch with more than 15,000 industry experts with the right mix of consultants, CEO's, presidents, vice presidents, managers, experts from both supply side and demand side, executives and so on.
The data validation involves the primary research from the industry experts belonging to:
- Leading Companies
- Suppliers & Distributors
- Manufacturers
- Consumers
- Industry/Strategic Consultants
Apart from the data validation the primary research also helps in performing the fill gap research, i.e. providing solutions for the unmet needs of the research which helps in enhancing the reports quality.
For more details about research methodology, kindly write to us at info@strategymrc.com
Frequently Asked Questions
In case of any queries regarding this report, you can contact the customer service by filing the “Inquiry Before Buy” form available on the right hand side. You may also contact us through email: info@strategymrc.com or phone: +1-301-202-5929
Yes, the samples are available for all the published reports. You can request them by filling the “Request Sample” option available in this page.
Yes, you can request a sample with your specific requirements. All the customized samples will be provided as per the requirement with the real data masked.
All our reports are available in Digital PDF format. In case if you require them in any other formats, such as PPT, Excel etc you can submit a request through “Inquiry Before Buy” form available on the right hand side. You may also contact us through email: info@strategymrc.com or phone: +1-301-202-5929
We offer a free 15% customization with every purchase. This requirement can be fulfilled for both pre and post sale. You may send your customization requirements through email at info@strategymrc.com or call us on +1-301-202-5929.
We have 3 different licensing options available in electronic format.
- Single User Licence: Allows one person, typically the buyer, to have access to the ordered product. The ordered product cannot be distributed to anyone else.
- 2-5 User Licence: Allows the ordered product to be shared among a maximum of 5 people within your organisation.
- Corporate License: Allows the product to be shared among all employees of your organisation regardless of their geographical location.
All our reports are typically be emailed to you as an attachment.
To order any available report you need to register on our website. The payment can be made either through CCAvenue or PayPal payments gateways which accept all international cards.
We extend our support to 6 months post sale. A post sale customization is also provided to cover your unmet needs in the report.
Request Customization
We offer complimentary customization of up to 15% with every purchase. To share your customization requirements, feel free to email us at info@strategymrc.com or call us on +1-301-202-5929. .
Please Note: Customization within the 15% threshold is entirely free of charge. If your request exceeds this limit, we will conduct a feasibility assessment. Following that, a detailed quote and timeline will be provided.
WHY CHOOSE US ?

Assured Quality
Best in class reports with high standard of research integrity

24X7 Research Support
Continuous support to ensure the best customer experience.

Free Customization
Adding more values to your product of interest.

Safe & Secure Access
Providing a secured environment for all online transactions.

Trusted by 600+ Brands
Serving the most reputed brands across the world.