Lcd Display Materials Market
LCD Display Materials Market Forecasts to 2034 - Global Analysis By Material Type (Liquid Crystals, Polarizers, Color Filters, Backlight Units (BLU), Substrates, Alignment Layers, Sealants & Spacers and Conductive Materials), Technology, Application and By Geography

According to Stratistics MRC, the Global LCD Display Materials Market is accounted for $10.04 billion in 2026 and is expected to reach $13.33 billion by 2034 growing at a CAGR of 3.6% during the forecast period. LCD display materials include engineered liquid crystal mixtures, polarizing films, glass panels, color filter arrays, alignment coatings, and backlighting elements that collectively create visual output in liquid crystal displays. The liquid crystals adjust light passage under electrical signals, while polarizers refine contrast and clarity. Transparent conductive layers such as indium tin oxide enable accurate pixel activation. These materials enhance luminance, energy savings, color fidelity, and reliability in devices like TVs, laptops, mobile phones, vehicle displays, and industrial screens. Ongoing advancements emphasize slimmer substrates, sustainable formulations, faster response times, and improved optical layers to deliver sharper images, lower power usage, and longer operational life.
According to Omdia (2026), large-area display unit shipments (including LCD and OLED) reached 910.5 million units in 2025, growing 2.9% year-over-year. Within this, LCD shipments alone accounted for 876.8 million units, marking a 2.6% YoY increase despite global economic uncertainty and tariff pressures.
Market Dynamics:
Driver:
Rising demand for consumer electronics
Growing adoption of electronic devices worldwide significantly propels the LCD display materials market. Strong sales of smart phones, TVs, notebooks, tablets, and smart wearable’s increase demand for essential components like liquid crystal compounds, polarizing films, specialty glass, and transparent electrodes. Factors such as urban growth, rising purchasing power, and digitally connected lifestyles encourage frequent device upgrades. Advancements including ultra-high-definition resolution and power-efficient screens further intensify material requirements. As brands strive to deliver thinner profiles, improved brightness, and enhanced durability, the consumption of sophisticated LCD materials expands steadily in both mature and developing markets.
Restraint:
Intense competition from OLED and emerging display technologies
Growing preference for OLED and next-generation display solutions significantly restrains the LCD display materials market. OLED technology delivers enhanced image quality, improved contrast, slimmer construction, and design flexibility, making it attractive for high-end electronics. As manufacturing efficiencies improve and prices decline, OLED adoption expands across smart phones, televisions, and smart devices. Moreover, advancements in MicroLED and MiniLED add further competitive pressure. This transition limits the expansion potential of traditional LCD materials and forces suppliers to focus on cost optimization and technical upgrades to sustain relevance within the rapidly changing global display industry.
Opportunity:
Growth of smart infrastructure and digital signage
Rising investments in intelligent urban systems and digital communication platforms open new avenues for the LCD display materials market. Public display boards, transit information screens, advertising panels, and self-service kiosks depend on robust LCD technology. Urban modernization projects prioritize dynamic content sharing and interactive services, expanding the use of display installations. Such environments demand materials offering enhanced brightness, durability, and environmental resistance. As cities and commercial entities continue adopting smart infrastructure solutions, demand for advanced LCD materials is expected to increase consistently across global markets.
Threat:
Rapid shift toward next-generation display technologies
The growing preference for advanced display formats like OLED and MicroLED represents a serious threat to the LCD display materials industry. These newer technologies provide enhanced image quality, slimmer designs, flexibility, and better power efficiency, appealing strongly to high-end electronics manufacturers. As fabrication processes mature and prices become more competitive, their market penetration increases. This evolution could gradually diminish dependence on traditional LCD panels and related components. Without continuous technological upgrades, LCD material producers risk experiencing shrinking demand and intensified competition within the global display sector.
Covid-19 Impact:
The outbreak of COVID-19 influenced the LCD display materials market in both negative and positive ways. Early restrictions caused factory shutdowns, interruptions in raw material supply, and transportation delays, reducing production capacity. Nevertheless, the shift toward remote working, virtual learning, and in-home entertainment increased sales of notebooks, televisions, and computer monitors. This surge elevated demand for essential LCD components such as liquid crystal compounds and optical films. Despite ongoing issues like component shortages and logistical bottlenecks, the pandemic highlighted the critical role of display technologies, supporting recovery and sustained relevance across multiple sectors globally.
The liquid crystals segment is expected to be the largest during the forecast period
The liquid crystals segment is expected to account for the largest market share during the forecast period due to their central role in display operation. They regulate light transmission in response to electrical signals, forming the basis of image generation in all LCD panels. Strong demand across consumer electronics, automotive interfaces, and professional display systems drives sustained usage. Improvements in display clarity, response time, and power efficiency require refined liquid crystal compounds, reinforcing their importance. Because they are indispensable to panel functionality and continuously required in manufacturing, liquid crystals maintain the largest share within the overall LCD materials landscape.
The quantum dot LCD segment is expected to have the highest CAGR during the forecast period
Over the forecast period, the quantum dot LCD segment is predicted to witness the highest growth rate, driven by its ability to deliver vibrant colors, higher luminance, and greater efficiency than traditional LCD formats. The use of quantum dot films enhances color reproduction while retaining the cost advantages of LCD manufacturing. Rising consumer preference for premium TVs, advanced gaming screens, and professional-grade monitors fuels adoption. Ongoing improvements in nanotechnology and scalable production methods are making this technology more accessible. Consequently, Quantum Dot LCD solutions are gaining strong momentum in worldwide display applications.
Region with largest share:
During the forecast period, the Asia Pacific region is expected to hold the largest market share, supported by its concentration of panel fabrication facilities and electronics manufacturing centers. Nations including China, South Korea, Japan, and Taiwan play pivotal roles in producing display components for various consumer and industrial applications. Well-developed supply networks, technological expertise, and ongoing capital investments reinforce regional leadership. Strong internal consumption alongside export-driven production sustains material demand. With continuous advancements in manufacturing efficiency and supportive industrial policies, Asia-Pacific maintains its position as the primary market for LCD display materials worldwide.
Region with highest CAGR:
Over the forecast period, the North America region is anticipated to exhibit the highest CAGR due to expanding applications in electronics, automotive systems, medical devices, and commercial displays. Demand for high-quality, energy-efficient screens encourage the use of advanced materials, including enhanced optical films and quantum dot technologies. Increasing deployment of smart city infrastructure, digital communication platforms, and electric mobility solutions contributes to rising display integration. Continuous innovation and substantial research investments promote rapid technological adoption. As preference for premium and high-resolution display products strengthens, North America emerges as the leading region in terms of growth momentum.
Key players in the market
Some of the key players in LCD Display Materials Market include Merck KGaA, JNC Corporation, DIC Corporation, Bayi Space, Hecheng Display, Slichem Display, Toray Industries, Nissan Chemical, Sanritz Corp., Shijiazhuang Chengzhi Yonghua Display Materials, Rolic Technologies, BASF, Sumitomo Chemical, Yantai Xianhua Chem, Jiangsu Hecheng, WISETOP New Material and Shijiazhuang Yuanji.
Key Developments:
In November 2025, Merck KGaA has signed a 20-year power purchase agreement (PPA) with SK Innovation E&S to supply renewable electricity to its life science manufacturing sites in Daejeon and Songdo, South Korea. The agreement adds 16 megawatts (MW) of new renewable capacity and represents the company’s longest energy commitment in the Asia-Pacific region.
In November 2025, Sumitomo Chemical is all set to expand its global footprint in the booming semiconductor market. The company has announced a definitive agreement to acquire 100% of Taiwan-based semiconductor process chemicals company Asia Union Electronic Chemical Corporation (AUECC). The deal, subject to standard regulatory approvals, will mark Sumitomo’s first manufacturing base in Taiwan and its second in the United States, alongside its Texas facility.
In October 2025, BASF SE and ANDRITZ Group have signed a license agreement for the use of BASF’s proprietary gas treatment technology, OASE® blue, in a carbon capture project planned to be implemented in the city of Aarhus, Denmark. The project aims to capture approximately 435,000 tons of CO2 annually from the flue gases of a waste-to-energy plant for sequestration; the city of Aarhus has set itself the goal of becoming CO2-neutral by 2030.
Material Types Covered:
• Liquid Crystals
• Polarizers
• Color Filters
• Backlight Units (BLU)
• Substrates
• Alignment Layers
• Sealants & Spacers
• Conductive Materials
Technologies Covered:
• Twisted Nematic (TN)
• In-Plane Switching (IPS)
• Vertical Alignment (VA)
• Mini-LED LCD
• Quantum Dot LCD
• Micro-LED Hybrid LCD
Applications Covered:
• Consumer Electronics
• Automotive Displays
• Industrial Equipment
• Medical Equipment
• Smart Home Devices
• Wearables & AR/VR Devices
Regions Covered:
• North America
o United States
o Canada
o Mexico
• Europe
o United Kingdom
o Germany
o France
o Italy
o Spain
o Netherlands
o Belgium
o Sweden
o Switzerland
o Poland
o Rest of Europe
• Asia Pacific
o China
o Japan
o India
o South Korea
o Australia
o Indonesia
o Thailand
o Malaysia
o Singapore
o Vietnam
o Rest of Asia Pacific
• South America
o Brazil
o Argentina
o Colombia
o Chile
o Peru
o Rest of South America
• Rest of the World (RoW)
o Middle East
§ Saudi Arabia
§ United Arab Emirates
§ Qatar
§ Israel
§ Rest of Middle East
o Africa
§ South Africa
§ Egypt
§ Morocco
§ Rest of Africa
What our report offers:
- Market share assessments for the regional and country-level segments
- Strategic recommendations for the new entrants
- Covers Market data for the years 2023, 2024, 2025, 2026, 2027, 2028, 2030, 3032 and 2034
- Market Trends (Drivers, Constraints, Opportunities, Threats, Challenges, Investment Opportunities, and recommendations)
- Strategic recommendations in key business segments based on the market estimations
- Competitive landscaping mapping the key common trends
- Company profiling with detailed strategies, financials, and recent developments
- Supply chain trends mapping the latest technological advancements
Free Customization Offerings:
All the customers of this report will be entitled to receive one of the following free customization options:
• Company Profiling
o Comprehensive profiling of additional market players (up to 3)
o SWOT Analysis of key players (up to 3)
• Regional Segmentation
o Market estimations, Forecasts and CAGR of any prominent country as per the client's interest (Note: Depends on feasibility check)
• Competitive Benchmarking
o Benchmarking of key players based on product portfolio, geographical presence, and strategic alliances
Table of Contents
1 Executive Summary
1.1 Market Snapshot and Key Highlights
1.2 Growth Drivers, Challenges, and Opportunities
1.3 Competitive Landscape Overview
1.4 Strategic Insights and Recommendations
2 Research Framework
2.1 Study Objectives and Scope
2.2 Stakeholder Analysis
2.3 Research Assumptions and Limitations
2.4 Research Methodology
2.4.1 Data Collection (Primary and Secondary)
2.4.2 Data Modeling and Estimation Techniques
2.4.3 Data Validation and Triangulation
2.4.4 Analytical and Forecasting Approach
3 Market Dynamics and Trend Analysis
3.1 Market Definition and Structure
3.2 Key Market Drivers
3.3 Market Restraints and Challenges
3.4 Growth Opportunities and Investment Hotspots
3.5 Industry Threats and Risk Assessment
3.6 Technology and Innovation Landscape
3.7 Emerging and High-Growth Markets
3.8 Regulatory and Policy Environment
3.9 Impact of COVID-19 and Recovery Outlook
4 Competitive and Strategic Assessment
4.1 Porter's Five Forces Analysis
4.1.1 Supplier Bargaining Power
4.1.2 Buyer Bargaining Power
4.1.3 Threat of Substitutes
4.1.4 Threat of New Entrants
4.1.5 Competitive Rivalry
4.2 Market Share Analysis of Key Players
4.3 Product Benchmarking and Performance Comparison
5 Global LCD Display Materials Market, By Material Type
5.1 Liquid Crystals
5.2 Polarizers
5.3 Color Filters
5.4 Backlight Units (BLU)
5.5 Substrates
5.6 Alignment Layers
5.7 Sealants & Spacers
5.8 Conductive Materials
6 Global LCD Display Materials Market, By Technology
6.1 Twisted Nematic (TN)
6.2 In-Plane Switching (IPS)
6.3 Vertical Alignment (VA)
6.4 Mini-LED LCD
6.5 Quantum Dot LCD
6.6 Micro-LED Hybrid LCD
7 Global LCD Display Materials Market, By Application
7.1 Consumer Electronics
7.2 Automotive Displays
7.3 Industrial Equipment
7.4 Medical Equipment
7.5 Smart Home Devices
7.6 Wearables & AR/VR Devices
8 Global LCD Display Materials Market, By Geography
8.1 North America
8.1.1 United States
8.1.2 Canada
8.1.3 Mexico
8.2 Europe
8.2.1 United Kingdom
8.2.2 Germany
8.2.3 France
8.2.4 Italy
8.2.5 Spain
8.2.6 Netherlands
8.2.7 Belgium
8.2.8 Sweden
8.2.9 Switzerland
8.2.10 Poland
8.2.11 Rest of Europe
8.3 Asia Pacific
8.3.1 China
8.3.2 Japan
8.3.3 India
8.3.4 South Korea
8.3.5 Australia
8.3.6 Indonesia
8.3.7 Thailand
8.3.8 Malaysia
8.3.9 Singapore
8.3.10 Vietnam
8.3.11 Rest of Asia Pacific
8.4 South America
8.4.1 Brazil
8.4.2 Argentina
8.4.3 Colombia
8.4.4 Chile
8.4.5 Peru
8.4.6 Rest of South America
8.5 Rest of the World (RoW)
8.5.1 Middle East
8.5.1.1 Saudi Arabia
8.5.1.2 United Arab Emirates
8.5.1.3 Qatar
8.5.1.4 Israel
8.5.1.5 Rest of Middle East
8.5.2 Africa
8.5.2.1 South Africa
8.5.2.2 Egypt
8.5.2.3 Morocco
8.5.2.4 Rest of Africa
9 Strategic Market Intelligence
9.1 Industry Value Network and Supply Chain Assessment
9.2 White-Space and Opportunity Mapping
9.3 Product Evolution and Market Life Cycle Analysis
9.4 Channel, Distributor, and Go-to-Market Assessment
10 Industry Developments and Strategic Initiatives
10.1 Mergers and Acquisitions
10.2 Partnerships, Alliances, and Joint Ventures
10.3 New Product Launches and Certifications
10.4 Capacity Expansion and Investments
10.5 Other Strategic Initiatives
11 Company Profiles
11.1 Merck KGaA
11.2 JNC Corporation
11.3 DIC Corporation
11.4 Bayi Space
11.5 Hecheng Display
11.6 Slichem Display
11.7 Toray Industries
11.8 Nissan Chemical
11.9 Sanritz Corp.
11.10 Shijiazhuang Chengzhi Yonghua Display Materials
11.11 Rolic Technologies
11.12 BASF
11.13 Sumitomo Chemical
11.14 Yantai Xianhua Chem
11.15 Jiangsu Hecheng
11.16 WISETOP New Material
11.17 Shijiazhuang Yuanji
List of Tables
1 Global LCD Display Materials Market Outlook, By Region (2023-2034) ($MN)
2 Global LCD Display Materials Market Outlook, By Material Type (2023-2034) ($MN)
3 Global LCD Display Materials Market Outlook, By Liquid Crystals (2023-2034) ($MN)
4 Global LCD Display Materials Market Outlook, By Polarizers (2023-2034) ($MN)
5 Global LCD Display Materials Market Outlook, By Color Filters (2023-2034) ($MN)
6 Global LCD Display Materials Market Outlook, By Backlight Units (BLU) (2023-2034) ($MN)
7 Global LCD Display Materials Market Outlook, By Substrates (2023-2034) ($MN)
8 Global LCD Display Materials Market Outlook, By Alignment Layers (2023-2034) ($MN)
9 Global LCD Display Materials Market Outlook, By Sealants & Spacers (2023-2034) ($MN)
10 Global LCD Display Materials Market Outlook, By Conductive Materials (2023-2034) ($MN)
11 Global LCD Display Materials Market Outlook, By Technology (2023-2034) ($MN)
12 Global LCD Display Materials Market Outlook, By Twisted Nematic (TN) (2023-2034) ($MN)
13 Global LCD Display Materials Market Outlook, By In-Plane Switching (IPS) (2023-2034) ($MN)
14 Global LCD Display Materials Market Outlook, By Vertical Alignment (VA) (2023-2034) ($MN)
15 Global LCD Display Materials Market Outlook, By Mini-LED LCD (2023-2034) ($MN)
16 Global LCD Display Materials Market Outlook, By Quantum Dot LCD (2023-2034) ($MN)
17 Global LCD Display Materials Market Outlook, By Micro-LED Hybrid LCD (2023-2034) ($MN)
18 Global LCD Display Materials Market Outlook, By Application (2023-2034) ($MN)
19 Global LCD Display Materials Market Outlook, By Consumer Electronics (2023-2034) ($MN)
20 Global LCD Display Materials Market Outlook, By Automotive Displays (2023-2034) ($MN)
21 Global LCD Display Materials Market Outlook, By Industrial Equipment (2023-2034) ($MN)
22 Global LCD Display Materials Market Outlook, By Medical Equipment (2023-2034) ($MN)
23 Global LCD Display Materials Market Outlook, By Smart Home Devices (2023-2034) ($MN)
24 Global LCD Display Materials Market Outlook, By Wearables & AR/VR Devices (2023-2034) ($MN)
Note: Tables for North America, Europe, APAC, South America, and Rest of the World (RoW) Regions are also represented in the same manner as above.
List of Figures
RESEARCH METHODOLOGY
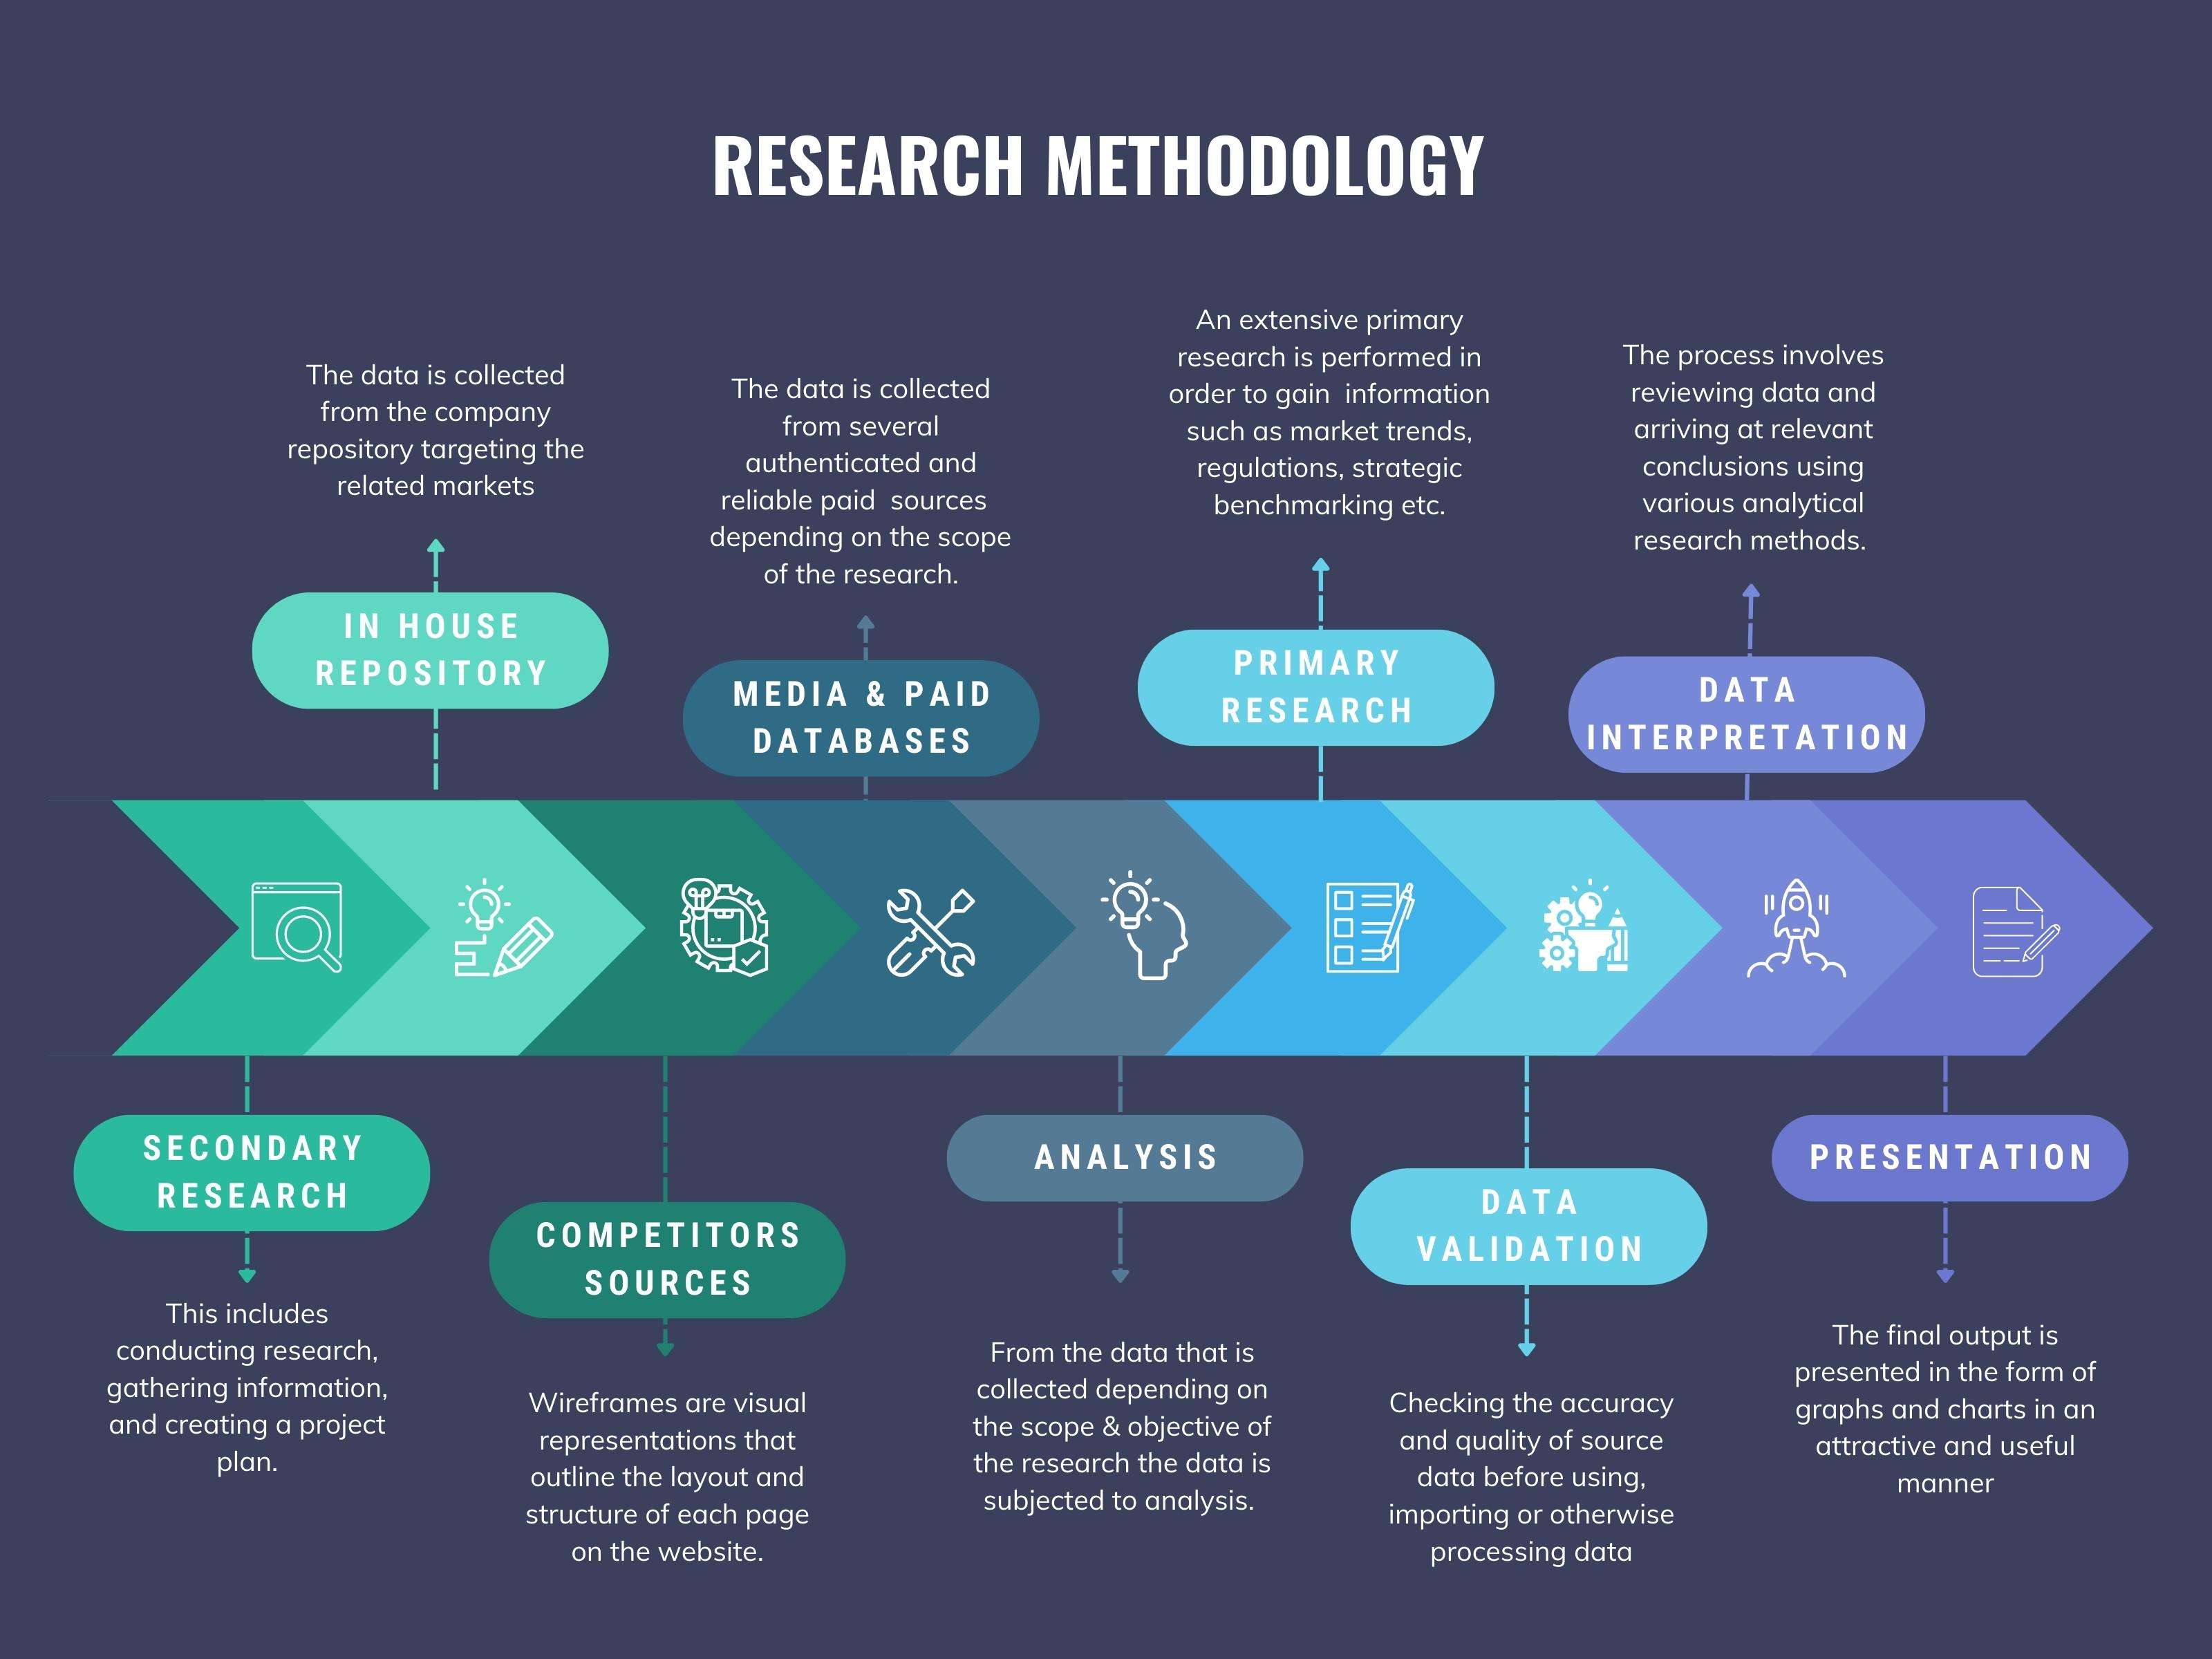
We at ‘Stratistics’ opt for an extensive research approach which involves data mining, data validation, and data analysis. The various research sources include in-house repository, secondary research, competitor’s sources, social media research, client internal data, and primary research.
Our team of analysts prefers the most reliable and authenticated data sources in order to perform the comprehensive literature search. With access to most of the authenticated data bases our team highly considers the best mix of information through various sources to obtain extensive and accurate analysis.
Each report takes an average time of a month and a team of 4 industry analysts. The time may vary depending on the scope and data availability of the desired market report. The various parameters used in the market assessment are standardized in order to enhance the data accuracy.
Data Mining
The data is collected from several authenticated, reliable, paid and unpaid sources and is filtered depending on the scope & objective of the research. Our reports repository acts as an added advantage in this procedure. Data gathering from the raw material suppliers, distributors and the manufacturers is performed on a regular basis, this helps in the comprehensive understanding of the products value chain. Apart from the above mentioned sources the data is also collected from the industry consultants to ensure the objective of the study is in the right direction.
Market trends such as technological advancements, regulatory affairs, market dynamics (Drivers, Restraints, Opportunities and Challenges) are obtained from scientific journals, market related national & international associations and organizations.
Data Analysis
From the data that is collected depending on the scope & objective of the research the data is subjected for the analysis. The critical steps that we follow for the data analysis include:
- Product Lifecycle Analysis
- Competitor analysis
- Risk analysis
- Porters Analysis
- PESTEL Analysis
- SWOT Analysis
The data engineering is performed by the core industry experts considering both the Marketing Mix Modeling and the Demand Forecasting. The marketing mix modeling makes use of multiple-regression techniques to predict the optimal mix of marketing variables. Regression factor is based on a number of variables and how they relate to an outcome such as sales or profits.
Data Validation
The data validation is performed by the exhaustive primary research from the expert interviews. This includes telephonic interviews, focus groups, face to face interviews, and questionnaires to validate our research from all aspects. The industry experts we approach come from the leading firms, involved in the supply chain ranging from the suppliers, distributors to the manufacturers and consumers so as to ensure an unbiased analysis.
We are in touch with more than 15,000 industry experts with the right mix of consultants, CEO's, presidents, vice presidents, managers, experts from both supply side and demand side, executives and so on.
The data validation involves the primary research from the industry experts belonging to:
- Leading Companies
- Suppliers & Distributors
- Manufacturers
- Consumers
- Industry/Strategic Consultants
Apart from the data validation the primary research also helps in performing the fill gap research, i.e. providing solutions for the unmet needs of the research which helps in enhancing the reports quality.
For more details about research methodology, kindly write to us at info@strategymrc.com
Frequently Asked Questions
In case of any queries regarding this report, you can contact the customer service by filing the “Inquiry Before Buy” form available on the right hand side. You may also contact us through email: info@strategymrc.com or phone: +1-301-202-5929
Yes, the samples are available for all the published reports. You can request them by filling the “Request Sample” option available in this page.
Yes, you can request a sample with your specific requirements. All the customized samples will be provided as per the requirement with the real data masked.
All our reports are available in Digital PDF format. In case if you require them in any other formats, such as PPT, Excel etc you can submit a request through “Inquiry Before Buy” form available on the right hand side. You may also contact us through email: info@strategymrc.com or phone: +1-301-202-5929
We offer a free 15% customization with every purchase. This requirement can be fulfilled for both pre and post sale. You may send your customization requirements through email at info@strategymrc.com or call us on +1-301-202-5929.
We have 3 different licensing options available in electronic format.
- Single User Licence: Allows one person, typically the buyer, to have access to the ordered product. The ordered product cannot be distributed to anyone else.
- 2-5 User Licence: Allows the ordered product to be shared among a maximum of 5 people within your organisation.
- Corporate License: Allows the product to be shared among all employees of your organisation regardless of their geographical location.
All our reports are typically be emailed to you as an attachment.
To order any available report you need to register on our website. The payment can be made either through CCAvenue or PayPal payments gateways which accept all international cards.
We extend our support to 6 months post sale. A post sale customization is also provided to cover your unmet needs in the report.
Request Customization
We offer complimentary customization of up to 15% with every purchase. To share your customization requirements, feel free to email us at info@strategymrc.com or call us on +1-301-202-5929. .
Please Note: Customization within the 15% threshold is entirely free of charge. If your request exceeds this limit, we will conduct a feasibility assessment. Following that, a detailed quote and timeline will be provided.
WHY CHOOSE US ?

Assured Quality
Best in class reports with high standard of research integrity

24X7 Research Support
Continuous support to ensure the best customer experience.

Free Customization
Adding more values to your product of interest.

Safe & Secure Access
Providing a secured environment for all online transactions.

Trusted by 600+ Brands
Serving the most reputed brands across the world.