
Light Powered Catalyst Market
Light-powered Catalyst Market Forecasts to 2028 - Global Analysis By Product Type (Polymers and petrochemicals, Environmental, Chemical synthesis, Petroleum refining, Heterogeneous Catalyst and Other Product Types), Raw Material (Metals, Zeolites, Chemical compounds and Other Raw Materials) and By Geography

|
Years Covered |
2020-2028 |
|
Estimated Year Value (2022) |
US $3.48BN |
|
Projected Year Value (2028) |
US $7.07BN |
|
CAGR (2022 - 2028) |
12.5% |
|
Regions Covered |
North America, Europe, Asia Pacific, South America, and Middle East & Africa |
|
Countries Covered |
US, Canada, Mexico, Germany, UK, Italy, France, Spain, Japan, China, India, Australia, New Zealand, South Korea, Rest of Asia Pacific, South America, Argentina, Brazil, Chile, Middle East & Africa, Saudi Arabia, UAE, Qatar, and South Africa |
|
Largest Market |
Asia Pacific |
|
Highest Growing Market |
North America |
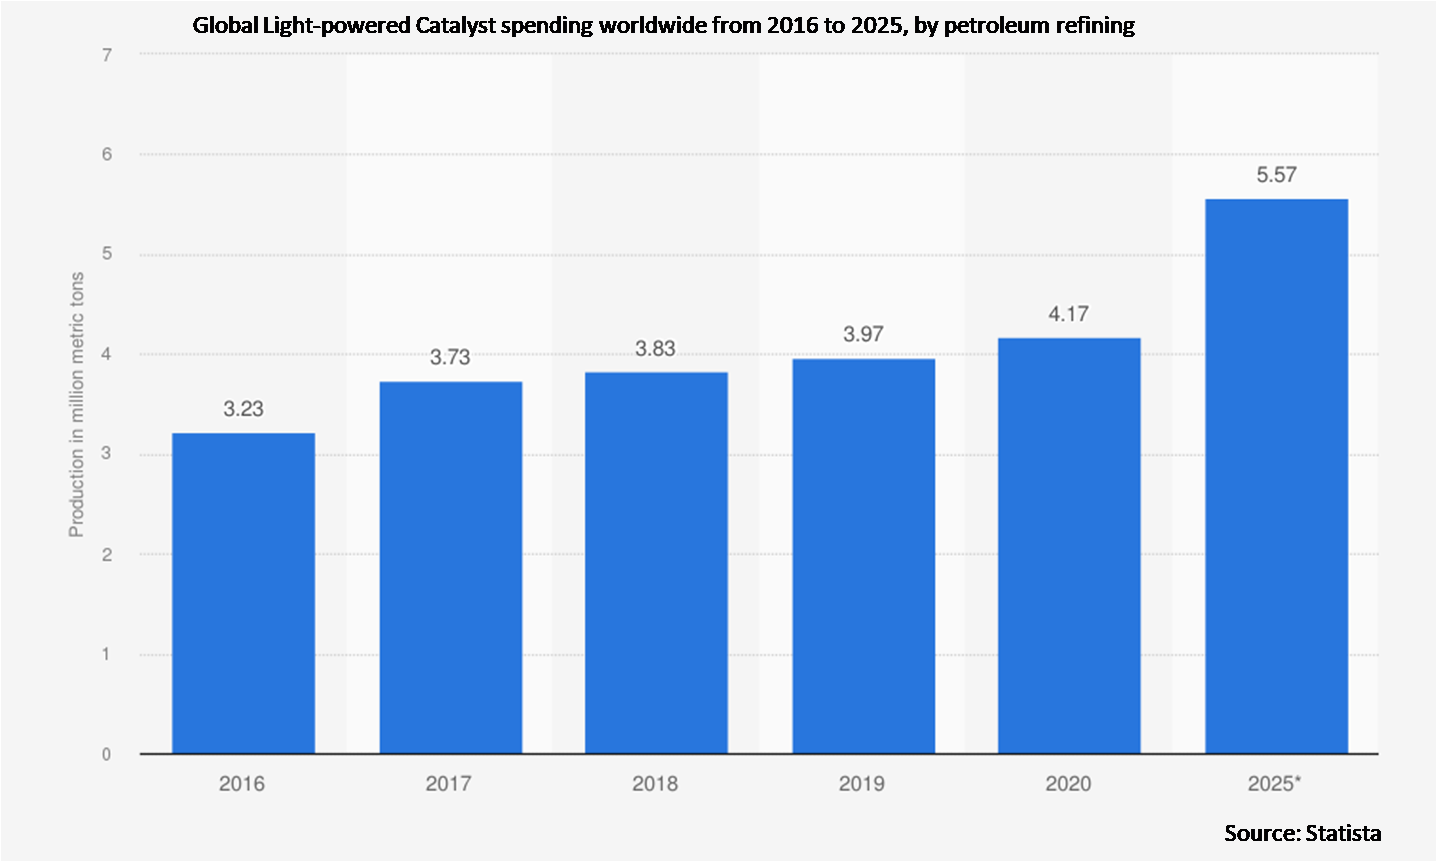
According to Stratistics MRC, the Global Light-powered Catalyst Market is accounted for $3.48 billion in 2022 and is expected to reach $7.07 billion by 2028 growing at a CAGR of 12.5% during the forecast period. Light-driven chemical reactions provide a strong tool for scientists developing novel methods of producing medicines and other important molecules. Photoredox catalysts, that absorb light and transmitting energy to those chemical processes, are required to harness the light energy. The innovative catalysts, that could be tailored to conduct a wide range of reactions, might potentially be put into other materials such as fabrics or particles. These catalysts operate by receiving photons and then converting that light energy into chemical energy, similar towards how chlorophyll in plant cells receives solar energy and utilizes it to make sugar molecules.
Market Dynamics:
Driver:
The growing need for catalysts
The rising need for catalysts across applications like polymers and petrochemicals, chemical synthesis, petroleum refining and environmental is creating a market among manufacturers for process optimization, yield improvement, cost-saving and energy-saving. Catalyst consumption has increased due to shifting energy patterns toward alternative fuels such as biodiesel and shale gas fuel. Furthermore, businesses aiming to add value to their feedstock or refining by generating value-added petrochemicals and chemicals have boosted demand for the expansion of market.
Restraint:
Availability of substitutes
The challenge of substitutes exists within the market. The availability of zinc oxide and cadmium sulphide is threatening the replacement, the highest-grossing substance in the industry. The substitutes are also available at cheaper prices and are affordable. The substitutes offer cheaper solutions and it makes it an easy substitute. Therefore these aspects act as the major challenges to the market.
Opportunity:
High-energy reactions
A bio hybrid photo-catalyst is a form of catalyst that incorporates a light-harvesting protein that collects light and transmits the energy to a metal-containing catalyst. This catalyst then converts the energy into reactions that can be used to synthesise medications or transform trash into bio fuels or other valuable molecules. Most catalysts speed up reactions by lowering the energy barrier needed for the reaction to occur. This allows them to catalyze reactions that couldn’t occur without that extra input of energy. Thus, these are the factors influencing the growth of the market.
Threat:
High cost of production
High price of production and concern regarding sintering, a leading cause of deterioration of catalytic performance of industrial catalyst operating at elevated temperatures are a few factors hindering the growth. In addition, several factors contribute to high cost of producing and purifying catalysts. They are produced in extremely small quantities and small scale manufacturing is frequently expensive. These catalysts require multistep combinations, which increases cost. Hence, these factors are hampering the growth of the market.
Covid-19 Impact
The unusual outbreak of COVID-19, which has resulted in the closure of industries and production facilities, has resulted in a large drop in demand for oil, the first such occurrence in a decade. Due to a stop in air travel and national lockdowns, global gasoline demand is predicted to fall. A number of facilities have been shut down, and others are operating at reduced rates, which may have an influence on market demand. The economic slowdown has led to the disruption of the operations and production of the market which has caused huge losses to the industry. There are heavy restrictions on imports and exports which is also a huge challenge to the market.
The heterogeneous catalysts segment is expected to be the largest during the forecast period
The heterogeneous catalysts segment is estimated to have a lucrative growth, due to the advantages of heterogeneous catalyst application include low cost, easy separation of catalyst from products, and convenience of application. To minimise toxicity, homogeneous catalysts are transformed into heterogeneous catalysts using solid supports. Furthermore, the acceptability of heterogeneous catalysts over homogeneous equivalents for biodiesel production is expected to enhance market growth.
The chemical compounds segment is expected to have the highest CAGR during the forecast period
The chemical compounds segment is anticipated to witness the fastest CAGR growth during the forecast period, due to their porosity and vast surface area. Hydrofluoric, Sulphuric acid, acid, and calcium carbonate are utilised as catalyst raw materials in a wide range of applications in the chemical, petrochemical, and polymer industries. Noble metals and non-noble metals are utilised for dehydrogenation and hydrogenation, while nickel and cobalt are also employed as essential catalyst raw materials. Thus, these factors are boosting the growth of the segment.
Region with highest share:
Asia Pacific is projected to hold the largest market share during the forecast period owing to predominance in the vehicle, petrochemical products, polymer, and chemical sectors. It had a significant number of chemical and polymer production companies, and as a result, it has emerged as a manufacturing desired location for petrochemical and chemical products, owing to rising domestic demand and low manufacturing costs. The increased FDI investments and attractive development prospects presented by developing nations are improving market expansion there in region.
Region with highest CAGR:
North America is projected to have the highest CAGR over the forecast period, owing to the region's developing low sulphur and automobile standards, which necessitate the use of environmental catalysts. The rising use of gasoline is expected to increase demand for catalysts used in the conversion of heavy crude oil into light fractions such as the diesel, kerosene and also gasoline. Furthermore, the expansion of oil and gas and chemical industries is a crucial driver supporting to market growth in the Region.

Key players in the market
Some of the key players profiled in the Light-powered Catalyst Market include Clariant AG, Chevron Phillips Chemical Company LLC, Evonik Industries AG, Dow Chemical Company, Albemarle Corporation Johnson Matthey, Johnson Matthey, BASF SE , Dorf Ketal Chemicals (I) Pvt. Ltd., W.R. Grace and Co and ELight-powered Catalyst Marketonmobil Corporation.
Key Developments:
In October 2022, Clariant and Dorf Ketal, two of the world’s leading specialty chemical products and services companies, have announced a definitive agreement for Dorf Ketal to acquire Clariant’s North American (NORAM) Land Oil business, a provider of chemical technologies and services to the North American oil and gas industry.
In September 2019, Chevron Phillips Chemical Company LLC and Qatar Petroleum announced they have signed an agreement to jointly pursue development of a new petrochemical plant in the Gulf Coast region of the United States.
Products Types Covered:
• Polymers and petrochemicals
• Environmental
• Chemical synthesis
• Petroleum refining
• Heterogeneous Catalyst
• Other Product Types
Raw Materials Covered:
• Metals
• Zeolites
• Chemical compounds
• Other Raw Materials
Regions Covered:
• North America
o US
o Canada
o Mexico
• Europe
o Germany
o UK
o Italy
o France
o Spain
o Rest of Europe
• Asia Pacific
o Japan
o China
o India
o Australia
o New Zealand
o South Korea
o Rest of Asia Pacific
• South America
o Argentina
o Brazil
o Chile
o Rest of South America
• Middle East & Africa
o Saudi Arabia
o UAE
o Qatar
o South Africa
o Rest of Middle East & Africa
What our report offers:
- Market share assessments for the regional and country-level segments
- Strategic recommendations for the new entrants
- Covers Market data for the years 2020, 2021, 2022, 2025, and 2028
- Market Trends (Drivers, Constraints, Opportunities, Threats, Challenges, Investment Opportunities, and recommendations)
- Strategic recommendations in key business segments based on the market estimations
- Competitive landscaping mapping the key common trends
- Company profiling with detailed strategies, financials, and recent developments
- Supply chain trends mapping the latest technological advancements
Free Customization Offerings:
All the customers of this report will be entitled to receive one of the following free customization options:
• Company Profiling
o Comprehensive profiling of additional market players (up to 3)
o SWOT Analysis of key players (up to 3)
• Regional Segmentation
o Market estimations, Forecasts and CAGR of any prominent country as per the client's interest (Note: Depends on feasibility check)
• Competitive Benchmarking
o Benchmarking of key players based on product portfolio, geographical presence, and strategic alliances
Table of Contents
1 Executive Summary
2 Preface
2.1 Abstract
2.2 Stake Holders
2.3 Research Scope
2.4 Research Methodology
2.4.1 Data Mining
2.4.2 Data Analysis
2.4.3 Data Validation
2.4.4 Research Approach
2.5 Research Sources
2.5.1 Primary Research Sources
2.5.2 Secondary Research Sources
2.5.3 Assumptions
3 Market Trend Analysis
3.1 Introduction
3.2 Drivers
3.3 Restraints
3.4 Opportunities
3.5 Threats
3.6 Product Analysis
3.7 Emerging Markets
3.8 Impact of Covid-19
4 Porters Five Force Analysis
4.1 Bargaining power of suppliers
4.2 Bargaining power of buyers
4.3 Threat of substitutes
4.4 Threat of new entrants
4.5 Competitive rivalry
5 Global Light-powered Catalyst Market, By Product Type
5.1 Introduction
5.2 Polymers and petrochemicals
5.3 Environmental
5.4 Chemical synthesis
5.5 Petroleum refining
5.6 Heterogeneous Catalyst
5.7 Other Product Types
6 Global Light-powered Catalyst Market, By Raw Material
6.1 Introduction
6.2 Metals
6.3 Zeolites
6.4 Chemical compounds
6.5 Other Raw Materials
7 Global Light-powered Catalyst Market, By Geography
7.1 Introduction
7.2 North America
7.2.1 US
7.2.2 Canada
7.2.3 Mexico
7.3 Europe
7.3.1 Germany
7.3.2 UK
7.3.3 Italy
7.3.4 France
7.3.5 Spain
7.3.6 Rest of Europe
7.4 Asia Pacific
7.4.1 Japan
7.4.2 China
7.4.3 India
7.4.4 Australia
7.4.5 New Zealand
7.4.6 South Korea
7.4.7 Rest of Asia Pacific
7.5 South America
7.5.1 Argentina
7.5.2 Brazil
7.5.3 Chile
7.5.4 Rest of South America
7.6 Middle East & Africa
7.6.1 Saudi Arabia
7.6.2 UAE
7.6.3 Qatar
7.6.4 South Africa
7.6.5 Rest of Middle East & Africa
8 Key Developments
8.1 Agreements, Partnerships, Collaborations and Joint Ventures
8.2 Acquisitions & Mergers
8.3 New Product Launch
8.4 Expansions
8.5 Other Key Strategies
9 Company Profiling
9.1 Clariant AG
9.2 Chevron Phillips Chemical Company LLC
9.3 Evonik Industries AG
9.4 Dow Chemical Company
9.5 Albemarle Corporation Johnson Matthey
9.6 Johnson Matthey
9.7 BASF SE
9.8 Dorf Ketal Chemicals (I) Pvt. Ltd.
9.9 W.R. Grace and Co
9.10 ELight-powered Catalyst Marketonmobil Corporation
List of Tables
1 Global Light-powered Catalyst Market Outlook, By Region (2020-2028) ($MN)
2 Global Light-powered Catalyst Market Outlook, By Product Type (2020-2028) ($MN)
3 Global Light-powered Catalyst Market Outlook, By Polymers and petrochemicals (2020-2028) ($MN)
4 Global Light-powered Catalyst Market Outlook, By Environmental (2020-2028) ($MN)
5 Global Light-powered Catalyst Market Outlook, By Chemical synthesis (2020-2028) ($MN)
6 Global Light-powered Catalyst Market Outlook, By Petroleum refining (2020-2028) ($MN)
7 Global Light-powered Catalyst Market Outlook, By Heterogeneous Catalyst (2020-2028) ($MN)
8 Global Light-powered Catalyst Market Outlook, By Other Product Types (2020-2028) ($MN)
9 Global Light-powered Catalyst Market Outlook, By Raw Material (2020-2028) ($MN)
10 Global Light-powered Catalyst Market Outlook, By Metals (2020-2028) ($MN)
11 Global Light-powered Catalyst Market Outlook, By Zeolites (2020-2028) ($MN)
12 Global Light-powered Catalyst Market Outlook, By Chemical compounds (2020-2028) ($MN)
13 Global Light-powered Catalyst Market Outlook, By Other Raw Materials (2020-2028) ($MN)
14 North America Light-powered Catalyst Market Outlook, By Country (2020-2028) ($MN)
15 North America Light-powered Catalyst Market Outlook, By Product Type (2020-2028) ($MN)
16 North America Light-powered Catalyst Market Outlook, By Polymers and petrochemicals (2020-2028) ($MN)
17 North America Light-powered Catalyst Market Outlook, By Environmental (2020-2028) ($MN)
18 North America Light-powered Catalyst Market Outlook, By Chemical synthesis (2020-2028) ($MN)
19 North America Light-powered Catalyst Market Outlook, By Petroleum refining (2020-2028) ($MN)
20 North America Light-powered Catalyst Market Outlook, By Heterogeneous Catalyst (2020-2028) ($MN)
21 North America Light-powered Catalyst Market Outlook, By Other Product Types (2020-2028) ($MN)
22 North America Light-powered Catalyst Market Outlook, By Raw Material (2020-2028) ($MN)
23 North America Light-powered Catalyst Market Outlook, By Metals (2020-2028) ($MN)
24 North America Light-powered Catalyst Market Outlook, By Zeolites (2020-2028) ($MN)
25 North America Light-powered Catalyst Market Outlook, By Chemical compounds (2020-2028) ($MN)
26 North America Light-powered Catalyst Market Outlook, By Other Raw Materials (2020-2028) ($MN)
27 Europe Light-powered Catalyst Market Outlook, By Country (2020-2028) ($MN)
28 Europe Light-powered Catalyst Market Outlook, By Product Type (2020-2028) ($MN)
29 Europe Light-powered Catalyst Market Outlook, By Polymers and petrochemicals (2020-2028) ($MN)
30 Europe Light-powered Catalyst Market Outlook, By Environmental (2020-2028) ($MN)
31 Europe Light-powered Catalyst Market Outlook, By Chemical synthesis (2020-2028) ($MN)
32 Europe Light-powered Catalyst Market Outlook, By Petroleum refining (2020-2028) ($MN)
33 Europe Light-powered Catalyst Market Outlook, By Heterogeneous Catalyst (2020-2028) ($MN)
34 Europe Light-powered Catalyst Market Outlook, By Other Product Types (2020-2028) ($MN)
35 Europe Light-powered Catalyst Market Outlook, By Raw Material (2020-2028) ($MN)
36 Europe Light-powered Catalyst Market Outlook, By Metals (2020-2028) ($MN)
37 Europe Light-powered Catalyst Market Outlook, By Zeolites (2020-2028) ($MN)
38 Europe Light-powered Catalyst Market Outlook, By Chemical compounds (2020-2028) ($MN)
39 Europe Light-powered Catalyst Market Outlook, By Other Raw Materials (2020-2028) ($MN)
40 Asia Pacific Light-powered Catalyst Market Outlook, By Country (2020-2028) ($MN)
41 Asia Pacific Light-powered Catalyst Market Outlook, By Product Type (2020-2028) ($MN)
42 Asia Pacific Light-powered Catalyst Market Outlook, By Polymers and petrochemicals (2020-2028) ($MN)
43 Asia Pacific Light-powered Catalyst Market Outlook, By Environmental (2020-2028) ($MN)
44 Asia Pacific Light-powered Catalyst Market Outlook, By Chemical synthesis (2020-2028) ($MN)
45 Asia Pacific Light-powered Catalyst Market Outlook, By Petroleum refining (2020-2028) ($MN)
46 Asia Pacific Light-powered Catalyst Market Outlook, By Heterogeneous Catalyst (2020-2028) ($MN)
47 Asia Pacific Light-powered Catalyst Market Outlook, By Other Product Types (2020-2028) ($MN)
48 Asia Pacific Light-powered Catalyst Market Outlook, By Raw Material (2020-2028) ($MN)
49 Asia Pacific Light-powered Catalyst Market Outlook, By Metals (2020-2028) ($MN)
50 Asia Pacific Light-powered Catalyst Market Outlook, By Zeolites (2020-2028) ($MN)
51 Asia Pacific Light-powered Catalyst Market Outlook, By Chemical compounds (2020-2028) ($MN)
52 Asia Pacific Light-powered Catalyst Market Outlook, By Other Raw Materials (2020-2028) ($MN)
53 South America Light-powered Catalyst Market Outlook, By Country (2020-2028) ($MN)
54 South America Light-powered Catalyst Market Outlook, By Product Type (2020-2028) ($MN)
55 South America Light-powered Catalyst Market Outlook, By Polymers and petrochemicals (2020-2028) ($MN)
56 South America Light-powered Catalyst Market Outlook, By Environmental (2020-2028) ($MN)
57 South America Light-powered Catalyst Market Outlook, By Chemical synthesis (2020-2028) ($MN)
58 South America Light-powered Catalyst Market Outlook, By Petroleum refining (2020-2028) ($MN)
59 South America Light-powered Catalyst Market Outlook, By Heterogeneous Catalyst (2020-2028) ($MN)
60 South America Light-powered Catalyst Market Outlook, By Other Product Types (2020-2028) ($MN)
61 South America Light-powered Catalyst Market Outlook, By Raw Material (2020-2028) ($MN)
62 South America Light-powered Catalyst Market Outlook, By Metals (2020-2028) ($MN)
63 South America Light-powered Catalyst Market Outlook, By Zeolites (2020-2028) ($MN)
64 South America Light-powered Catalyst Market Outlook, By Chemical compounds (2020-2028) ($MN)
65 South America Light-powered Catalyst Market Outlook, By Other Raw Materials (2020-2028) ($MN)
66 Middle East & Africa Light-powered Catalyst Market Outlook, By Country (2020-2028) ($MN)
67 Middle East & Africa Light-powered Catalyst Market Outlook, By Product Type (2020-2028) ($MN)
68 Middle East & Africa Light-powered Catalyst Market Outlook, By Polymers and petrochemicals (2020-2028) ($MN)
69 Middle East & Africa Light-powered Catalyst Market Outlook, By Environmental (2020-2028) ($MN)
70 Middle East & Africa Light-powered Catalyst Market Outlook, By Chemical synthesis (2020-2028) ($MN)
71 Middle East & Africa Light-powered Catalyst Market Outlook, By Petroleum refining (2020-2028) ($MN)
72 Middle East & Africa Light-powered Catalyst Market Outlook, By Heterogeneous Catalyst (2020-2028) ($MN)
73 Middle East & Africa Light-powered Catalyst Market Outlook, By Other Product Types (2020-2028) ($MN)
74 Middle East & Africa Light-powered Catalyst Market Outlook, By Raw Material (2020-2028) ($MN)
75 Middle East & Africa Light-powered Catalyst Market Outlook, By Metals (2020-2028) ($MN)
76 Middle East & Africa Light-powered Catalyst Market Outlook, By Zeolites (2020-2028) ($MN)
77 Middle East & Africa Light-powered Catalyst Market Outlook, By Chemical compounds (2020-2028) ($MN)
78 Middle East & Africa Light-powered Catalyst Market Outlook, By Other Raw Materials (2020-2028) ($MN)
List of Figures
RESEARCH METHODOLOGY

We at ‘Stratistics’ opt for an extensive research approach which involves data mining, data validation, and data analysis. The various research sources include in-house repository, secondary research, competitor’s sources, social media research, client internal data, and primary research.
Our team of analysts prefers the most reliable and authenticated data sources in order to perform the comprehensive literature search. With access to most of the authenticated data bases our team highly considers the best mix of information through various sources to obtain extensive and accurate analysis.
Each report takes an average time of a month and a team of 4 industry analysts. The time may vary depending on the scope and data availability of the desired market report. The various parameters used in the market assessment are standardized in order to enhance the data accuracy.
Data Mining
The data is collected from several authenticated, reliable, paid and unpaid sources and is filtered depending on the scope & objective of the research. Our reports repository acts as an added advantage in this procedure. Data gathering from the raw material suppliers, distributors and the manufacturers is performed on a regular basis, this helps in the comprehensive understanding of the products value chain. Apart from the above mentioned sources the data is also collected from the industry consultants to ensure the objective of the study is in the right direction.
Market trends such as technological advancements, regulatory affairs, market dynamics (Drivers, Restraints, Opportunities and Challenges) are obtained from scientific journals, market related national & international associations and organizations.
Data Analysis
From the data that is collected depending on the scope & objective of the research the data is subjected for the analysis. The critical steps that we follow for the data analysis include:
- Product Lifecycle Analysis
- Competitor analysis
- Risk analysis
- Porters Analysis
- PESTEL Analysis
- SWOT Analysis
The data engineering is performed by the core industry experts considering both the Marketing Mix Modeling and the Demand Forecasting. The marketing mix modeling makes use of multiple-regression techniques to predict the optimal mix of marketing variables. Regression factor is based on a number of variables and how they relate to an outcome such as sales or profits.
Data Validation
The data validation is performed by the exhaustive primary research from the expert interviews. This includes telephonic interviews, focus groups, face to face interviews, and questionnaires to validate our research from all aspects. The industry experts we approach come from the leading firms, involved in the supply chain ranging from the suppliers, distributors to the manufacturers and consumers so as to ensure an unbiased analysis.
We are in touch with more than 15,000 industry experts with the right mix of consultants, CEO's, presidents, vice presidents, managers, experts from both supply side and demand side, executives and so on.
The data validation involves the primary research from the industry experts belonging to:
- Leading Companies
- Suppliers & Distributors
- Manufacturers
- Consumers
- Industry/Strategic Consultants
Apart from the data validation the primary research also helps in performing the fill gap research, i.e. providing solutions for the unmet needs of the research which helps in enhancing the reports quality.
For more details about research methodology, kindly write to us at info@strategymrc.com
Frequently Asked Questions
In case of any queries regarding this report, you can contact the customer service by filing the “Inquiry Before Buy” form available on the right hand side. You may also contact us through email: info@strategymrc.com or phone: +1-301-202-5929
Yes, the samples are available for all the published reports. You can request them by filling the “Request Sample” option available in this page.
Yes, you can request a sample with your specific requirements. All the customized samples will be provided as per the requirement with the real data masked.
All our reports are available in Digital PDF format. In case if you require them in any other formats, such as PPT, Excel etc you can submit a request through “Inquiry Before Buy” form available on the right hand side. You may also contact us through email: info@strategymrc.com or phone: +1-301-202-5929
We offer a free 15% customization with every purchase. This requirement can be fulfilled for both pre and post sale. You may send your customization requirements through email at info@strategymrc.com or call us on +1-301-202-5929.
We have 3 different licensing options available in electronic format.
- Single User Licence: Allows one person, typically the buyer, to have access to the ordered product. The ordered product cannot be distributed to anyone else.
- 2-5 User Licence: Allows the ordered product to be shared among a maximum of 5 people within your organisation.
- Corporate License: Allows the product to be shared among all employees of your organisation regardless of their geographical location.
All our reports are typically be emailed to you as an attachment.
To order any available report you need to register on our website. The payment can be made either through CCAvenue or PayPal payments gateways which accept all international cards.
We extend our support to 6 months post sale. A post sale customization is also provided to cover your unmet needs in the report.
Request Customization
We offer complimentary customization of up to 15% with every purchase. To share your customization requirements, feel free to email us at info@strategymrc.com or call us on +1-301-202-5929. .
Please Note: Customization within the 15% threshold is entirely free of charge. If your request exceeds this limit, we will conduct a feasibility assessment. Following that, a detailed quote and timeline will be provided.
WHY CHOOSE US ?

Assured Quality
Best in class reports with high standard of research integrity

24X7 Research Support
Continuous support to ensure the best customer experience.

Free Customization
Adding more values to your product of interest.

Safe & Secure Access
Providing a secured environment for all online transactions.

Trusted by 600+ Brands
Serving the most reputed brands across the world.