
Low Carbon Chemical Production Market
Low-Carbon Chemical Production Market Forecasts to 2034 - Global Analysis By Technology (Bio-based Chemical Production, Electrification of Chemical Processes, Carbon Capture & Storage (CCS), Carbon Utilization Pathways, Hydrogen-based Pathways, Circular Economy Approaches and Process Intensification & Modular Reactors), Application and By Geography

|
Years Covered |
2023-2034 |
|
Estimated Year Value (2026) |
US $6.68 BN |
|
Projected Year Value (2034) |
US $85.71 BN |
|
CAGR (2026-2034) |
37.56% |
|
Regions Covered |
North America, Europe, Asia Pacific, South America, and Rest of the World (RoW) |
|
Countries Covered |
United States, Canada, Mexico, United Kingdom, Germany, France, Italy, Spain, Netherlands, Belgium, Sweden, Switzerland, Poland, Rest of Europe, China, Japan, India, South Korea, Australia, Indonesia, Thailand, Malaysia, Singapore, Vietnam, Rest of Asia Pacific, Brazil, Argentina, Colombia, Chile, Peru, Rest of South America, Saudi Arabia, United Arab Emirates, Qatar, Israel, Rest of Middle East, South Africa, Egypt, Morocco, and Rest of Africa. |
|
Largest Market |
Europe |
|
Highest Growing Market |
Asia Pacific |
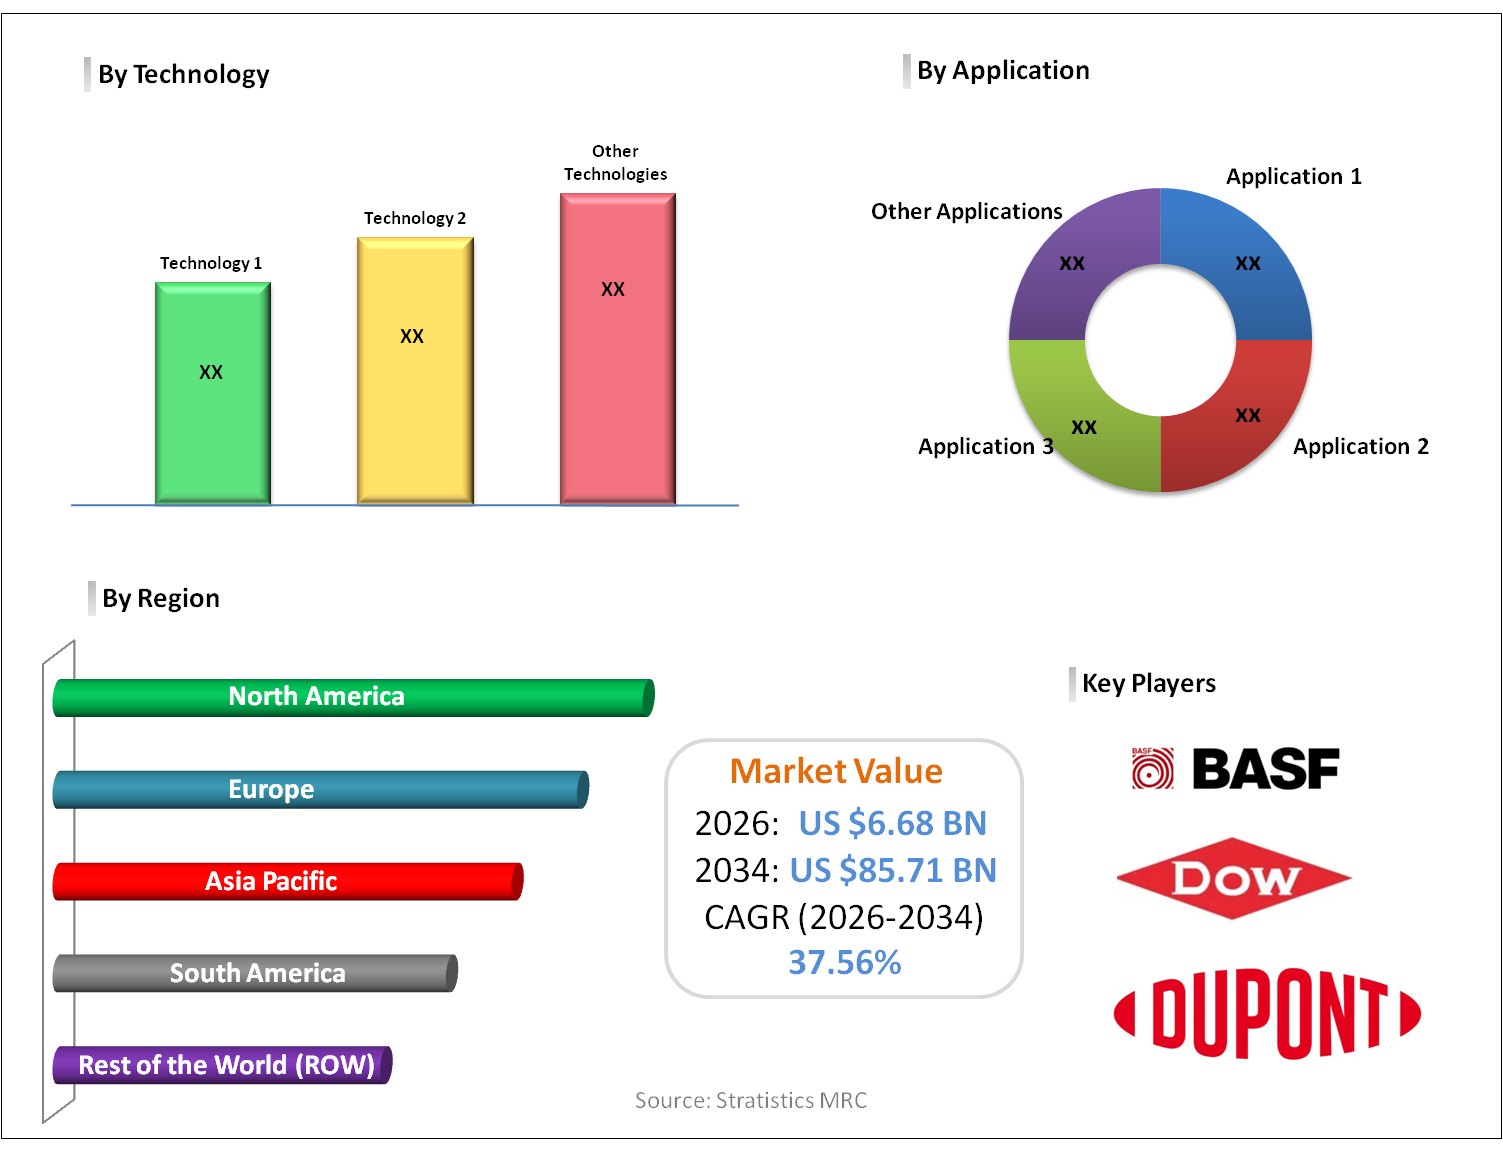
According to Stratistics MRC, the Global Low-Carbon Chemical Production Market is accounted for $6.68 billion in 2026 and is expected to reach $85.71 billion by 2034 growing at a CAGR of 37.56% during the forecast period. Low-carbon chemical production aims to lower carbon emissions throughout chemical manufacturing by adopting cleaner technologies and sustainable resource inputs. It promotes renewable power usage, green hydrogen integration, bio-derived feedstocks, and carbon capture solutions to decrease fossil fuel dependence. Improvements such as process electrification, innovative catalysts, and circular economy initiatives, including recycling and byproduct utilization, help cut environmental impact. Digital monitoring and optimization systems further enhance operational efficiency and reduce energy consumption. Together, these approaches enable the industry to meet climate commitments, comply with evolving regulations, and ensure sustainable growth while preserving efficiency, market competitiveness, and resilient global supply networks.
According to RMI’s Chemistry in Transition report (2025), chemicals underpin 96% of all manufactured goods and are essential for enabling 75% of global energy transition technologies. This highlights the paradox: while chemicals are a major emitter, they are also indispensable for decarbonization solutions across industries.
Market Dynamics:
Driver:
Rising demand for sustainable and green products
The expanding preference for environmentally responsible products is accelerating the adoption of low-carbon chemical production. Industries including automotive, packaging, infrastructure and electronics increasingly demand materials with reduced emissions to support sustainability commitments. Buyers favor products with verified carbon reductions, recycled content, and green certifications. This trend motivates chemical producers to integrate renewable inputs, bio-derived resources, and energy-efficient technologies. As environmental awareness strengthens among businesses and consumers, manufacturers are investing more heavily in low-emission processes to align with market expectations and secure long-term commercial growth opportunities.
Restraint:
Elevated upfront infrastructure and modernization costs
Substantial initial investment and infrastructure upgrade costs act as a major constraint on low-carbon chemical production growth. Shifting to cleaner technologies requires significant expenditure for advanced machinery, facility redesign, renewable power systems, and emissions control installations. Existing plants are built for long-term operation, making large-scale modifications complex and expensive. Smaller enterprises frequently face difficulties obtaining capital for sustainable transformation projects. Additionally, uncertain policy frameworks and variable financial incentives reduce confidence in long-term profitability. These economic challenges delay technology adoption and restrict the pace at which chemical producers can transition toward environmentally sustainable manufacturing models.
Opportunity:
Innovation in carbon management and conversion solutions
Progress in carbon management and conversion technologies offers promising prospects for low-carbon chemical producers. Capturing emissions from manufacturing facilities and transforming carbon dioxide into useful products or securely storing it reduces overall environmental impact. Ongoing technological improvements are enhancing efficiency and lowering operational expenses. Collaborative infrastructure within industrial hubs strengthens transport and storage capabilities. Implementing these systems enables companies to address emissions from existing assets without extensive reconstruction. Beyond compliance benefits, carbon utilization can generate additional value streams and strengthen corporate sustainability performance in competitive global markets.
Threat:
Competitive pressure from conventional low-cost producers
Intense cost competition from traditional chemical manufacturers poses a threat to low-carbon production initiatives. Regions with access to inexpensive fossil fuels and mature industrial infrastructure can produce chemicals at lower prices. Buyers focused primarily on cost efficiency may resist paying higher prices for sustainable alternatives. Companies pursuing decarbonization strategies could experience reduced profit margins if competitors continue operating under conventional models. Differences in environmental regulations across countries further amplify cost gaps. These market dynamics can slow investment in cleaner technologies, especially in highly competitive commodity sectors driven by price sensitivity.
Covid-19 Impact:
The pandemic created both challenges and opportunities for the low-carbon chemical production market. Initially, widespread lockdowns interrupted manufacturing operations, postponed infrastructure upgrades, and constrained funding for environmental projects as firms focused on financial stability. Lower global energy consumption led to reduced fossil fuel prices, temporarily affecting competitiveness of renewable solutions. Nevertheless, recovery strategies in many regions emphasized sustainable development and green investments. Policymakers introduced stimulus programs promoting clean energy and industrial decarbonization. The crisis heightened awareness of supply chain resilience and environmental responsibility, ultimately reinforcing long-term commitment to low-carbon production pathways and sustainable industry transformation.
The bio-based chemical production segment is expected to be the largest during the forecast period
The bio-based chemical production segment is expected to account for the largest market share during the forecast period, supported by broad industrial adoption and operational feasibility. Manufacturers are substituting conventional fossil inputs with renewable biomass, crop waste, and bio-derived resources across diverse chemical applications. Policy incentives promoting renewable materials and rising demand for environmentally responsible products reinforce market penetration. Continuous innovation in bioprocessing and integrated biorefineries has enhanced production efficiency and commercial viability.
The fertilizers segment is expected to have the highest CAGR during the forecast period
Over the forecast period, the fertilizers segment is predicted to witness the highest growth rate, driven by the urgent need to reduce emissions in ammonia-based manufacturing. Traditional fertilizer processes generate significant carbon output, prompting adoption of renewable hydrogen and clean energy alternatives. Rising emphasis on sustainable farming practices and global food security encourages investment in environmentally responsible fertilizer production facilities. Supportive policies aimed at lowering agricultural emissions further stimulate technological advancements. As decarbonization becomes central to both chemical manufacturing and agriculture, low-carbon fertilizer solutions are expanding at a comparatively accelerated pace across international markets.
Region with largest share:
During the forecast period, the Europe region is expected to hold the largest market share due to its proactive environmental policies and firm commitment to decarbonization. The region enforces rigorous emission regulations and operates well-established carbon pricing systems that encourage sustainable manufacturing transitions. Significant investments in renewable power, hydrogen development, and carbon management technologies support industrial transformation. With clear climate objectives and structured funding mechanisms, Europe maintains a leading role in promoting environmentally responsible chemical production and advancing low-emission industrial development across multiple sectors.
Region with highest CAGR:
Over the forecast period, the Asia Pacific region is anticipated to exhibit the highest CAGR, supported by expanding industrial activity and strengthening climate initiatives. Countries across the region are channeling investments into renewable energy projects, hydrogen ecosystems, and cleaner manufacturing infrastructure. Increasing regulatory pressure and national carbon neutrality goals are prompting upgrades to conventional chemical plants. Rapid demand growth from key end-use industries further stimulates adoption of sustainable production technologies. Combined with foreign direct investment and cross-border technology partnerships, these factors position Asia-Pacific as the most dynamic and rapidly expanding regional market for low-carbon chemical manufacturing.

Key players in the market
Some of the key players in Low-Carbon Chemical Production Market include BASF SE, Dow Inc., DuPont de Nemours, SABIC, LanzaTech, TotalEnergies SE, Neste Corporation, Genomatica, Braskem, Covestro AG, LyondellBasell Industries, Mitsubishi Chemical Corporation, Solvay, Arkema, Novozymes, Clariant, Evonik Industries and Croda International.
Key Developments:
In October 2025, Dow and MEGlobal have finalized an agreement for Dow to supply an additional equivalent to 100 KTA of ethylene from its Gulf Coast operations. The ethylene will serve as a key feedstock for MEGlobal’s ethylene glycol (EG) manufacturing facility co-located at Dow’s and MEGlobal’s Oyster Creek site.
In October 2025, BASF SE and ANDRITZ Group have signed a license agreement for the use of BASF’s proprietary gas treatment technology, OASE® blue, in a carbon capture project planned to be implemented in the city of Aarhus, Denmark. The project aims to capture approximately 435,000 tons of CO2 annually from the flue gases of a waste-to-energy plant for sequestration; the city of Aarhus has set itself the goal of becoming CO2-neutral by 2030.
In August 2025, DuPont de Nemours, Inc., The Chemours Company and Corteva, Inc. announced a settlement to comprehensively resolve all pending environmental and other claims by the State of New Jersey against the Companies in various litigation matters and other state directives. The Settlement will resolve all legacy contamination claims related to the companies’ current and former operating sites and claims of statewide PFAS contamination unrelated to those sites, including from the use of aqueous film forming foam.
Technologies Covered:
• Bio-based Chemical Production
• Electrification of Chemical Processes
• Carbon Capture & Storage (CCS)
• Carbon Utilization Pathways
• Hydrogen-based Pathways
• Circular Economy Approaches
• Process Intensification & Modular Reactors
Applications Covered:
• Petrochemicals
• Fertilizers
• Specialty Chemicals
• Polymers & Plastics
• Industrial Gases
• Basic Inorganics
Regions Covered:
• North America
o United States
o Canada
o Mexico
• Europe
o United Kingdom
o Germany
o France
o Italy
o Spain
o Netherlands
o Belgium
o Sweden
o Switzerland
o Poland
o Rest of Europe
• Asia Pacific
o China
o Japan
o India
o South Korea
o Australia
o Indonesia
o Thailand
o Malaysia
o Singapore
o Vietnam
o Rest of Asia Pacific
• South America
o Brazil
o Argentina
o Colombia
o Chile
o Peru
o Rest of South America
• Rest of the World (RoW)
o Middle East
§ Saudi Arabia
§ United Arab Emirates
§ Qatar
§ Israel
§ Rest of Middle East
o Africa
§ South Africa
§ Egypt
§ Morocco
§ Rest of Africa
What our report offers:
- Market share assessments for the regional and country-level segments
- Strategic recommendations for the new entrants
- Covers Market data for the years 2023, 2024, 2025, 2026, 2027, 2028, 2030, 2032 and 2034
- Market Trends (Drivers, Constraints, Opportunities, Threats, Challenges, Investment Opportunities, and recommendations)
- Strategic recommendations in key business segments based on the market estimations
- Competitive landscaping mapping the key common trends
- Company profiling with detailed strategies, financials, and recent developments
- Supply chain trends mapping the latest technological advancements
Free Customization Offerings:
All the customers of this report will be entitled to receive one of the following free customization options:
• Company Profiling
o Comprehensive profiling of additional market players (up to 3)
o SWOT Analysis of key players (up to 3)
• Regional Segmentation
o Market estimations, Forecasts and CAGR of any prominent country as per the client's interest (Note: Depends on feasibility check)
• Competitive Benchmarking
o Benchmarking of key players based on product portfolio, geographical presence, and strategic alliances
Table of Contents
1 Executive Summary
1.1 Market Snapshot and Key Highlights
1.2 Growth Drivers, Challenges, and Opportunities
1.3 Competitive Landscape Overview
1.4 Strategic Insights and Recommendations
2 Research Framework
2.1 Study Objectives and Scope
2.2 Stakeholder Analysis
2.3 Research Assumptions and Limitations
2.4 Research Methodology
2.4.1 Data Collection (Primary and Secondary)
2.4.2 Data Modeling and Estimation Techniques
2.4.3 Data Validation and Triangulation
2.4.4 Analytical and Forecasting Approach
3 Market Dynamics and Trend Analysis
3.1 Market Definition and Structure
3.2 Key Market Drivers
3.3 Market Restraints and Challenges
3.4 Growth Opportunities and Investment Hotspots
3.5 Industry Threats and Risk Assessment
3.6 Technology and Innovation Landscape
3.7 Emerging and High-Growth Markets
3.8 Regulatory and Policy Environment
3.9 Impact of COVID-19 and Recovery Outlook
4 Competitive and Strategic Assessment
4.1 Porter's Five Forces Analysis
4.1.1 Supplier Bargaining Power
4.1.2 Buyer Bargaining Power
4.1.3 Threat of Substitutes
4.1.4 Threat of New Entrants
4.1.5 Competitive Rivalry
4.2 Market Share Analysis of Key Players
4.3 Product Benchmarking and Performance Comparison
5 Global Low-Carbon Chemical Production Market, By Technology
5.1 Bio-based Chemical Production
5.2 Electrification of Chemical Processes
5.3 Carbon Capture & Storage (CCS)
5.4 Carbon Utilization Pathways
5.5 Hydrogen-based Pathways
5.6 Circular Economy Approaches
5.7 Process Intensification & Modular Reactors
6 Global Low-Carbon Chemical Production Market, By Application
6.1 Petrochemicals
6.2 Fertilizers
6.3 Specialty Chemicals
6.4 Polymers & Plastics
6.5 Industrial Gases
6.6 Basic Inorganics
7 Global Low-Carbon Chemical Production Market, By Geography
7.1 North America
7.1.1 United States
7.1.2 Canada
7.1.3 Mexico
7.2 Europe
7.2.1 United Kingdom
7.2.2 Germany
7.2.3 France
7.2.4 Italy
7.2.5 Spain
7.2.6 Netherlands
7.2.7 Belgium
7.2.8 Sweden
7.2.9 Switzerland
7.2.10 Poland
7.2.11 Rest of Europe
7.3 Asia Pacific
7.3.1 China
7.3.2 Japan
7.3.3 India
7.3.4 South Korea
7.3.5 Australia
7.3.6 Indonesia
7.3.7 Thailand
7.3.8 Malaysia
7.3.9 Singapore
7.3.10 Vietnam
7.3.11 Rest of Asia Pacific
7.4 South America
7.4.1 Brazil
7.4.2 Argentina
7.4.3 Colombia
7.4.4 Chile
7.4.5 Peru
7.4.6 Rest of South America
7.5 Rest of the World (RoW)
7.5.1 Middle East
7.5.1.1 Saudi Arabia
7.5.1.2 United Arab Emirates
7.5.1.3 Qatar
7.5.1.4 Israel
7.5.1.5 Rest of Middle East
7.5.2 Africa
7.5.2.1 South Africa
7.5.2.2 Egypt
7.5.2.3 Morocco
7.5.2.4 Rest of Africa
8 Strategic Market Intelligence
8.1 Industry Value Network and Supply Chain Assessment
8.2 White-Space and Opportunity Mapping
8.3 Product Evolution and Market Life Cycle Analysis
8.4 Channel, Distributor, and Go-to-Market Assessment
9 Industry Developments and Strategic Initiatives
9.1 Mergers and Acquisitions
9.2 Partnerships, Alliances, and Joint Ventures
9.3 New Product Launches and Certifications
9.4 Capacity Expansion and Investments
9.5 Other Strategic Initiatives
10 Company Profiles
10.1 BASF SE
10.2 Dow Inc.
10.3 DuPont de Nemours
10.4 SABIC
10.5 LanzaTech
10.6 TotalEnergies SE
10.7 Neste Corporation
10.8 Genomatica
10.9 Braskem
10.10 Covestro AG
10.11 LyondellBasell Industries
10.12 Mitsubishi Chemical Corporation
10.13 Solvay
10.14 Arkema
10.15 Novozymes
10.16 Clariant
10.17 Evonik Industries
10.18 Croda International
List of Tables
1 Global Low-Carbon Chemical Production Market Outlook, By Region (2023-2034) ($MN)
2 Global Low-Carbon Chemical Production Market Outlook, By Technology (2023-2034) ($MN)
3 Global Low-Carbon Chemical Production Market Outlook, By Bio-based Chemical Production (2023-2034) ($MN)
4 Global Low-Carbon Chemical Production Market Outlook, By Electrification of Chemical Processes (2023-2034) ($MN)
5 Global Low-Carbon Chemical Production Market Outlook, By Carbon Capture & Storage (CCS) (2023-2034) ($MN)
6 Global Low-Carbon Chemical Production Market Outlook, By Carbon Utilization Pathways (2023-2034) ($MN)
7 Global Low-Carbon Chemical Production Market Outlook, By Hydrogen-based Pathways (2023-2034) ($MN)
8 Global Low-Carbon Chemical Production Market Outlook, By Circular Economy Approaches (2023-2034) ($MN)
9 Global Low-Carbon Chemical Production Market Outlook, By Process Intensification & Modular Reactors (2023-2034) ($MN)
10 Global Low-Carbon Chemical Production Market Outlook, By Application (2023-2034) ($MN)
11 Global Low-Carbon Chemical Production Market Outlook, By Petrochemicals (2023-2034) ($MN)
12 Global Low-Carbon Chemical Production Market Outlook, By Fertilizers (2023-2034) ($MN)
13 Global Low-Carbon Chemical Production Market Outlook, By Specialty Chemicals (2023-2034) ($MN)
14 Global Low-Carbon Chemical Production Market Outlook, By Polymers & Plastics (2023-2034) ($MN)
15 Global Low-Carbon Chemical Production Market Outlook, By Industrial Gases (2023-2034) ($MN)
16 Global Low-Carbon Chemical Production Market Outlook, By Basic Inorganics (2023-2034) ($MN)
Note: Tables for North America, Europe, APAC, South America, and Rest of the World (RoW) Regions are also represented in the same manner as above.
List of Figures
RESEARCH METHODOLOGY

We at ‘Stratistics’ opt for an extensive research approach which involves data mining, data validation, and data analysis. The various research sources include in-house repository, secondary research, competitor’s sources, social media research, client internal data, and primary research.
Our team of analysts prefers the most reliable and authenticated data sources in order to perform the comprehensive literature search. With access to most of the authenticated data bases our team highly considers the best mix of information through various sources to obtain extensive and accurate analysis.
Each report takes an average time of a month and a team of 4 industry analysts. The time may vary depending on the scope and data availability of the desired market report. The various parameters used in the market assessment are standardized in order to enhance the data accuracy.
Data Mining
The data is collected from several authenticated, reliable, paid and unpaid sources and is filtered depending on the scope & objective of the research. Our reports repository acts as an added advantage in this procedure. Data gathering from the raw material suppliers, distributors and the manufacturers is performed on a regular basis, this helps in the comprehensive understanding of the products value chain. Apart from the above mentioned sources the data is also collected from the industry consultants to ensure the objective of the study is in the right direction.
Market trends such as technological advancements, regulatory affairs, market dynamics (Drivers, Restraints, Opportunities and Challenges) are obtained from scientific journals, market related national & international associations and organizations.
Data Analysis
From the data that is collected depending on the scope & objective of the research the data is subjected for the analysis. The critical steps that we follow for the data analysis include:
- Product Lifecycle Analysis
- Competitor analysis
- Risk analysis
- Porters Analysis
- PESTEL Analysis
- SWOT Analysis
The data engineering is performed by the core industry experts considering both the Marketing Mix Modeling and the Demand Forecasting. The marketing mix modeling makes use of multiple-regression techniques to predict the optimal mix of marketing variables. Regression factor is based on a number of variables and how they relate to an outcome such as sales or profits.
Data Validation
The data validation is performed by the exhaustive primary research from the expert interviews. This includes telephonic interviews, focus groups, face to face interviews, and questionnaires to validate our research from all aspects. The industry experts we approach come from the leading firms, involved in the supply chain ranging from the suppliers, distributors to the manufacturers and consumers so as to ensure an unbiased analysis.
We are in touch with more than 15,000 industry experts with the right mix of consultants, CEO's, presidents, vice presidents, managers, experts from both supply side and demand side, executives and so on.
The data validation involves the primary research from the industry experts belonging to:
- Leading Companies
- Suppliers & Distributors
- Manufacturers
- Consumers
- Industry/Strategic Consultants
Apart from the data validation the primary research also helps in performing the fill gap research, i.e. providing solutions for the unmet needs of the research which helps in enhancing the reports quality.
For more details about research methodology, kindly write to us at info@strategymrc.com
Frequently Asked Questions
In case of any queries regarding this report, you can contact the customer service by filing the “Inquiry Before Buy” form available on the right hand side. You may also contact us through email: info@strategymrc.com or phone: +1-301-202-5929
Yes, the samples are available for all the published reports. You can request them by filling the “Request Sample” option available in this page.
Yes, you can request a sample with your specific requirements. All the customized samples will be provided as per the requirement with the real data masked.
All our reports are available in Digital PDF format. In case if you require them in any other formats, such as PPT, Excel etc you can submit a request through “Inquiry Before Buy” form available on the right hand side. You may also contact us through email: info@strategymrc.com or phone: +1-301-202-5929
We offer a free 15% customization with every purchase. This requirement can be fulfilled for both pre and post sale. You may send your customization requirements through email at info@strategymrc.com or call us on +1-301-202-5929.
We have 3 different licensing options available in electronic format.
- Single User Licence: Allows one person, typically the buyer, to have access to the ordered product. The ordered product cannot be distributed to anyone else.
- 2-5 User Licence: Allows the ordered product to be shared among a maximum of 5 people within your organisation.
- Corporate License: Allows the product to be shared among all employees of your organisation regardless of their geographical location.
All our reports are typically be emailed to you as an attachment.
To order any available report you need to register on our website. The payment can be made either through CCAvenue or PayPal payments gateways which accept all international cards.
We extend our support to 6 months post sale. A post sale customization is also provided to cover your unmet needs in the report.
Request Customization
We offer complimentary customization of up to 15% with every purchase. To share your customization requirements, feel free to email us at info@strategymrc.com or call us on +1-301-202-5929. .
Please Note: Customization within the 15% threshold is entirely free of charge. If your request exceeds this limit, we will conduct a feasibility assessment. Following that, a detailed quote and timeline will be provided.
WHY CHOOSE US ?

Assured Quality
Best in class reports with high standard of research integrity

24X7 Research Support
Continuous support to ensure the best customer experience.

Free Customization
Adding more values to your product of interest.

Safe & Secure Access
Providing a secured environment for all online transactions.

Trusted by 600+ Brands
Serving the most reputed brands across the world.