
Media Asset Management Market
Media Asset Management Market Forecasts to 2028 - Global Analysis By Deployment (On-Premise and Cloud), Meat Type (Pork, Beef, Poultry and Other Meat Types), Enterprise Size (Large Enterprise and Small & Medium Size Enterprise) and By Geography

|
Years Covered |
2020-2028 |
|
Estimated Year Value (2022) |
US $1.58 BN |
|
Projected Year Value (2028) |
US $3.84 BN |
|
CAGR (2022 - 2028) |
15.9% |
|
Regions Covered |
North America, Europe, Asia Pacific, South America, and Middle East & Africa |
|
Countries Covered |
US, Canada, Mexico, Germany, UK, Italy, France, Spain, Japan, China, India, Australia, New Zealand, South Korea, Rest of Asia Pacific, South America, Argentina, Brazil, Chile, Middle East & Africa, Saudi Arabia, UAE, Qatar, and South Africa |
|
Largest Market |
North America |
|
Fastest Growing Market |
Asia Pacific |
According to Stratistics MRC, the Global Media Asset Management Market is accounted for $1.58 billion in 2022 and is expected to reach $3.84 billion by 2028 growing at a CAGR of 15.9% during the forecast period. Media Asset Management (MAM) refers to the process of storing and organizing video and multimedia files. MAM refers to both the method and the software used to manage video and multimedia data. The necessity to manage massive and rich media files is accommodated by a MAM system. It has developed into a crucial component of the video production process, enabling businesses to store and manage huge media libraries from a single, trustworthy location.
According to the O’reilly Survey of 2021, 88% of respondents were using cloud, 25% organizations planned to shift all their applications to cloud in the coming years.
Market Dynamics:
Driver:
Increasing demand for cloud-based asset management
Due to the rising demand for cloud-based MAM solutions, several MAM providers, including Sony Corporation, Hexaglobe, Imagen, Publitio, and Blue Lucy Media, have begun to offer these services. AWS and Google are only two of the companies that have worked with suppliers of cloud platforms. When compared to on-premises choices, cloud-delivery options provide setup, affordable licensing, and maintenance. The majority of enterprises are moving toward cloud-based MAM solutions as a result of these cost advantages.
Restraint:
High costs of integration and implementation
MAM systems provide several cost-saving benefits in terms of initial deployment and license expenses for managing media assets. However, as the number of users per account and storage capacity grows, so do the overall costs of MAM deployment and licensing. Furthermore, because of the difficulty in pricing support services, many SMEs are hesitant to use MAM systems.
Opportunity:
Easy access
Media asset management (MAM) solutions store the files in a central location, regulate access from diverse teams, and allow for simple access to and sharing of films and photographs in any format. Also, the advancements offered by companies in media asset management (MAM) solutions, the demand is expected to grow at a high rate. Due to these benefits, the demand for media asset management (MAM) systems is anticipated to increase during the forecast period.
Threat:
Concerns about data privacy and security
The multiple patchworks of open-source programmes that comprise cloud infrastructure increase the likelihood of additional problems being added over time. Malicious hackers can easily access cloud-based data storage systems because of the open architecture and shared files that cloud-based technology is founded on. As a result, it is anticipated that worries regarding data privacy and security associated to management solutions market solutions will constrain the market's growth throughout the projection period.
Covid-19 Impact
As people became more engaged in online content consumption, the growth of the global COVID-19 pandemic accelerated the creation of a massive number of media assets. The amount of content and media produced or consumed has significantly increased as the world becomes more and more digitalized. Online video streaming services, music consumption, digital marketing, gaming, and social media use all saw considerable increases during this period of transition. With more businesses investing in digital marketing campaigns, brand management, PR, social media, audio and video streaming, and advertising where animations, photos, and videos are the key to a winning plan, they have been among the top trends.
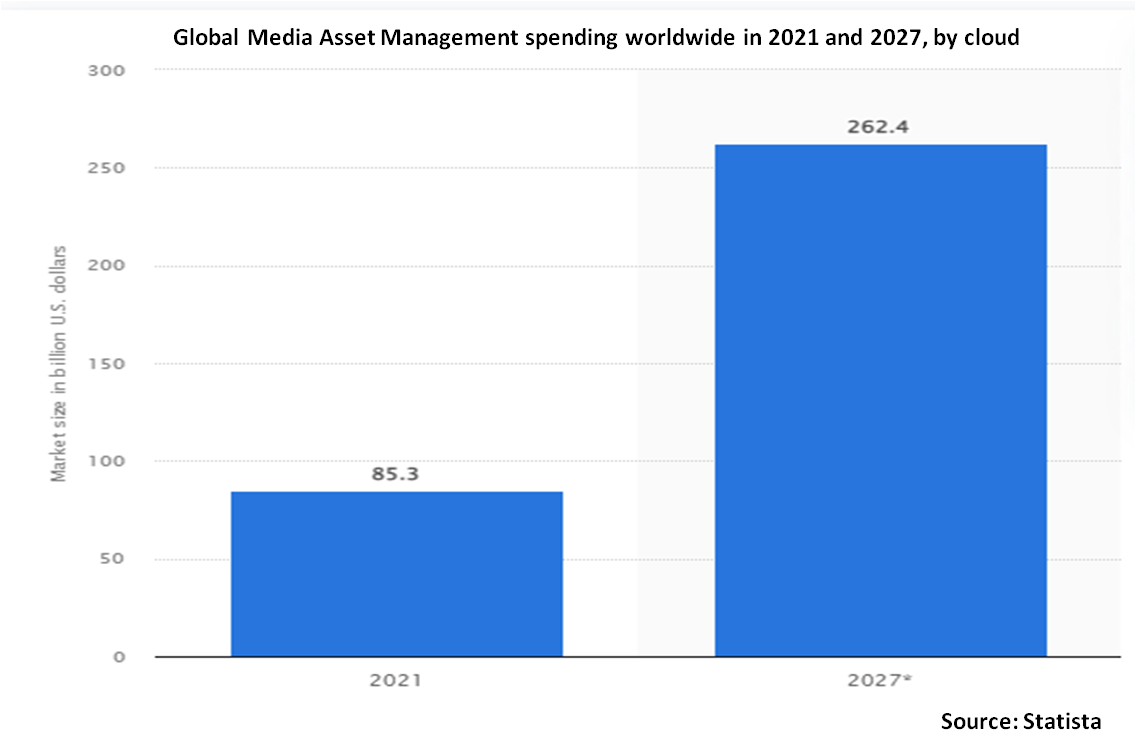
The cloud segment is expected to be the largest during the forecast period
The cloud segment is estimated to have a lucrative growth, due to the increased cloud-hosted environment for storing, organizing, and managing assets. The gradual shift from on-premises to cloud-based management solutions is one of the key drivers driving the expansion of the market for media asset management systems. Because of this, organizations can use cloud storage services in accordance with their storage needs thanks to cloud storage solutions. Because of this, on-premises management solutions market solutions have increasingly been replaced by cloud-based ones, favorably influencing the growth of the worldwide management solutions market during the forecast period.
The small & medium size enterprise segment is expected to have the highest CAGR during the forecast period
The small & medium size enterprise segment is anticipated to witness the fastest CAGR growth during the forecast period, due to the growing use of MAM solutions and services in small and medium-sized businesses. One of the elements contributing to MAM's success is the investment and product launches by SMEs.
Region with highest share:
North America is projected to hold the largest market share during the forecast period owing to the rising demand from various industries in region. MAM is currently in a revival period in North America due to the massive increase of digital data from online, social media, and sensors as a result of new technology that capture and analyze such data. The potential to enhance connected products, services, and customer reach is regarded as being significantly increased by prominent players from the United States and Canada. Major media and broadcasting businesses' presence in the area is also anticipated to help this sector. These elements are anticipated to fuel market expansion in the near future.
Region with highest CAGR:
Asia Pacific is projected to have the highest CAGR over the forecast period, owing to the rise of Industry 4.0, which has resulted in increased automation adoption, Asia Pacific countries such as India, Japan, and others are likely to fuel the market. Additionally, the market in Asia Pacific is being stimulated by the gradual transition from the old to the digital approach.

Key players in the market
Some of the key players profiled in the Media Asset Management Market include SI-MEDIA Srl, Microsoft Corporation, Imagen, Sony Group Corporation, Quantum Corporation, VSN Video Stream Networks S.L., Dalet, Tedial, Prime Focus Technologies, Dell Technologies Inc., International Business Machines Corp., Bynder BV
Key Developments:
In June 2022, Imagen announced an integrated partnership with Greenfly, a cloud-based digital media software platform. This collaboration will strengthen their automated collection, distributed, and storage sharing of digital media for global sports and entertainment organizations.
In April 2022, Tedial announced SmartWork, a media integration platform designed natively with kubernetes and microservices to provide future proofing and scalability for both media operations and resources. With this, the company aims to simplify broadcast workflows and allow media companies to be more self-sufficient. It allows users to develop processes and integrations with a drag and drop, no code editor interface, removing the traditional tiers that allow enhanced collaboration.
In August 2021, NEP Group acquired Lux Machina, Prysm Collective and Halon Entertainment. With this acquisition, the company launched a new virtual production business segment called NEP Virtual Studios.
Deployments Covered:
• On-Premise
• Cloud
Enterprise Sizes Covered:
• Large Enterprise
• Small & Medium Size Enterprise
Regions Covered:
• North America
o US
o Canada
o Mexico
• Europe
o Germany
o UK
o Italy
o France
o Spain
o Rest of Europe
• Asia Pacific
o Japan
o China
o India
o Australia
o New Zealand
o South Korea
o Rest of Asia Pacific
• South America
o Argentina
o Brazil
o Chile
o Rest of South America
• Middle East & Africa
o Saudi Arabia
o UAE
o Qatar
o South Africa
o Rest of Middle East & Africa
What our report offers:
- Market share assessments for the regional and country-level segments
- Strategic recommendations for the new entrants
- Covers Market data for the years 2020, 2021, 2022, 2025, and 2028
- Market Trends (Drivers, Constraints, Opportunities, Threats, Challenges, Investment Opportunities, and recommendations)
- Strategic recommendations in key business segments based on the market estimations
- Competitive landscaping mapping the key common trends
- Company profiling with detailed strategies, financials, and recent developments
- Supply chain trends mapping the latest technological advancements
Free Customization Offerings:
All the customers of this report will be entitled to receive one of the following free customization options:
• Company Profiling
o Comprehensive profiling of additional market players (up to 3)
o SWOT Analysis of key players (up to 3)
• Regional Segmentation
o Market estimations, Forecasts and CAGR of any prominent country as per the client's interest (Note: Depends on feasibility check)
• Competitive Benchmarking
o Benchmarking of key players based on product portfolio, geographical presence, and strategic alliances
Table of Contents
1 Executive Summary
2 Preface
2.1 Abstract
2.2 Stake Holders
2.3 Research Scope
2.4 Research Methodology
2.4.1 Data Mining
2.4.2 Data Analysis
2.4.3 Data Validation
2.4.4 Research Approach
2.5 Research Sources
2.5.1 Primary Research Sources
2.5.2 Secondary Research Sources
2.5.3 Assumptions
3 Market Trend Analysis
3.1 Introduction
3.2 Drivers
3.3 Restraints
3.4 Opportunities
3.5 Threats
3.6 Emerging Markets
3.7 Impact of Covid-19
4 Porters Five Force Analysis
4.1 Bargaining power of suppliers
4.2 Bargaining power of buyers
4.3 Threat of substitutes
4.4 Threat of new entrants
4.5 Competitive rivalry
5 Global Media Asset Management Market, By Deployment
5.1 Introduction
5.2 On-Premise
5.3 Cloud
6 Global Media Asset Management Market, By Enterprise Size
6.1 Introduction
6.2 Large Enterprise
6.3 Small & Medium Size Enterprise
7 Global Media Asset Management Market, By Geography
7.1 Introduction
7.2 North America
7.2.1 US
7.2.2 Canada
7.2.3 Mexico
7.3 Europe
7.3.1 Germany
7.3.2 UK
7.3.3 Italy
7.3.4 France
7.3.5 Spain
7.3.6 Rest of Europe
7.4 Asia Pacific
7.4.1 Japan
7.4.2 China
7.4.3 India
7.4.4 Australia
7.4.5 New Zealand
7.4.6 South Korea
7.4.7 Rest of Asia Pacific
7.5 South America
7.5.1 Argentina
7.5.2 Brazil
7.5.3 Chile
7.5.4 Rest of South America
7.6 Middle East & Africa
7.6.1 Saudi Arabia
7.6.2 UAE
7.6.3 Qatar
7.6.4 South Africa
7.6.5 Rest of Middle East & Africa
8 Key Developments
8.1 Agreements, Partnerships, Collaborations and Joint Ventures
8.2 Acquisitions & Mergers
8.3 New Product Launch
8.4 Expansions
8.5 Other Key Strategies
9 Company Profiling
9.1 SI-MEDIA Srl
9.2 Microsoft Corporation
9.3 Imagen
9.4 Sony Group Corporation Amazon.com, Inc. (U.S.)
9.5 Quantum Corporation
9.6 VSN Video Stream Networks S.L.
9.7 Dalet
9.8 Tedial
9.9 Prime Focus Technologies
9.10 Dell Technologies Inc.
9.11 International Business Machines Corp.
9.12 Bynder BV
List of Tables
1 Global Media Asset Management Market Outlook, By Region (2020-2028) ($MN)
2 Global Media Asset Management Market Outlook, By Deployment (2020-2028) ($MN)
3 Global Media Asset Management Market Outlook, By On-Premise (2020-2028) ($MN)
4 Global Media Asset Management Market Outlook, By Cloud (2020-2028) ($MN)
5 Global Media Asset Management Market Outlook, By Enterprise Size (2020-2028) ($MN)
6 Global Media Asset Management Market Outlook, By Large Enterprise (2020-2028) ($MN)
7 Global Media Asset Management Market Outlook, By Small & Medium Size Enterprise (2020-2028) ($MN)
8 North America Media Asset Management Market Outlook, By Country (2020-2028) ($MN)
9 North America Media Asset Management Market Outlook, By Deployment (2020-2028) ($MN)
10 North America Media Asset Management Market Outlook, By On-Premise (2020-2028) ($MN)
11 North America Media Asset Management Market Outlook, By Cloud (2020-2028) ($MN)
12 North America Media Asset Management Market Outlook, By Enterprise Size (2020-2028) ($MN)
13 North America Media Asset Management Market Outlook, By Large Enterprise (2020-2028) ($MN)
14 North America Media Asset Management Market Outlook, By Small & Medium Size Enterprise (2020-2028) ($MN)
15 Europe Media Asset Management Market Outlook, By Country (2020-2028) ($MN)
16 Europe Media Asset Management Market Outlook, By Deployment (2020-2028) ($MN)
17 Europe Media Asset Management Market Outlook, By On-Premise (2020-2028) ($MN)
18 Europe Media Asset Management Market Outlook, By Cloud (2020-2028) ($MN)
19 Europe Media Asset Management Market Outlook, By Enterprise Size (2020-2028) ($MN)
20 Europe Media Asset Management Market Outlook, By Large Enterprise (2020-2028) ($MN)
21 Europe Media Asset Management Market Outlook, By Small & Medium Size Enterprise (2020-2028) ($MN)
22 Asia Pacific Media Asset Management Market Outlook, By Country (2020-2028) ($MN)
23 Asia Pacific Media Asset Management Market Outlook, By Deployment (2020-2028) ($MN)
24 Asia Pacific Media Asset Management Market Outlook, By On-Premise (2020-2028) ($MN)
25 Asia Pacific Media Asset Management Market Outlook, By Cloud (2020-2028) ($MN)
26 Asia Pacific Media Asset Management Market Outlook, By Enterprise Size (2020-2028) ($MN)
27 Asia Pacific Media Asset Management Market Outlook, By Large Enterprise (2020-2028) ($MN)
28 Asia Pacific Media Asset Management Market Outlook, By Small & Medium Size Enterprise (2020-2028) ($MN)
29 South America Media Asset Management Market Outlook, By Country (2020-2028) ($MN)
30 South America Media Asset Management Market Outlook, By Deployment (2020-2028) ($MN)
31 South America Media Asset Management Market Outlook, By On-Premise (2020-2028) ($MN)
32 South America Media Asset Management Market Outlook, By Cloud (2020-2028) ($MN)
33 South America Media Asset Management Market Outlook, By Enterprise Size (2020-2028) ($MN)
34 South America Media Asset Management Market Outlook, By Large Enterprise (2020-2028) ($MN)
35 South America Media Asset Management Market Outlook, By Small & Medium Size Enterprise (2020-2028) ($MN)
36 Middle East & Africa Media Asset Management Market Outlook, By Country (2020-2028) ($MN)
37 Middle East & Africa Media Asset Management Market Outlook, By Deployment (2020-2028) ($MN)
38 Middle East & Africa Media Asset Management Market Outlook, By On-Premise (2020-2028) ($MN)
39 Middle East & Africa Media Asset Management Market Outlook, By Cloud (2020-2028) ($MN)
40 Middle East & Africa Media Asset Management Market Outlook, By Enterprise Size (2020-2028) ($MN)
41 Middle East & Africa Media Asset Management Market Outlook, By Large Enterprise (2020-2028) ($MN)
42 Middle East & Africa Media Asset Management Market Outlook, By Small & Medium Size Enterprise (2020-2028) ($MN)
List of Figures
RESEARCH METHODOLOGY

We at ‘Stratistics’ opt for an extensive research approach which involves data mining, data validation, and data analysis. The various research sources include in-house repository, secondary research, competitor’s sources, social media research, client internal data, and primary research.
Our team of analysts prefers the most reliable and authenticated data sources in order to perform the comprehensive literature search. With access to most of the authenticated data bases our team highly considers the best mix of information through various sources to obtain extensive and accurate analysis.
Each report takes an average time of a month and a team of 4 industry analysts. The time may vary depending on the scope and data availability of the desired market report. The various parameters used in the market assessment are standardized in order to enhance the data accuracy.
Data Mining
The data is collected from several authenticated, reliable, paid and unpaid sources and is filtered depending on the scope & objective of the research. Our reports repository acts as an added advantage in this procedure. Data gathering from the raw material suppliers, distributors and the manufacturers is performed on a regular basis, this helps in the comprehensive understanding of the products value chain. Apart from the above mentioned sources the data is also collected from the industry consultants to ensure the objective of the study is in the right direction.
Market trends such as technological advancements, regulatory affairs, market dynamics (Drivers, Restraints, Opportunities and Challenges) are obtained from scientific journals, market related national & international associations and organizations.
Data Analysis
From the data that is collected depending on the scope & objective of the research the data is subjected for the analysis. The critical steps that we follow for the data analysis include:
- Product Lifecycle Analysis
- Competitor analysis
- Risk analysis
- Porters Analysis
- PESTEL Analysis
- SWOT Analysis
The data engineering is performed by the core industry experts considering both the Marketing Mix Modeling and the Demand Forecasting. The marketing mix modeling makes use of multiple-regression techniques to predict the optimal mix of marketing variables. Regression factor is based on a number of variables and how they relate to an outcome such as sales or profits.
Data Validation
The data validation is performed by the exhaustive primary research from the expert interviews. This includes telephonic interviews, focus groups, face to face interviews, and questionnaires to validate our research from all aspects. The industry experts we approach come from the leading firms, involved in the supply chain ranging from the suppliers, distributors to the manufacturers and consumers so as to ensure an unbiased analysis.
We are in touch with more than 15,000 industry experts with the right mix of consultants, CEO's, presidents, vice presidents, managers, experts from both supply side and demand side, executives and so on.
The data validation involves the primary research from the industry experts belonging to:
- Leading Companies
- Suppliers & Distributors
- Manufacturers
- Consumers
- Industry/Strategic Consultants
Apart from the data validation the primary research also helps in performing the fill gap research, i.e. providing solutions for the unmet needs of the research which helps in enhancing the reports quality.
For more details about research methodology, kindly write to us at info@strategymrc.com
Frequently Asked Questions
In case of any queries regarding this report, you can contact the customer service by filing the “Inquiry Before Buy” form available on the right hand side. You may also contact us through email: info@strategymrc.com or phone: +1-301-202-5929
Yes, the samples are available for all the published reports. You can request them by filling the “Request Sample” option available in this page.
Yes, you can request a sample with your specific requirements. All the customized samples will be provided as per the requirement with the real data masked.
All our reports are available in Digital PDF format. In case if you require them in any other formats, such as PPT, Excel etc you can submit a request through “Inquiry Before Buy” form available on the right hand side. You may also contact us through email: info@strategymrc.com or phone: +1-301-202-5929
We offer a free 15% customization with every purchase. This requirement can be fulfilled for both pre and post sale. You may send your customization requirements through email at info@strategymrc.com or call us on +1-301-202-5929.
We have 3 different licensing options available in electronic format.
- Single User Licence: Allows one person, typically the buyer, to have access to the ordered product. The ordered product cannot be distributed to anyone else.
- 2-5 User Licence: Allows the ordered product to be shared among a maximum of 5 people within your organisation.
- Corporate License: Allows the product to be shared among all employees of your organisation regardless of their geographical location.
All our reports are typically be emailed to you as an attachment.
To order any available report you need to register on our website. The payment can be made either through CCAvenue or PayPal payments gateways which accept all international cards.
We extend our support to 6 months post sale. A post sale customization is also provided to cover your unmet needs in the report.
Request Customization
We offer complimentary customization of up to 15% with every purchase. To share your customization requirements, feel free to email us at info@strategymrc.com or call us on +1-301-202-5929. .
Please Note: Customization within the 15% threshold is entirely free of charge. If your request exceeds this limit, we will conduct a feasibility assessment. Following that, a detailed quote and timeline will be provided.
WHY CHOOSE US ?

Assured Quality
Best in class reports with high standard of research integrity

24X7 Research Support
Continuous support to ensure the best customer experience.

Free Customization
Adding more values to your product of interest.

Safe & Secure Access
Providing a secured environment for all online transactions.

Trusted by 600+ Brands
Serving the most reputed brands across the world.