
Mobile Payment Gateways Market
Mobile Payment Gateways Market Forecasts to 2034 - Global Analysis By Component (Platform/Solutions, Services), Payment Type, Deployment Mode, Enterprise Size, End User and By Geography

|
Years Covered |
2023-2034 |
|
Estimated Year Value (2026) |
US $50.18 BN |
|
Projected Year Value (2034) |
US $254.50 BN |
|
CAGR (2026-2034) |
22.5% |
|
Regions Covered |
North America, Europe, Asia Pacific, South America, and Rest of the World (RoW) |
|
Countries Covered |
United States, Canada, Mexico, United Kingdom, Germany, France, Italy, Spain, Netherlands, Belgium, Sweden, Switzerland, Poland, Rest of Europe, China, Japan, India, South Korea, Australia, Indonesia, Thailand, Malaysia, Singapore, Vietnam, Rest of Asia Pacific, Brazil, Argentina, Colombia, Chile, Peru, Rest of South America, Saudi Arabia, United Arab Emirates, Qatar, Israel, Rest of Middle East, South Africa, Egypt, Morocco, and Rest of Africa. |
|
Largest Market |
Asia Pacific |
|
Highest Growing Market |
Asia Pacific |
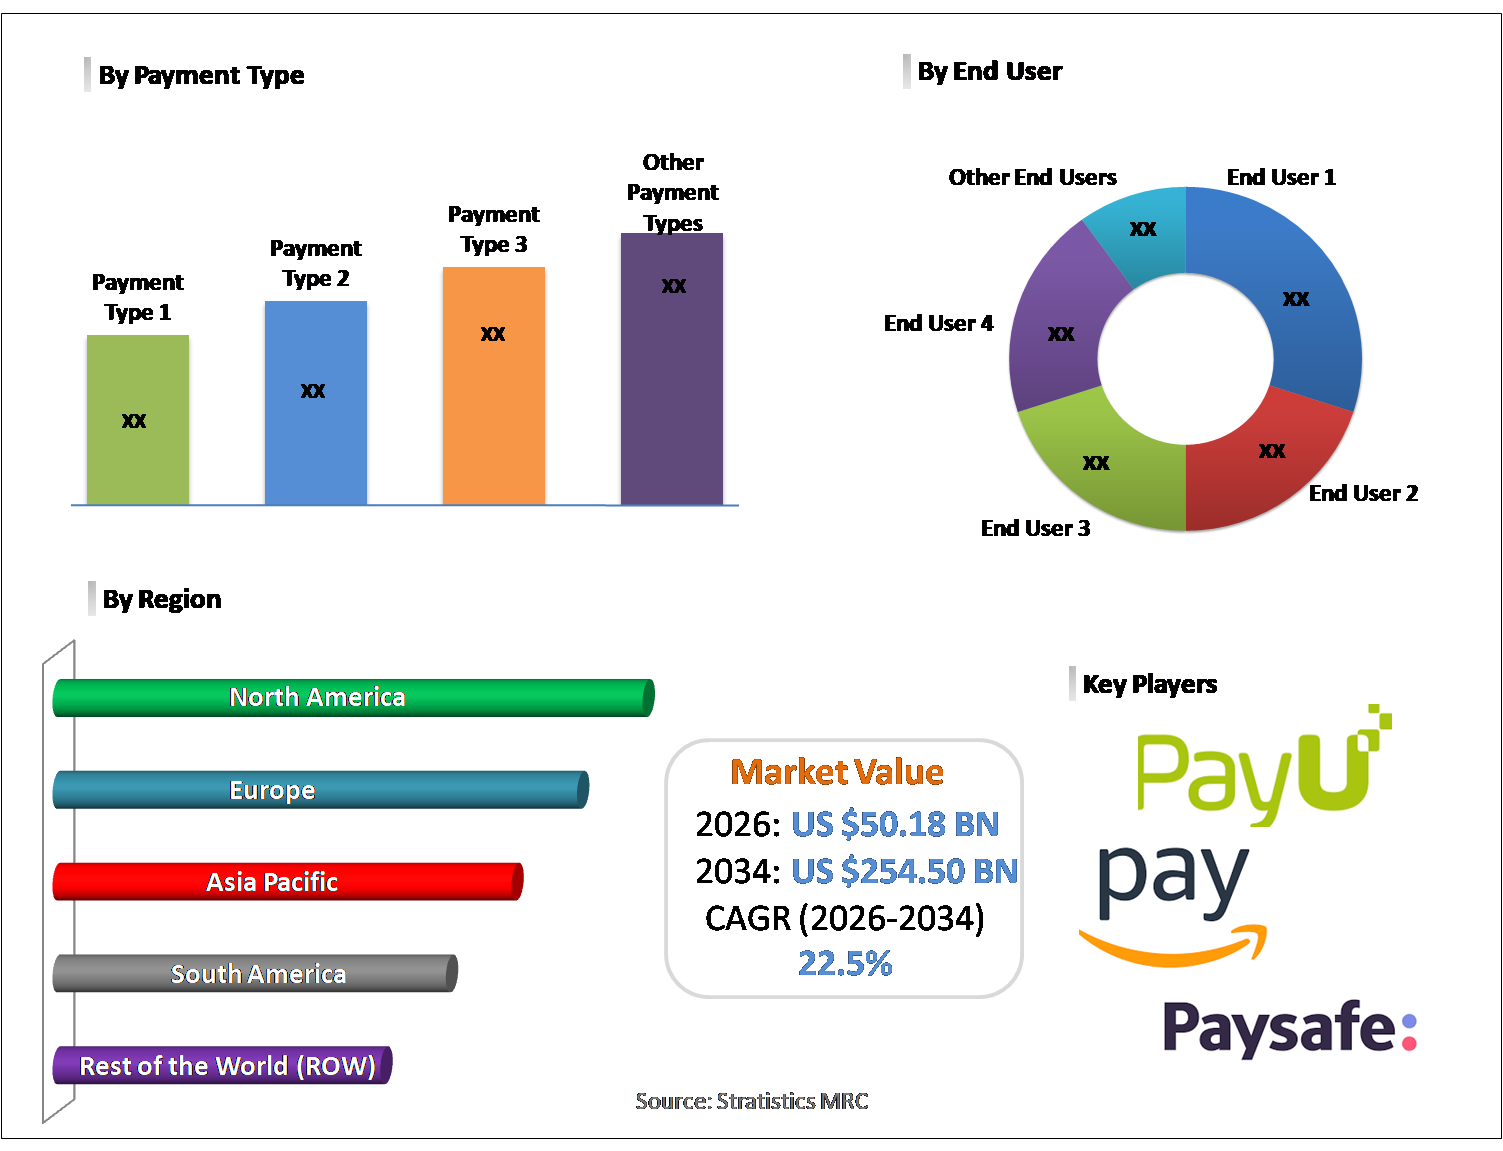
According to Stratistics MRC, the Global Mobile Payment Gateways Market is accounted for $50.18 billion in 2026 and is expected to reach $254.50 billion by 2034 growing at a CAGR of 22.5% during the forecast period. Mobile payment gateways are secure digital platforms that enable financial transactions through smartphones and other mobile devices. They act as intermediaries between customers, merchants, and financial institutions, facilitating the authorization, processing, and settlement of payments in real time. By integrating encryption, tokenization, and authentication technologies, mobile payment gateways help protect sensitive data while supporting multiple payment methods such as cards, digital wallets, and bank transfers. These solutions enhance convenience, speed, and operational efficiency for modern commerce ecosystems. They are essential to the growth of seamless mobile commerce worldwide and adoption.
Market Dynamics:
Driver:
Rapid smartphone and internet penetration
The rapid penetration of smartphones and expanding internet connectivity are significantly propelling the market. Increasing affordability of smart devices and widespread deployment of high-speed mobile networks has enabled consumers to adopt digital payment methods more readily. Emerging economies, in particular, are witnessing a surge in mobile-first users who prefer convenient, cashless transactions. This growing digital ecosystem is encouraging merchants and financial institutions to integrate mobile payment gateways, thereby accelerating transaction volumes and strengthening the overall market growth trajectory.
Restraint:
Security and fraud concerns
Security vulnerabilities and rising incidences of digital payment fraud continue to restrain market growth. Concerns related to data breaches, identity theft, and unauthorized transactions often undermine consumer trust in mobile payment systems. Despite advancements in encryption, tokenization, and biometric authentication, cybercriminals constantly evolve their tactics, creating persistent risks. Regulatory scrutiny and compliance requirements further add to operational complexity for service providers. These factors collectively slow adoption among cautious users and smaller merchants.
Opportunity:
Expanding merchant acceptance ecosystem
The expanding merchant acceptance ecosystem presents a strong growth opportunity for mobile payment gateway providers. Increasing digitization of retail, hospitality, transportation, and service sectors is encouraging businesses of all sizes to adopt mobile-enabled payment infrastructure. The rise of QR code payments and integrated POS solutions is further simplifying merchant onboarding. As small and medium enterprises increasingly embrace digital commerce to enhance customer experience and operational efficiency, the demand for scalable, interoperable mobile payment gateway solutions is expected to grow substantially.
Threat:
Complex and fragmented regulations
Complex and fragmented regulatory frameworks across countries pose a significant threat to market expansion. Mobile payment gateway providers must navigate varying compliance requirements related to data privacy, cross-border transactions, licensing, and financial security standards. For global players, maintaining consistent service delivery while adhering to multiple jurisdictions becomes challenging. This regulatory uncertainty can hinder innovation, slow partnerships, and create barriers for new entrants in the mobile payments ecosystem.
Covid-19 Impact:
The COVID-19 pandemic positively accelerated the adoption of mobile payment gateways as consumers and businesses shifted toward contactless and remote transactions. Lockdowns and hygiene concerns significantly reduced cash usage and boosted digital payment volumes across e-commerce and retail sectors. Financial institutions and fintech providers rapidly enhanced mobile payment capabilities to meet surging demand. Although initial disruptions affected some industries, the pandemic ultimately reinforced long-term behavioral changes, positioning mobile payment gateways as a critical component of the post-pandemic digital economy.
The debit card segment is expected to be the largest during the forecast period
The debit card segment is expected to account for the largest market share during the forecast period, due to its widespread consumer adoption and direct linkage to bank accounts. Debit cards offer users a convenient and controlled spending mechanism without incurring credit liabilities, making them highly preferred for everyday mobile transactions. Strong banking penetration, particularly in emerging markets, along with integration of debit cards into digital wallets and mobile apps, continues to drive transaction volumes and solidify the segment’s dominant position.
The healthcare segment is expected to have the highest CAGR during the forecast period
Over the forecast period, the healthcare segment is predicted to witness the highest growth rate, due to rapid digital transformation of healthcare payment systems. Increasing adoption of telemedicine, online pharmacy platforms, and digital hospital billing solutions is driving demand for secure and seamless mobile payment capabilities. Patients increasingly prefer contactless payment options for convenience and safety. Additionally, healthcare providers are investing in integrated payment infrastructures to streamline revenue cycles, improve patient experience, and support the broader shift toward digital health ecosystems.
Region with largest share:
During the forecast period, the Asia Pacific region is expected to hold the largest market share, due to its vast smartphone user base, strong digital payment culture, and supportive government initiatives promoting cashless economies. Countries such as China, India, and Southeast Asian nations are experiencing rapid fintech innovation and widespread QR code payment adoption. The presence of major mobile wallet providers and expanding e-commerce activity further strengthen regional dominance, making Asia Pacific the primary revenue contributor in the global mobile payment gateways market.
Region with highest CAGR:
Over the forecast period, the Asia Pacific region is anticipated to exhibit the highest CAGR, owing to accelerating financial inclusion efforts, expanding mobile internet infrastructure, and rising merchant digitization across emerging economies. Increasing investments by fintech companies and favorable regulatory support for digital payments are fostering rapid market expansion. Moreover, a large unbanked and underbanked population is transitioning directly to mobile-based financial services, creating strong growth momentum and positioning the region as the fastest-growing market globally.

Key players in the market
Some of the key players in Mobile Payment Gateways Market include PayPal, Stripe, Adyen, Block (Square), Checkout.com, Worldpay, Fiserv, Fidelity National Information Services, Global Payments, ACI Worldwide, Paysafe, PayU, Alipay, WeChat Pay (Tenpay) and Amazon Pay.
Key Developments:
In February 2026, Amazon has launched Pay by Bank, a secure, card-free payment option in the UK that lets customers pay directly from their bank accounts. The solution uses biometric or PIN authentication through banking apps, eliminates stored card details, and enables near-instant refunds, enhancing checkout speed and security.
In November 2024, Amazon announced an additional $4 billion investment in Anthropic to deepen their generative AI partnership. The deal establishes AWS as Anthropic’s primary cloud and training partner, using Trainium and Inferentia chips, and brings Amazon’s total commitment to $8 billion while maintaining a minority stake.
Components Covered:
• Platform/Solutions
• Services
Payment Types Covered:
• Credit Card
• Debit Card
• Digital Wallets
• Bank Transfers
• Buy Now Pay Later (BNPL)
• Other Payment Types
Deployment Modes Covered:
• Cloud-Based
• On-Premise
Enterprise Sizes Covered:
• Small & Medium Enterprises (SMEs)
• Large Enterprises
End Users Covered:
• Retail & E-commerce
• Banking, Financial Services & Insurance (BFSI)
• Travel & Hospitality
• Healthcare
• Media & Entertainment
• Education
• Other End Users
Regions Covered:
• North America
o United States
o Canada
o Mexico
• Europe
o United Kingdom
o Germany
o France
o Italy
o Spain
o Netherlands
o Belgium
o Sweden
o Switzerland
o Poland
o Rest of Europe
• Asia Pacific
o China
o Japan
o India
o South Korea
o Australia
o Indonesia
o Thailand
o Malaysia
o Singapore
o Vietnam
o Rest of Asia Pacific
• South America
o Brazil
o Argentina
o Colombia
o Chile
o Peru
o Rest of South America
• Rest of the World (RoW)
o Middle East
§ Saudi Arabia
§ United Arab Emirates
§ Qatar
§ Israel
§ Rest of Middle East
o Africa
§ South Africa
§ Egypt
§ Morocco
§ Rest of Africa
What our report offers:
- Market share assessments for the regional and country-level segments
- Strategic recommendations for the new entrants
- Covers Market data for the years 2023, 2024, 2025, 2026, 2027, 2028, 2030, 2032 and 2034
- Market Trends (Drivers, Constraints, Opportunities, Threats, Challenges, Investment Opportunities, and recommendations)
- Strategic recommendations in key business segments based on the market estimations
- Competitive landscaping mapping the key common trends
- Company profiling with detailed strategies, financials, and recent developments
- Supply chain trends mapping the latest technological advancements
Free Customization Offerings:
All the customers of this report will be entitled to receive one of the following free customization options:
• Company Profiling
o Comprehensive profiling of additional market players (up to 3)
o SWOT Analysis of key players (up to 3)
• Regional Segmentation
o Market estimations, Forecasts and CAGR of any prominent country as per the client's interest (Note: Depends on feasibility check)
• Competitive Benchmarking
o Benchmarking of key players based on product portfolio, geographical presence, and strategic alliances
Table of Contents
1 Executive Summary
1.1 Market Snapshot and Key Highlights
1.2 Growth Drivers, Challenges, and Opportunities
1.3 Competitive Landscape Overview
1.4 Strategic Insights and Recommendations
2 Research Framework
2.1 Study Objectives and Scope
2.2 Stakeholder Analysis
2.3 Research Assumptions and Limitations
2.4 Research Methodology
2.4.1 Data Collection (Primary and Secondary)
2.4.2 Data Modeling and Estimation Techniques
2.4.3 Data Validation and Triangulation
2.4.4 Analytical and Forecasting Approach
3 Market Dynamics and Trend Analysis
3.1 Market Definition and Structure
3.2 Key Market Drivers
3.3 Market Restraints and Challenges
3.4 Growth Opportunities and Investment Hotspots
3.5 Industry Threats and Risk Assessment
3.6 Technology and Innovation Landscape
3.7 Emerging and High-Growth Markets
3.8 Regulatory and Policy Environment
3.9 Impact of COVID-19 and Recovery Outlook
4 Competitive and Strategic Assessment
4.1 Porter's Five Forces Analysis
4.1.1 Supplier Bargaining Power
4.1.2 Buyer Bargaining Power
4.1.3 Threat of Substitutes
4.1.4 Threat of New Entrants
4.1.5 Competitive Rivalry
4.2 Market Share Analysis of Key Players
4.3 Product Benchmarking and Performance Comparison
5 Global Mobile Payment Gateways Market, By Component
5.1 Platform/Solutions
5.2 Services
6 Global Mobile Payment Gateways Market, By Payment Type
6.1 Credit Card
6.2 Debit Card
6.3 Digital Wallets
6.4 Bank Transfers
6.5 Buy Now Pay Later (BNPL)
6.6 Other Payment Types
7 Global Mobile Payment Gateways Market, By Deployment Mode
7.1 Cloud-Based
7.2 On-Premise
8 Global Mobile Payment Gateways Market, By Enterprise Size
8.1 Small & Medium Enterprises (SMEs)
8.2 Large Enterprises
9 Global Mobile Payment Gateways Market, By End User
9.1 Retail & E-commerce
9.2 Banking, Financial Services & Insurance (BFSI)
9.3 Travel & Hospitality
9.4 Healthcare
9.5 Media & Entertainment
9.6 Education
9.7 Other End Users
10 Global Mobile Payment Gateways Market, By Geography
10.1 North America
10.1.1 United States
10.1.2 Canada
10.1.3 Mexico
10.2 Europe
10.2.1 United Kingdom
10.2.2 Germany
10.2.3 France
10.2.4 Italy
10.2.5 Spain
10.2.6 Netherlands
10.2.7 Belgium
10.2.8 Sweden
10.2.9 Switzerland
10.2.10 Poland
10.2.11 Rest of Europe
10.3 Asia Pacific
10.3.1 China
10.3.2 Japan
10.3.3 India
10.3.4 South Korea
10.3.5 Australia
10.3.6 Indonesia
10.3.7 Thailand
10.3.8 Malaysia
10.3.9 Singapore
10.3.10 Vietnam
10.3.11 Rest of Asia Pacific
10.4 South America
10.4.1 Brazil
10.4.2 Argentina
10.4.3 Colombia
10.4.4 Chile
10.4.5 Peru
10.4.6 Rest of South America
10.5 Rest of the World (RoW)
10.5.1 Middle East
10.5.1.1 Saudi Arabia
10.5.1.2 United Arab Emirates
10.5.1.3 Qatar
10.5.1.4 Israel
10.5.1.5 Rest of Middle East
10.5.2 Africa
10.5.2.1 South Africa
10.5.2.2 Egypt
10.5.2.3 Morocco
10.5.2.4 Rest of Africa
11 Strategic Market Intelligence
11.1 Industry Value Network and Supply Chain Assessment
11.2 White-Space and Opportunity Mapping
11.3 Product Evolution and Market Life Cycle Analysis
11.4 Channel, Distributor, and Go-to-Market Assessment
12 Industry Developments and Strategic Initiatives
12.1 Mergers and Acquisitions
12.2 Partnerships, Alliances, and Joint Ventures
12.3 New Product Launches and Certifications
12.4 Capacity Expansion and Investments
12.5 Other Strategic Initiatives
13 Company Profiles
13.1 PayPal
13.2 Stripe
13.3 Adyen
13.4 Block (Square)
13.5 Checkout.com
13.6 Worldpay
13.7 Fiserv
13.8 Fidelity National Information Services
13.9 Global Payments
13.10 ACI Worldwide
13.11 Paysafe
13.12 PayU
13.13 Alipay
13.14 WeChat Pay (Tenpay)
13.15 Amazon Pay
List of Tables
1 Global Mobile Payment Gateways Market Outlook, By Region (2023-2034) ($MN)
2 Global Mobile Payment Gateways Market Outlook, By Component (2023-2034) ($MN)
3 Global Mobile Payment Gateways Market Outlook, By Platform/Solutions (2023-2034) ($MN)
4 Global Mobile Payment Gateways Market Outlook, By Services (2023-2034) ($MN)
5 Global Mobile Payment Gateways Market Outlook, By Payment Type (2023-2034) ($MN)
6 Global Mobile Payment Gateways Market Outlook, By Credit Card (2023-2034) ($MN)
7 Global Mobile Payment Gateways Market Outlook, By Debit Card (2023-2034) ($MN)
8 Global Mobile Payment Gateways Market Outlook, By Digital Wallets (2023-2034) ($MN)
9 Global Mobile Payment Gateways Market Outlook, By Bank Transfers (2023-2034) ($MN)
10 Global Mobile Payment Gateways Market Outlook, By Buy Now Pay Later (BNPL) (2023-2034) ($MN)
11 Global Mobile Payment Gateways Market Outlook, By Other Payment Types (2023-2034) ($MN)
12 Global Mobile Payment Gateways Market Outlook, By Deployment Mode (2023-2034) ($MN)
13 Global Mobile Payment Gateways Market Outlook, By Cloud-Based (2023-2034) ($MN)
14 Global Mobile Payment Gateways Market Outlook, By On-Premise (2023-2034) ($MN)
15 Global Mobile Payment Gateways Market Outlook, By Enterprise Size (2023-2034) ($MN)
16 Global Mobile Payment Gateways Market Outlook, By Small & Medium Enterprises (SMEs) (2023-2034) ($MN)
17 Global Mobile Payment Gateways Market Outlook, By Large Enterprises (2023-2034) ($MN)
18 Global Mobile Payment Gateways Market Outlook, By End User (2023-2034) ($MN)
19 Global Mobile Payment Gateways Market Outlook, By Retail & E-commerce (2023-2034) ($MN)
20 Global Mobile Payment Gateways Market Outlook, By Banking, Financial Services & Insurance (BFSI) (2023-2034) ($MN)
21 Global Mobile Payment Gateways Market Outlook, By Travel & Hospitality (2023-2034) ($MN)
22 Global Mobile Payment Gateways Market Outlook, By Healthcare (2023-2034) ($MN)
23 Global Mobile Payment Gateways Market Outlook, By Media & Entertainment (2023-2034) ($MN)
24 Global Mobile Payment Gateways Market Outlook, By Education (2023-2034) ($MN)
25 Global Mobile Payment Gateways Market Outlook, By Other End Users (2023-2034) ($MN)
Note: Tables for North America, Europe, APAC, South America, and Rest of the World (RoW) Regions are also represented in the same manner as above.
List of Figures
RESEARCH METHODOLOGY

We at ‘Stratistics’ opt for an extensive research approach which involves data mining, data validation, and data analysis. The various research sources include in-house repository, secondary research, competitor’s sources, social media research, client internal data, and primary research.
Our team of analysts prefers the most reliable and authenticated data sources in order to perform the comprehensive literature search. With access to most of the authenticated data bases our team highly considers the best mix of information through various sources to obtain extensive and accurate analysis.
Each report takes an average time of a month and a team of 4 industry analysts. The time may vary depending on the scope and data availability of the desired market report. The various parameters used in the market assessment are standardized in order to enhance the data accuracy.
Data Mining
The data is collected from several authenticated, reliable, paid and unpaid sources and is filtered depending on the scope & objective of the research. Our reports repository acts as an added advantage in this procedure. Data gathering from the raw material suppliers, distributors and the manufacturers is performed on a regular basis, this helps in the comprehensive understanding of the products value chain. Apart from the above mentioned sources the data is also collected from the industry consultants to ensure the objective of the study is in the right direction.
Market trends such as technological advancements, regulatory affairs, market dynamics (Drivers, Restraints, Opportunities and Challenges) are obtained from scientific journals, market related national & international associations and organizations.
Data Analysis
From the data that is collected depending on the scope & objective of the research the data is subjected for the analysis. The critical steps that we follow for the data analysis include:
- Product Lifecycle Analysis
- Competitor analysis
- Risk analysis
- Porters Analysis
- PESTEL Analysis
- SWOT Analysis
The data engineering is performed by the core industry experts considering both the Marketing Mix Modeling and the Demand Forecasting. The marketing mix modeling makes use of multiple-regression techniques to predict the optimal mix of marketing variables. Regression factor is based on a number of variables and how they relate to an outcome such as sales or profits.
Data Validation
The data validation is performed by the exhaustive primary research from the expert interviews. This includes telephonic interviews, focus groups, face to face interviews, and questionnaires to validate our research from all aspects. The industry experts we approach come from the leading firms, involved in the supply chain ranging from the suppliers, distributors to the manufacturers and consumers so as to ensure an unbiased analysis.
We are in touch with more than 15,000 industry experts with the right mix of consultants, CEO's, presidents, vice presidents, managers, experts from both supply side and demand side, executives and so on.
The data validation involves the primary research from the industry experts belonging to:
- Leading Companies
- Suppliers & Distributors
- Manufacturers
- Consumers
- Industry/Strategic Consultants
Apart from the data validation the primary research also helps in performing the fill gap research, i.e. providing solutions for the unmet needs of the research which helps in enhancing the reports quality.
For more details about research methodology, kindly write to us at info@strategymrc.com
Frequently Asked Questions
In case of any queries regarding this report, you can contact the customer service by filing the “Inquiry Before Buy” form available on the right hand side. You may also contact us through email: info@strategymrc.com or phone: +1-301-202-5929
Yes, the samples are available for all the published reports. You can request them by filling the “Request Sample” option available in this page.
Yes, you can request a sample with your specific requirements. All the customized samples will be provided as per the requirement with the real data masked.
All our reports are available in Digital PDF format. In case if you require them in any other formats, such as PPT, Excel etc you can submit a request through “Inquiry Before Buy” form available on the right hand side. You may also contact us through email: info@strategymrc.com or phone: +1-301-202-5929
We offer a free 15% customization with every purchase. This requirement can be fulfilled for both pre and post sale. You may send your customization requirements through email at info@strategymrc.com or call us on +1-301-202-5929.
We have 3 different licensing options available in electronic format.
- Single User Licence: Allows one person, typically the buyer, to have access to the ordered product. The ordered product cannot be distributed to anyone else.
- 2-5 User Licence: Allows the ordered product to be shared among a maximum of 5 people within your organisation.
- Corporate License: Allows the product to be shared among all employees of your organisation regardless of their geographical location.
All our reports are typically be emailed to you as an attachment.
To order any available report you need to register on our website. The payment can be made either through CCAvenue or PayPal payments gateways which accept all international cards.
We extend our support to 6 months post sale. A post sale customization is also provided to cover your unmet needs in the report.
Request Customization
We offer complimentary customization of up to 15% with every purchase. To share your customization requirements, feel free to email us at info@strategymrc.com or call us on +1-301-202-5929. .
Please Note: Customization within the 15% threshold is entirely free of charge. If your request exceeds this limit, we will conduct a feasibility assessment. Following that, a detailed quote and timeline will be provided.
WHY CHOOSE US ?

Assured Quality
Best in class reports with high standard of research integrity

24X7 Research Support
Continuous support to ensure the best customer experience.

Free Customization
Adding more values to your product of interest.

Safe & Secure Access
Providing a secured environment for all online transactions.

Trusted by 600+ Brands
Serving the most reputed brands across the world.