
Molybdenum Trioxide Nanopowder Market
Molybdenum Trioxide Nanopowder Market Forecasts to 2028 - Global Analysis By Particle Size (<80 nm, 80-100 nm and Other Particle Sizes), Purity (>99.99%, -99.94%-99.99%, -99.5%-99.94% and Other Purities), Application (Electrochemical Capacitors, Catalysts and Other Applications), End User (Automotive and Transportation, Ceramics and Other End Users) and Geography

|
Years Covered |
2020-2028 |
|
Estimated Year Value (2022) |
US $1.8 BN |
|
Projected Year Value (2028) |
US $4.4 BN |
|
CAGR (2022 - 2028) |
15.5% |
|
Regions Covered |
North America, Europe, Asia Pacific, South America, and Middle East & Africa |
|
Countries Covered |
US, Canada, Mexico, Germany, UK, Italy, France, Spain, Japan, China, India, Australia, New Zealand, South Korea, Rest of Asia Pacific, South America, Argentina, Brazil, Chile, Middle East & Africa, Saudi Arabia, UAE, Qatar, and South Africa |
|
Largest Market |
Asia Pacific |
|
Highest Growing Market |
Europe |
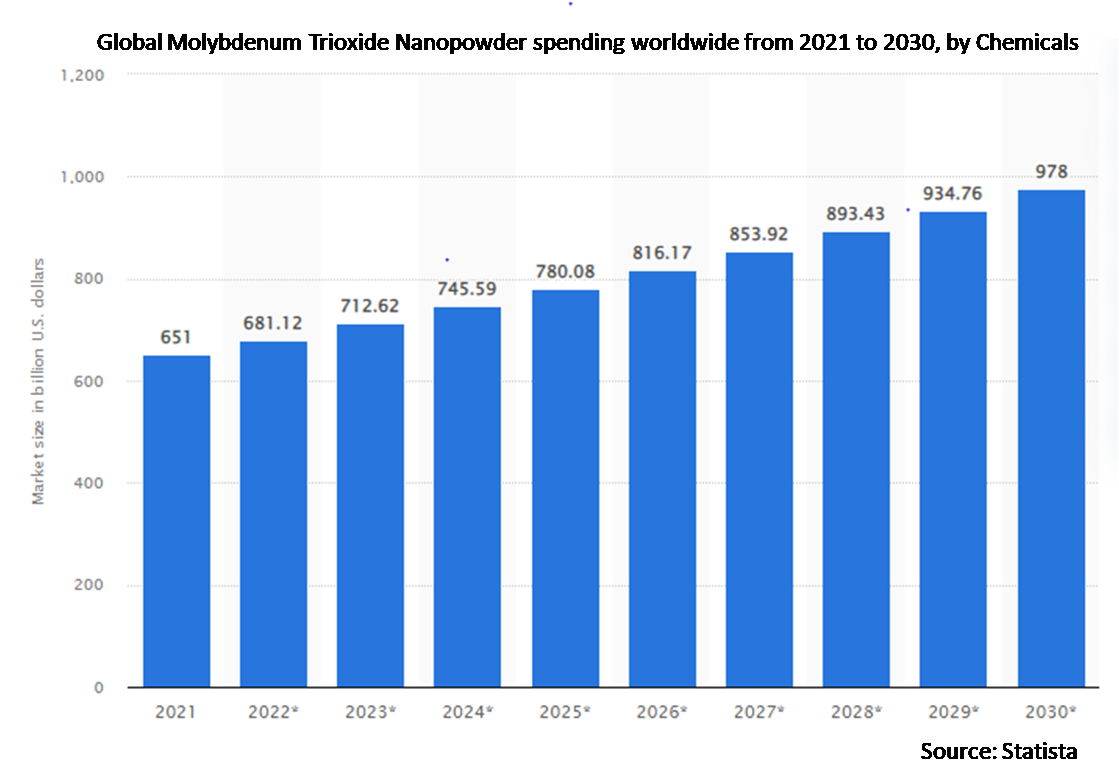
According to Stratistics MRC, the Global Molybdenum Trioxide Nanopowder Market is accounted for $1.8 billion in 2022 and is expected to reach $4.4 billion by 2028 growing at a CAGR of 15.5% during the forecast period. High-purity molybdenum oxide is available as MoO3 nanopowder. Molybdenum trioxide is a suitable material to be used in catalysis, such as cracking catalysis, electrocatalysis, photocatalysis, and hydrogenation catalysis, due to its properties, such as better temperature stability and higher mechanical strength than its bulk counterpart. With MoO3 octahedra that overlap edges and verges, the molybdenum trioxide structure is uniquely layered and takes the form of a puckered-layered unit.
According to Penn State and North-eastern University, wearable gas sensors for environmental and human health monitoring are expected to be commercially available in the near future.
Market Dynamics:
Driver:
Rise in Usage of Electrochemical Energy Storage
Increased investment in the renewable sector is expected to aid in supplying the growing demand for energy worldwide. Systems for storing energy play an essential role in the storage of renewable energy. Additionally, they assist the grid's efficient integration of renewable energy sources. Systems for storing electrochemical energy have the ability to significantly aid in the development of sustainable energy. They absorb, store, and discharge electrical energy. As a result, the development of flexible, portable electronics and energy storage technologies, primarily fuel cells and supercapacitors, has increased. Furthermore, they enable consistent power production, peak and frequency control, and reserve capacity. As a result, a majority of energy-related companies are making massive investments in energy storage technologies, which is promoting market growth.
Restraint:
High price of Advanced Ceramics to Restrict Growth
The high cost of cutting-edge products has limited their use in many industries. Due to the expense of their R&D, production process, and use of premium stones, their products are expensive. High-end machinery is needed for process stages such as raw material processing, sintering, and diamond grinding, which raises the product's cost and consequently its price. Additionally, sophisticated ceramics are more expensive than metal and alloy alternatives because they have higher abrasion and electrical resistance. Furthermore, the demand for customised products from end users drives up the price of these materials and prevents their widespread application.
Opportunity:
Increase in Demand for Transition Metal Oxides as Catalysts
Owing to their low cost, high activity, and stability, transition metal oxides are widely used in environmental and energy catalysis. MoO3 is a transition metal oxide that offers high stability, n-type semiconductivity, and nontoxicity. As a result, MoO3 nanopowder is frequently used in redox chemistry, photocatalysis, and electrocatalysis. Additionally, it is used in catalytic cracking, electrocatalytic hydrogen evolution, photocatalytic hydrogen evolution, and ammonia borane dehydrogenation as a hydrogenation catalyst. Therefore, it is predicted that growth in the catalyst sector will increase the molybdenum trioxide nanopowder market throughout the forecast period.
Threat:
High initial cost of the gas sensors
Electronic devices become more automated with the inclusion of sensors, but it also comes with an additional expense, so it is generally avoided in applications that are intended to be more economically viable. Although the use of sensors allows for additional features and increases automation, doing so comes at a cost; hence, it is avoided in systems that are intended to be economical. Smart phones, laptops, and cameras are just a few examples of devices that are used continuously for extended periods of time. As these devices have temperature-sensitive components, the sensors in these devices cause heating problems and reduce their overall life. Because sensors depend on the device battery to function, battery-powered devices have shorter battery lives hindering the market growth.
Covid-19 Impact:
The COVID-19 epidemic had a significant effect on every aspect of the world's economies. It had a huge influence on the molybdenum trioxide nanopowder market, causing the majority of companies to change how they operated in reaction to the outbreak. The pandemic affected business revenues directly, but it also delayed overall development for most Molybdenum Trioxide Nanopowder enterprises, which had an influence on long-term goals and revenue projections.
The <80 nm segment is expected to be the largest during the forecast period
The efficacy of nanomaterials in catalysis and reaction kinetics is affected by particle size. Increased circulation, biodistribution, and clearance are imparted by nanoparticles with smaller particle sizes. This enables the unexpected optical, physical, and chemical properties of nanoparticles. This indicates that nanoparticles with particle sizes of about 80 nm improve performance.
The catalysts segment is expected to have the highest CAGR during the forecast period
Catalysts for various catalytic reactions include MoO3 nanopowder. The use of MoO3 nanopowder to minimise NOx gas emissions in the environment is likely being driven by growing pollution concerns. The electrocatalytic evolution of hydrogen uses MoO3 as a catalyst. Additionally, to generate hydrogen from water, the photocatalytic hydrogen evolution reaction is essential. Furthermore, hydrogen is one of the most viable energy carriers due to its high calorific value and clean attributes.
Region with largest share:
The Asia-Pacific region's expanding infrastructure development is to account for a substantial portion. Furthermore, the region's molybdenum trioxide nanopowder market is also expanding due to the availability of raw materials for product manufacturing. Due to the low cost of healthcare in nations like China and India, numerous initiatives are being launched to enhance sanitation and boost medical tourism in this market.
Region with highest CAGR:
The market expansion in Europe will be attributed to the region's rapid increase in technical product demand as well as the increasing use of ceramic coatings. Furthermore, the growing electronics industry in the area is also anticipated to raise demand for electro-ceramic in Molybdenum Trioxide Nanopowder market. Additionally, the rise in the export of tiles and kitchenware due to their high product quality is boosting the market in Europe.

Key players in the market
Some of the key players in Molybdenum Trioxide Nanopowder market include US Research Nanomaterials, Inc, Nanografi Nano Technology, American Elements, Nano Research Elements Inc, Merck KGaA, Nanoshel LLC, Hongwu International Group, SAT Nano Technology Material Co., Ltd, SkySpring Nanomaterials, Inc, Novarials Corporation, Hunan Fushel Technology Ltd., Shanghai Theorem Chemical Technology Co., Ltd and Edgetech Industries LLC
Key Developments:
In October 2022, Merck KGaA opened a new manufacturing facility in Martillac, France, to support the service delivery of its Life Sciences division “Millipore CTDMO” in order to increase its production capacity and flexibility. It has a 2000-liter bioreactor for rapid scaling of production. The company also announced expansion plans in its life sciences division in the U.S., Ireland, China, Germany, Switzerland, and France.
In April 2022, SAT NANO’s technical team developed a breakthrough in the nano-dispersion technology that is used to prepare a variety of nanomaterial dispersions with excellent dispersibility.
Particle Sizes Covered:
• <80 nm
• 80-100 nm
• Other Particle Sizes
Purities Covered:
• >99.99%
• ?99.94%-99.99%
• ?99.5%-99.94%
• Other Purities
Applications Covered:
• Electrochemical Capacitors
• Catalysts
• Nanofibers
• Optoelectronic Components
• Nanowires
• Gas Sensors
• Lithium-ion Batteries
• Other Applications
End Users Covered:
• Automotive and Transportation
• Ceramics
• Electronics
• Textiles
• Glass
• Chemicals
• Pigments
• Other End Users
Regions Covered:
• North America
o US
o Canada
o Mexico
• Europe
o Germany
o UK
o Italy
o France
o Spain
o Rest of Europe
• Asia Pacific
o Japan
o China
o India
o Australia
o New Zealand
o South Korea
o Rest of Asia Pacific
• South America
o Argentina
o Brazil
o Chile
o Rest of South America
• Middle East & Africa
o Saudi Arabia
o UAE
o Qatar
o South Africa
o Rest of Middle East & Africa
What our report offers:
- Market share assessments for the regional and country-level segments
- Strategic recommendations for the new entrants
- Covers Market data for the years 2020, 2021, 2022, 2025, and 2028
- Market Trends (Drivers, Constraints, Opportunities, Threats, Challenges, Investment Opportunities, and recommendations)
- Strategic recommendations in key business segments based on the market estimations
- Competitive landscaping mapping the key common trends
- Company profiling with detailed strategies, financials, and recent developments
- Supply chain trends mapping the latest technological advancements
Free Customization Offerings:
All the customers of this report will be entitled to receive one of the following free customization options:
• Company Profiling
o Comprehensive profiling of additional market players (up to 3)
o SWOT Analysis of key players (up to 3)
• Regional Segmentation
o Market estimations, Forecasts and CAGR of any prominent country as per the client's interest (Note: Depends on feasibility check)
• Competitive Benchmarking
Benchmarking of key players based on product portfolio, geographical presence, and strategic alliances
Table of Contents
1 Executive Summary
2 Preface
2.1 Abstract
2.2 Stake Holders
2.3 Research Scope
2.4 Research Methodology
2.4.1 Data Mining
2.4.2 Data Analysis
2.4.3 Data Validation
2.4.4 Research Approach
2.5 Research Sources
2.5.1 Primary Research Sources
2.5.2 Secondary Research Sources
2.5.3 Assumptions
3 Market Trend Analysis
3.1 Introduction
3.2 Drivers
3.3 Restraints
3.4 Opportunities
3.5 Threats
3.6 Application Analysis
3.7 End User Analysis
3.8 Emerging Markets
3.9 Impact of Covid-19
4 Porters Five Force Analysis
4.1 Bargaining power of suppliers
4.2 Bargaining power of buyers
4.3 Threat of substitutes
4.4 Threat of new entrants
4.5 Competitive rivalry
5 Global Molybdenum Trioxide Nanopowder Market, By Particle Size
5.1 Introduction
5.2 <80 nm
5.3 80-100 nm
5.4 Other Particle Sizes
6 Global Molybdenum Trioxide Nanopowder Market, By Purity
6.1 Introduction
6.2 >99.99%
6.3 ?99.94%-99.99%
6.4 ?99.5%-99.94%
6.5 Other Purities
7 Global Molybdenum Trioxide Nanopowder Market, By Application
7.1 Introduction
7.2 Electrochemical Capacitors
7.3 Catalysts
7.4 Nanofibers
7.5 Optoelectronic Components
7.6 Nanowires
7.7 Gas Sensors
7.8 Lithium-ion Batteries
7.9 Other Applications
8 Global Molybdenum Trioxide Nanopowder Market, By End User
8.1 Introduction
8.2 Automotive and Transportation
8.3 Ceramics
8.4 Electronics
8.5 Textiles
8.6 Glass
8.7 Chemicals
8.8 Pigments
8.9 Other End Users
9 Global Molybdenum Trioxide Nanopowder Market, By Geography
9.1 Introduction
9.2 North America
9.2.1 US
9.2.2 Canada
9.2.3 Mexico
9.3 Europe
9.3.1 Germany
9.3.2 UK
9.3.3 Italy
9.3.4 France
9.3.5 Spain
9.3.6 Rest of Europe
9.4 Asia Pacific
9.4.1 Japan
9.4.2 China
9.4.3 India
9.4.4 Australia
9.4.5 New Zealand
9.4.6 South Korea
9.4.7 Rest of Asia Pacific
9.5 South America
9.5.1 Argentina
9.5.2 Brazil
9.5.3 Chile
9.5.4 Rest of South America
9.6 Middle East & Africa
9.6.1 Saudi Arabia
9.6.2 UAE
9.6.3 Qatar
9.6.4 South Africa
9.6.5 Rest of Middle East & Africa
10 Key Developments
10.1 Agreements, Partnerships, Collaborations and Joint Ventures
10.2 Acquisitions & Mergers
10.3 New Product Launch
10.4 Expansions
10.5 Other Key Strategies
11 Company Profiling
11.1 US Research Nanomaterials, Inc
11.2 Nanografi Nano Technology
11.3 American Elements
11.4 Nano Research Elements Inc
11.5 Merck KGaA
11.6 Nanoshel LLC
11.7 Hongwu International Group
11.8 SAT Nano Technology Material Co., Ltd.
11.9 SkySpring Nanomaterials, Inc
11.10 Novarials Corporation
11.11 Hunan Fushel Technology Ltd.
11.12 Shanghai Theorem Chemical Technology Co., Ltd
11.13 Edgetech Industries LLC
List of Tables
1 Global Molybdenum Trioxide Nanopowder Market Outlook, By Region (2020-2028) ($MN)
2 Global Molybdenum Trioxide Nanopowder Market Outlook, By Particle Size (2020-2028) ($MN)
3 Global Molybdenum Trioxide Nanopowder Market Outlook, By <80 nm (2020-2028) ($MN)
4 Global Molybdenum Trioxide Nanopowder Market Outlook, By 80-100 nm (2020-2028) ($MN)
5 Global Molybdenum Trioxide Nanopowder Market Outlook, By Other Particle Size (2020-2028) ($MN)
6 Global Molybdenum Trioxide Nanopowder Market Outlook, By Purity (2020-2028) ($MN)
7 Global Molybdenum Trioxide Nanopowder Market Outlook, By >99.99% (2020-2028) ($MN)
8 Global Molybdenum Trioxide Nanopowder Market Outlook, By ?99.94%-99.99% (2020-2028) ($MN)
9 Global Molybdenum Trioxide Nanopowder Market Outlook, By ?99.5%-99.94% (2020-2028) ($MN)
10 Global Molybdenum Trioxide Nanopowder Market Outlook, By Other Purities (2020-2028) ($MN)
11 Global Molybdenum Trioxide Nanopowder Market Outlook, By Application (2020-2028) ($MN)
12 Global Molybdenum Trioxide Nanopowder Market Outlook, By Electrochemical Capacitors (2020-2028) ($MN)
13 Global Molybdenum Trioxide Nanopowder Market Outlook, By Catalysts (2020-2028) ($MN)
14 Global Molybdenum Trioxide Nanopowder Market Outlook, By Nanofibers (2020-2028) ($MN)
15 Global Molybdenum Trioxide Nanopowder Market Outlook, By Optoelectronic Components (2020-2028) ($MN)
16 Global Molybdenum Trioxide Nanopowder Market Outlook, By Nanowires (2020-2028) ($MN)
17 Global Molybdenum Trioxide Nanopowder Market Outlook, By Gas Sensors (2020-2028) ($MN)
18 Global Molybdenum Trioxide Nanopowder Market Outlook, By Lithium-ion Batteries (2020-2028) ($MN)
19 Global Molybdenum Trioxide Nanopowder Market Outlook, By Other Applications (2020-2028) ($MN)
20 Global Molybdenum Trioxide Nanopowder Market Outlook, By End User (2020-2028) ($MN)
21 Global Molybdenum Trioxide Nanopowder Market Outlook, By Automotive and Transportation (2020-2028) ($MN)
22 Global Molybdenum Trioxide Nanopowder Market Outlook, By Ceramics (2020-2028) ($MN)
23 Global Molybdenum Trioxide Nanopowder Market Outlook, By Electronics (2020-2028) ($MN)
24 Global Molybdenum Trioxide Nanopowder Market Outlook, By Textiles (2020-2028) ($MN)
25 Global Molybdenum Trioxide Nanopowder Market Outlook, By Glass (2020-2028) ($MN)
26 Global Molybdenum Trioxide Nanopowder Market Outlook, By Chemicals (2020-2028) ($MN)
27 Global Molybdenum Trioxide Nanopowder Market Outlook, By Pigments (2020-2028) ($MN)
28 Global Molybdenum Trioxide Nanopowder Market Outlook, By Other End Users (2020-2028) ($MN)
29 North America Molybdenum Trioxide Nanopowder Market Outlook, By Country (2020-2028) ($MN)
30 North America Molybdenum Trioxide Nanopowder Market Outlook, By Particle Size (2020-2028) ($MN)
31 North America Molybdenum Trioxide Nanopowder Market Outlook, By <80 nm (2020-2028) ($MN)
32 North America Molybdenum Trioxide Nanopowder Market Outlook, By 80-100 nm (2020-2028) ($MN)
33 North America Molybdenum Trioxide Nanopowder Market Outlook, By Other Particle Size (2020-2028) ($MN)
34 North America Molybdenum Trioxide Nanopowder Market Outlook, By Purity (2020-2028) ($MN)
35 North America Molybdenum Trioxide Nanopowder Market Outlook, By >99.99% (2020-2028) ($MN)
36 North America Molybdenum Trioxide Nanopowder Market Outlook, By ?99.94%-99.99% (2020-2028) ($MN)
37 North America Molybdenum Trioxide Nanopowder Market Outlook, By ?99.5%-99.94% (2020-2028) ($MN)
38 North America Molybdenum Trioxide Nanopowder Market Outlook, By Other Purities (2020-2028) ($MN)
39 North America Molybdenum Trioxide Nanopowder Market Outlook, By Application (2020-2028) ($MN)
40 North America Molybdenum Trioxide Nanopowder Market Outlook, By Electrochemical Capacitors (2020-2028) ($MN)
41 North America Molybdenum Trioxide Nanopowder Market Outlook, By Catalysts (2020-2028) ($MN)
42 North America Molybdenum Trioxide Nanopowder Market Outlook, By Nanofibers (2020-2028) ($MN)
43 North America Molybdenum Trioxide Nanopowder Market Outlook, By Optoelectronic Components (2020-2028) ($MN)
44 North America Molybdenum Trioxide Nanopowder Market Outlook, By Nanowires (2020-2028) ($MN)
45 North America Molybdenum Trioxide Nanopowder Market Outlook, By Gas Sensors (2020-2028) ($MN)
46 North America Molybdenum Trioxide Nanopowder Market Outlook, By Lithium-ion Batteries (2020-2028) ($MN)
47 North America Molybdenum Trioxide Nanopowder Market Outlook, By Other Applications (2020-2028) ($MN)
48 North America Molybdenum Trioxide Nanopowder Market Outlook, By End User (2020-2028) ($MN)
49 North America Molybdenum Trioxide Nanopowder Market Outlook, By Automotive and Transportation (2020-2028) ($MN)
50 North America Molybdenum Trioxide Nanopowder Market Outlook, By Ceramics (2020-2028) ($MN)
51 North America Molybdenum Trioxide Nanopowder Market Outlook, By Electronics (2020-2028) ($MN)
52 North America Molybdenum Trioxide Nanopowder Market Outlook, By Textiles (2020-2028) ($MN)
53 North America Molybdenum Trioxide Nanopowder Market Outlook, By Glass (2020-2028) ($MN)
54 North America Molybdenum Trioxide Nanopowder Market Outlook, By Chemicals (2020-2028) ($MN)
55 North America Molybdenum Trioxide Nanopowder Market Outlook, By Pigments (2020-2028) ($MN)
56 North America Molybdenum Trioxide Nanopowder Market Outlook, By Other End Users (2020-2028) ($MN)
57 Europe Molybdenum Trioxide Nanopowder Market Outlook, By Country (2020-2028) ($MN)
58 Europe Molybdenum Trioxide Nanopowder Market Outlook, By Particle Size (2020-2028) ($MN)
59 Europe Molybdenum Trioxide Nanopowder Market Outlook, By <80 nm (2020-2028) ($MN)
60 Europe Molybdenum Trioxide Nanopowder Market Outlook, By 80-100 nm (2020-2028) ($MN)
61 Europe Molybdenum Trioxide Nanopowder Market Outlook, By Other Particle Size (2020-2028) ($MN)
62 Europe Molybdenum Trioxide Nanopowder Market Outlook, By Purity (2020-2028) ($MN)
63 Europe Molybdenum Trioxide Nanopowder Market Outlook, By >99.99% (2020-2028) ($MN)
64 Europe Molybdenum Trioxide Nanopowder Market Outlook, By ?99.94%-99.99% (2020-2028) ($MN)
65 Europe Molybdenum Trioxide Nanopowder Market Outlook, By ?99.5%-99.94% (2020-2028) ($MN)
66 Europe Molybdenum Trioxide Nanopowder Market Outlook, By Other Purities (2020-2028) ($MN)
67 Europe Molybdenum Trioxide Nanopowder Market Outlook, By Application (2020-2028) ($MN)
68 Europe Molybdenum Trioxide Nanopowder Market Outlook, By Electrochemical Capacitors (2020-2028) ($MN)
69 Europe Molybdenum Trioxide Nanopowder Market Outlook, By Catalysts (2020-2028) ($MN)
70 Europe Molybdenum Trioxide Nanopowder Market Outlook, By Nanofibers (2020-2028) ($MN)
71 Europe Molybdenum Trioxide Nanopowder Market Outlook, By Optoelectronic Components (2020-2028) ($MN)
72 Europe Molybdenum Trioxide Nanopowder Market Outlook, By Nanowires (2020-2028) ($MN)
73 Europe Molybdenum Trioxide Nanopowder Market Outlook, By Gas Sensors (2020-2028) ($MN)
74 Europe Molybdenum Trioxide Nanopowder Market Outlook, By Lithium-ion Batteries (2020-2028) ($MN)
75 Europe Molybdenum Trioxide Nanopowder Market Outlook, By Other Applications (2020-2028) ($MN)
76 Europe Molybdenum Trioxide Nanopowder Market Outlook, By End User (2020-2028) ($MN)
77 Europe Molybdenum Trioxide Nanopowder Market Outlook, By Automotive and Transportation (2020-2028) ($MN)
78 Europe Molybdenum Trioxide Nanopowder Market Outlook, By Ceramics (2020-2028) ($MN)
79 Europe Molybdenum Trioxide Nanopowder Market Outlook, By Electronics (2020-2028) ($MN)
80 Europe Molybdenum Trioxide Nanopowder Market Outlook, By Textiles (2020-2028) ($MN)
81 Europe Molybdenum Trioxide Nanopowder Market Outlook, By Glass (2020-2028) ($MN)
82 Europe Molybdenum Trioxide Nanopowder Market Outlook, By Chemicals (2020-2028) ($MN)
83 Europe Molybdenum Trioxide Nanopowder Market Outlook, By Pigments (2020-2028) ($MN)
84 Europe Molybdenum Trioxide Nanopowder Market Outlook, By Other End Users (2020-2028) ($MN)
85 Asia Pacific Molybdenum Trioxide Nanopowder Market Outlook, By Country (2020-2028) ($MN)
86 Asia Pacific Molybdenum Trioxide Nanopowder Market Outlook, By Particle Size (2020-2028) ($MN)
87 Asia Pacific Molybdenum Trioxide Nanopowder Market Outlook, By <80 nm (2020-2028) ($MN)
88 Asia Pacific Molybdenum Trioxide Nanopowder Market Outlook, By 80-100 nm (2020-2028) ($MN)
89 Asia Pacific Molybdenum Trioxide Nanopowder Market Outlook, By Other Particle Size (2020-2028) ($MN)
90 Asia Pacific Molybdenum Trioxide Nanopowder Market Outlook, By Purity (2020-2028) ($MN)
91 Asia Pacific Molybdenum Trioxide Nanopowder Market Outlook, By >99.99% (2020-2028) ($MN)
92 Asia Pacific Molybdenum Trioxide Nanopowder Market Outlook, By ?99.94%-99.99% (2020-2028) ($MN)
93 Asia Pacific Molybdenum Trioxide Nanopowder Market Outlook, By ?99.5%-99.94% (2020-2028) ($MN)
94 Asia Pacific Molybdenum Trioxide Nanopowder Market Outlook, By Other Purities (2020-2028) ($MN)
95 Asia Pacific Molybdenum Trioxide Nanopowder Market Outlook, By Application (2020-2028) ($MN)
96 Asia Pacific Molybdenum Trioxide Nanopowder Market Outlook, By Electrochemical Capacitors (2020-2028) ($MN)
97 Asia Pacific Molybdenum Trioxide Nanopowder Market Outlook, By Catalysts (2020-2028) ($MN)
98 Asia Pacific Molybdenum Trioxide Nanopowder Market Outlook, By Nanofibers (2020-2028) ($MN)
99 Asia Pacific Molybdenum Trioxide Nanopowder Market Outlook, By Optoelectronic Components (2020-2028) ($MN)
100 Asia Pacific Molybdenum Trioxide Nanopowder Market Outlook, By Nanowires (2020-2028) ($MN)
101 Asia Pacific Molybdenum Trioxide Nanopowder Market Outlook, By Gas Sensors (2020-2028) ($MN)
102 Asia Pacific Molybdenum Trioxide Nanopowder Market Outlook, By Lithium-ion Batteries (2020-2028) ($MN)
103 Asia Pacific Molybdenum Trioxide Nanopowder Market Outlook, By Other Applications (2020-2028) ($MN)
104 Asia Pacific Molybdenum Trioxide Nanopowder Market Outlook, By End User (2020-2028) ($MN)
105 Asia Pacific Molybdenum Trioxide Nanopowder Market Outlook, By Automotive and Transportation (2020-2028) ($MN)
106 Asia Pacific Molybdenum Trioxide Nanopowder Market Outlook, By Ceramics (2020-2028) ($MN)
107 Asia Pacific Molybdenum Trioxide Nanopowder Market Outlook, By Electronics (2020-2028) ($MN)
108 Asia Pacific Molybdenum Trioxide Nanopowder Market Outlook, By Textiles (2020-2028) ($MN)
109 Asia Pacific Molybdenum Trioxide Nanopowder Market Outlook, By Glass (2020-2028) ($MN)
110 Asia Pacific Molybdenum Trioxide Nanopowder Market Outlook, By Chemicals (2020-2028) ($MN)
111 Asia Pacific Molybdenum Trioxide Nanopowder Market Outlook, By Pigments (2020-2028) ($MN)
112 Asia Pacific Molybdenum Trioxide Nanopowder Market Outlook, By Other End Users (2020-2028) ($MN)
113 South America Molybdenum Trioxide Nanopowder Market Outlook, By Country (2020-2028) ($MN)
114 South America Molybdenum Trioxide Nanopowder Market Outlook, By Particle Size (2020-2028) ($MN)
115 South America Molybdenum Trioxide Nanopowder Market Outlook, By <80 nm (2020-2028) ($MN)
116 South America Molybdenum Trioxide Nanopowder Market Outlook, By 80-100 nm (2020-2028) ($MN)
117 South America Molybdenum Trioxide Nanopowder Market Outlook, By Other Particle Size (2020-2028) ($MN)
118 South America Molybdenum Trioxide Nanopowder Market Outlook, By Purity (2020-2028) ($MN)
119 South America Molybdenum Trioxide Nanopowder Market Outlook, By >99.99% (2020-2028) ($MN)
120 South America Molybdenum Trioxide Nanopowder Market Outlook, By ?99.94%-99.99% (2020-2028) ($MN)
121 South America Molybdenum Trioxide Nanopowder Market Outlook, By ?99.5%-99.94% (2020-2028) ($MN)
122 South America Molybdenum Trioxide Nanopowder Market Outlook, By Other Purities (2020-2028) ($MN)
123 South America Molybdenum Trioxide Nanopowder Market Outlook, By Application (2020-2028) ($MN)
124 South America Molybdenum Trioxide Nanopowder Market Outlook, By Electrochemical Capacitors (2020-2028) ($MN)
125 South America Molybdenum Trioxide Nanopowder Market Outlook, By Catalysts (2020-2028) ($MN)
126 South America Molybdenum Trioxide Nanopowder Market Outlook, By Nanofibers (2020-2028) ($MN)
127 South America Molybdenum Trioxide Nanopowder Market Outlook, By Optoelectronic Components (2020-2028) ($MN)
128 South America Molybdenum Trioxide Nanopowder Market Outlook, By Nanowires (2020-2028) ($MN)
129 South America Molybdenum Trioxide Nanopowder Market Outlook, By Gas Sensors (2020-2028) ($MN)
130 South America Molybdenum Trioxide Nanopowder Market Outlook, By Lithium-ion Batteries (2020-2028) ($MN)
131 South America Molybdenum Trioxide Nanopowder Market Outlook, By Other Applications (2020-2028) ($MN)
132 South America Molybdenum Trioxide Nanopowder Market Outlook, By End User (2020-2028) ($MN)
133 South America Molybdenum Trioxide Nanopowder Market Outlook, By Automotive and Transportation (2020-2028) ($MN)
134 South America Molybdenum Trioxide Nanopowder Market Outlook, By Ceramics (2020-2028) ($MN)
135 South America Molybdenum Trioxide Nanopowder Market Outlook, By Electronics (2020-2028) ($MN)
136 South America Molybdenum Trioxide Nanopowder Market Outlook, By Textiles (2020-2028) ($MN)
137 South America Molybdenum Trioxide Nanopowder Market Outlook, By Glass (2020-2028) ($MN)
138 South America Molybdenum Trioxide Nanopowder Market Outlook, By Chemicals (2020-2028) ($MN)
139 South America Molybdenum Trioxide Nanopowder Market Outlook, By Pigments (2020-2028) ($MN)
140 South America Molybdenum Trioxide Nanopowder Market Outlook, By Other End Users (2020-2028) ($MN)
141 Middle East & Africa Molybdenum Trioxide Nanopowder Market Outlook, By Country (2020-2028) ($MN)
142 Middle East & Africa Molybdenum Trioxide Nanopowder Market Outlook, By Particle Size (2020-2028) ($MN)
143 Middle East & Africa Molybdenum Trioxide Nanopowder Market Outlook, By <80 nm (2020-2028) ($MN)
144 Middle East & Africa Molybdenum Trioxide Nanopowder Market Outlook, By 80-100 nm (2020-2028) ($MN)
145 Middle East & Africa Molybdenum Trioxide Nanopowder Market Outlook, By Other Particle Size (2020-2028) ($MN)
146 Middle East & Africa Molybdenum Trioxide Nanopowder Market Outlook, By Purity (2020-2028) ($MN)
147 Middle East & Africa Molybdenum Trioxide Nanopowder Market Outlook, By >99.99% (2020-2028) ($MN)
148 Middle East & Africa Molybdenum Trioxide Nanopowder Market Outlook, By ?99.94%-99.99% (2020-2028) ($MN)
149 Middle East & Africa Molybdenum Trioxide Nanopowder Market Outlook, By ?99.5%-99.94% (2020-2028) ($MN)
150 Middle East & Africa Molybdenum Trioxide Nanopowder Market Outlook, By Other Purities (2020-2028) ($MN)
151 Middle East & Africa Molybdenum Trioxide Nanopowder Market Outlook, By Application (2020-2028) ($MN)
152 Middle East & Africa Molybdenum Trioxide Nanopowder Market Outlook, By Electrochemical Capacitors (2020-2028) ($MN)
153 Middle East & Africa Molybdenum Trioxide Nanopowder Market Outlook, By Catalysts (2020-2028) ($MN)
154 Middle East & Africa Molybdenum Trioxide Nanopowder Market Outlook, By Nanofibers (2020-2028) ($MN)
155 Middle East & Africa Molybdenum Trioxide Nanopowder Market Outlook, By Optoelectronic Components (2020-2028) ($MN)
156 Middle East & Africa Molybdenum Trioxide Nanopowder Market Outlook, By Nanowires (2020-2028) ($MN)
157 Middle East & Africa Molybdenum Trioxide Nanopowder Market Outlook, By Gas Sensors (2020-2028) ($MN)
158 Middle East & Africa Molybdenum Trioxide Nanopowder Market Outlook, By Lithium-ion Batteries (2020-2028) ($MN)
159 Middle East & Africa Molybdenum Trioxide Nanopowder Market Outlook, By Other Applications (2020-2028) ($MN)
160 Middle East & Africa Molybdenum Trioxide Nanopowder Market Outlook, By End User (2020-2028) ($MN)
161 Middle East & Africa Molybdenum Trioxide Nanopowder Market Outlook, By Automotive and Transportation (2020-2028) ($MN)
162 Middle East & Africa Molybdenum Trioxide Nanopowder Market Outlook, By Ceramics (2020-2028) ($MN)
163 Middle East & Africa Molybdenum Trioxide Nanopowder Market Outlook, By Electronics (2020-2028) ($MN)
164 Middle East & Africa Molybdenum Trioxide Nanopowder Market Outlook, By Textiles (2020-2028) ($MN)
165 Middle East & Africa Molybdenum Trioxide Nanopowder Market Outlook, By Glass (2020-2028) ($MN)
166 Middle East & Africa Molybdenum Trioxide Nanopowder Market Outlook, By Chemicals (2020-2028) ($MN)
167 Middle East & Africa Molybdenum Trioxide Nanopowder Market Outlook, By Pigments (2020-2028) ($MN)
168 Middle East & Africa Molybdenum Trioxide Nanopowder Market Outlook, By Other End Users (2020-2028) ($MN)
List of Figures
RESEARCH METHODOLOGY

We at ‘Stratistics’ opt for an extensive research approach which involves data mining, data validation, and data analysis. The various research sources include in-house repository, secondary research, competitor’s sources, social media research, client internal data, and primary research.
Our team of analysts prefers the most reliable and authenticated data sources in order to perform the comprehensive literature search. With access to most of the authenticated data bases our team highly considers the best mix of information through various sources to obtain extensive and accurate analysis.
Each report takes an average time of a month and a team of 4 industry analysts. The time may vary depending on the scope and data availability of the desired market report. The various parameters used in the market assessment are standardized in order to enhance the data accuracy.
Data Mining
The data is collected from several authenticated, reliable, paid and unpaid sources and is filtered depending on the scope & objective of the research. Our reports repository acts as an added advantage in this procedure. Data gathering from the raw material suppliers, distributors and the manufacturers is performed on a regular basis, this helps in the comprehensive understanding of the products value chain. Apart from the above mentioned sources the data is also collected from the industry consultants to ensure the objective of the study is in the right direction.
Market trends such as technological advancements, regulatory affairs, market dynamics (Drivers, Restraints, Opportunities and Challenges) are obtained from scientific journals, market related national & international associations and organizations.
Data Analysis
From the data that is collected depending on the scope & objective of the research the data is subjected for the analysis. The critical steps that we follow for the data analysis include:
- Product Lifecycle Analysis
- Competitor analysis
- Risk analysis
- Porters Analysis
- PESTEL Analysis
- SWOT Analysis
The data engineering is performed by the core industry experts considering both the Marketing Mix Modeling and the Demand Forecasting. The marketing mix modeling makes use of multiple-regression techniques to predict the optimal mix of marketing variables. Regression factor is based on a number of variables and how they relate to an outcome such as sales or profits.
Data Validation
The data validation is performed by the exhaustive primary research from the expert interviews. This includes telephonic interviews, focus groups, face to face interviews, and questionnaires to validate our research from all aspects. The industry experts we approach come from the leading firms, involved in the supply chain ranging from the suppliers, distributors to the manufacturers and consumers so as to ensure an unbiased analysis.
We are in touch with more than 15,000 industry experts with the right mix of consultants, CEO's, presidents, vice presidents, managers, experts from both supply side and demand side, executives and so on.
The data validation involves the primary research from the industry experts belonging to:
- Leading Companies
- Suppliers & Distributors
- Manufacturers
- Consumers
- Industry/Strategic Consultants
Apart from the data validation the primary research also helps in performing the fill gap research, i.e. providing solutions for the unmet needs of the research which helps in enhancing the reports quality.
For more details about research methodology, kindly write to us at info@strategymrc.com
Frequently Asked Questions
In case of any queries regarding this report, you can contact the customer service by filing the “Inquiry Before Buy” form available on the right hand side. You may also contact us through email: info@strategymrc.com or phone: +1-301-202-5929
Yes, the samples are available for all the published reports. You can request them by filling the “Request Sample” option available in this page.
Yes, you can request a sample with your specific requirements. All the customized samples will be provided as per the requirement with the real data masked.
All our reports are available in Digital PDF format. In case if you require them in any other formats, such as PPT, Excel etc you can submit a request through “Inquiry Before Buy” form available on the right hand side. You may also contact us through email: info@strategymrc.com or phone: +1-301-202-5929
We offer a free 15% customization with every purchase. This requirement can be fulfilled for both pre and post sale. You may send your customization requirements through email at info@strategymrc.com or call us on +1-301-202-5929.
We have 3 different licensing options available in electronic format.
- Single User Licence: Allows one person, typically the buyer, to have access to the ordered product. The ordered product cannot be distributed to anyone else.
- 2-5 User Licence: Allows the ordered product to be shared among a maximum of 5 people within your organisation.
- Corporate License: Allows the product to be shared among all employees of your organisation regardless of their geographical location.
All our reports are typically be emailed to you as an attachment.
To order any available report you need to register on our website. The payment can be made either through CCAvenue or PayPal payments gateways which accept all international cards.
We extend our support to 6 months post sale. A post sale customization is also provided to cover your unmet needs in the report.
Request Customization
We offer complimentary customization of up to 15% with every purchase. To share your customization requirements, feel free to email us at info@strategymrc.com or call us on +1-301-202-5929. .
Please Note: Customization within the 15% threshold is entirely free of charge. If your request exceeds this limit, we will conduct a feasibility assessment. Following that, a detailed quote and timeline will be provided.
WHY CHOOSE US ?

Assured Quality
Best in class reports with high standard of research integrity

24X7 Research Support
Continuous support to ensure the best customer experience.

Free Customization
Adding more values to your product of interest.

Safe & Secure Access
Providing a secured environment for all online transactions.

Trusted by 600+ Brands
Serving the most reputed brands across the world.