
Multimodal Mobility Hubs Market
Multi-Modal Mobility Hubs Market Forecasts to 2034 - Global Analysis By Hub Type (Urban Transit Hubs, Highway Mobility Hubs, Freight & Logistics Hubs, Airport Mobility Hubs and Other Hub Types), Energy Source, Application, End User and By Geography

|
Years Covered |
2023-2034 |
|
Estimated Year Value (2026) |
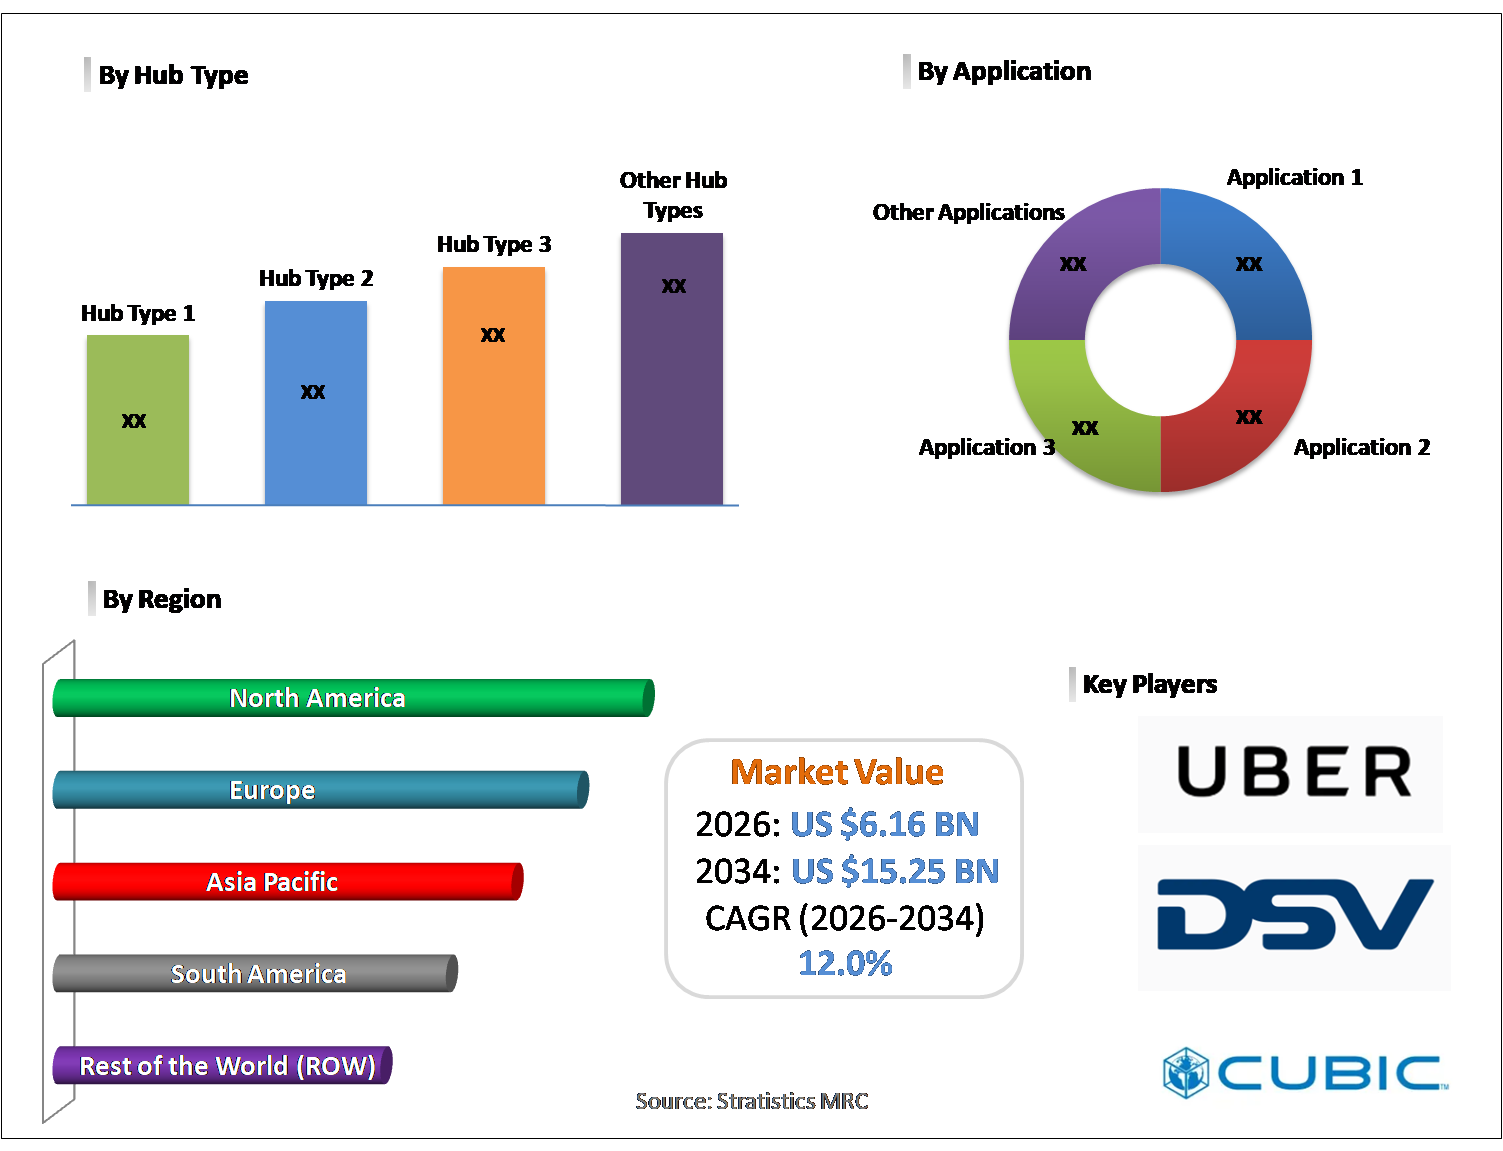
US $6.16 BN |
|
Projected Year Value (2034) |
US $15.25 BN |
|
CAGR (2026-2034) |
12.0% |
|
Regions Covered |
North America, Europe, Asia Pacific, South America, and Rest of the World (RoW) |
|
Countries Covered |
United States, Canada, Mexico, United Kingdom, Germany, France, Italy, Spain, Netherlands, Belgium, Sweden, Switzerland, Poland, Rest of Europe, China, Japan, India, South Korea, Australia, Indonesia, Thailand, Malaysia, Singapore, Vietnam, Rest of Asia Pacific, Brazil, Argentina, Colombia, Chile, Peru, Rest of South America, Saudi Arabia, United Arab Emirates, Qatar, Israel, Rest of Middle East, South Africa, Egypt, Morocco, and Rest of Africa. |
|
Largest Market |
North America |
|
Highest Growing Market |
Asia Pacific |
According to Stratistics MRC, the Global Multi‑Modal Mobility Hubs Market is accounted for $6.16 billion in 2026 and is expected to reach $15.25 billion by 2034 growing at a CAGR of 12.0% during the forecast period. Multi-modal mobility hubs serve as central points that connect multiple transport options, including public transit, cycling, and shared mobility services, in one convenient location. They streamline travel, minimize delays, and make commuting more efficient by providing seamless transfers and real-time updates. These hubs also foster environmentally sustainable transport by reducing reliance on private cars and promoting greener alternatives. Recognized as vital components of smart urban planning, they enhance overall connectivity, lower congestion, and support the development of integrated, efficient citywide transportation systems.
According to Boston Consulting Group (BCG, 2023), India’s urban population contributes 63% of GDP, and this share is expected to rise to 75% by 2030.
Market Dynamics:
Driver:
Increasing urbanization and population growth
Growing urban populations and the expansion of cities are increasing the need for integrated transportation solutions like multi-modal mobility hubs. These hubs help manage congestion, shorten travel durations, and connect multiple modes of transport such as buses, trains, metros, and shared mobility services in a single location. Urban planners are emphasizing these hubs to encourage sustainable commuting, reduce pollution, and improve public transport efficiency. In densely populated metropolitan areas, such interconnected systems are critical to maintaining smooth mobility, supporting economic activities, and enhancing overall quality of urban life.
Restraint:
High capital and operational costs
Building and operating multi-modal mobility hubs demand substantial investment and high recurring costs. Infrastructure for diverse transport modes, digital systems, and commuter amenities makes construction costly, while maintenance, personnel, and technology updates add to operational expenses. Budget limitations, particularly in emerging economies, can delay or restrict hub implementation. The substantial financial requirements may deter investors and local authorities from pursuing integrated transportation hubs. Therefore, the high capital and ongoing operational expenditures represent a major limitation, slowing the growth and adoption of multi-modal hubs in cities aiming to create seamless and efficient mobility solutions.
Opportunity:
Expansion of urban public transport networks
As cities grow, expanding public transportation networks create substantial opportunities for multi-modal mobility hubs. Integration of metro lines, buses, and suburban rail systems into centralized hubs facilitates smooth transfers, reduces congestion, and encourages public transport use. These strategically located hubs improve connectivity, shorten travel times, and enhance commuter experiences. Urban planners and private operators can leverage this trend to support sustainable mobility, optimize transport infrastructure, and develop efficient, integrated hubs. The continuous growth and investment in urban transit systems present a promising avenue for the widespread adoption and expansion of multi-modal mobility hubs.
Threat:
Intense competition from alternative transport solutions
Emerging transportation alternatives, including ride-hailing apps, micro-mobility services, and autonomous vehicles, pose a threat to multi-modal mobility hubs. These flexible, convenient, and often door-to-door services can reduce commuter reliance on centralized hubs. Rapid adoption of such technologies may divert users from traditional multi-modal networks. Private mobility providers offering personalized solutions can capture significant market share, challenging the growth of hub-based systems. To remain competitive, multi-modal hubs must continuously innovate, improve service quality, and offer unique value propositions, as intense competition from modern mobility options can limit their effectiveness and adoption in urban areas.
Covid-19 Impact:
The COVID‑19 crisis had a profound impact on multi-modal mobility hubs, as lockdowns and travel restrictions sharply reduced commuter traffic. Public transport usage declined, affecting revenue for hub operators, while social distancing and safety concerns required investments in sanitization, contactless systems, and digital solutions. Construction and expansion projects faced delays, slowing new hub development. Despite these challenges, the pandemic highlighted the importance of adaptable and resilient transport networks. Stakeholders were compelled to modify operations, adopt health-compliant measures, and rethink commuter engagement strategies. Overall, COVID‑19 temporarily restrained market growth but underscored the need for flexible urban mobility solutions.
The urban transit hubs segment is expected to be the largest during the forecast period
The urban transit hubs segment is expected to account for the largest market share during the forecast period because of their critical role in connecting various transport modes in crowded cities. They integrate buses, metros, suburban rail, and cycling facilities to provide smooth transfers and shorter travel durations. Factors such as rising urban populations, government support for public transport, and the push for sustainable commuting contribute to this segment’s leading position. By enhancing connectivity, minimizing congestion, and facilitating convenient travel, urban transit hubs serve as key nodes in efficient and eco-friendly urban mobility systems, making them the most significant segment in the market.
The transit agencies segment is expected to have the highest CAGR during the forecast period
Over the forecast period, the transit agencies segment is predicted to witness the highest growth rate because of their essential role in managing and coordinating integrated transportation networks. They facilitate seamless connections across buses, metro systems, trains, and additional mobility modes while adopting technologies such as digital ticketing, real-time updates, and predictive analytics. Focused investments in infrastructure, service improvements, and smart mobility initiatives by these agencies accelerate hub development. By enhancing commuter experience, lowering congestion, and supporting sustainable urban transport, transit agencies emerge as the segment with the highest growth rate, driving rapid expansion of multi-modal mobility hubs.
Region with largest share:
During the forecast period, the North America region is expected to hold the largest market share, driven by sophisticated urban infrastructure, widespread use of public transport, and supportive government policies promoting smart mobility. Established transit networks, such as buses, metro, and suburban rail, create opportunities for integrated hubs that improve commuter experience and alleviate congestion. Investments in digital systems, smart ticketing, and eco-friendly transport options reinforce the region’s leadership. Rising urban populations and efforts to reduce carbon footprints further boost hub adoption. Collectively, these factors position North America as the leading region in the market, commanding the largest share and setting benchmarks for multi-modal transportation development.
Region with highest CAGR:
Over the forecast period, the Asia Pacific region is anticipated to exhibit the highest CAGR due to rapid city expansion, increasing population density, and rising public transport demand. Major countries including China, India, and Japan are investing in integrated transit systems connecting metro, bus, and suburban rail networks. Emphasis on sustainable transport, congestion reduction, and smart city projects accelerates hub deployment. Adoption of technologies such as digital ticketing and real-time transit information enhances commuter experience. Strong infrastructural investments, government initiatives, and urban mobility requirements make Asia Pacific the fastest-growing region, driving rapid expansion of multi-modal mobility hubs.

Key players in the market
Some of the key players in Multi‑Modal Mobility Hubs Market include CEG World, SKIDATA, Tractebel (ENGIE), Mobility Hub Partners, KITCO Ltd, Deutsche Post AG (DHL), DSV, Kuehne+Nagel, A.P. Moller-Maersk, NIPPON EXPRESS HOLDINGS, Uber, Whim, Jelbi (BVG), Trafi, Moovit, Siemens Mobility, DB Schenker and Cubic Corporation.
Key Developments:
In February 2026, Uber Technologies, Inc. and Life360 announced they are expanding their strategic partnership to integrate their services more deeply for families coordinating transportation. Life360, which boasts impressive gross profit margins of 77.7% according to InvestingPro data, has seen its stock decline by 11.9% over the past week. The expanded collaboration will allow users to link their Life360 and Uber accounts, including Uber teen accounts, to facilitate ride coordination and real-time tracking.
In January 2026, Siemens Mobility and Newag have signed a Memorandum of Understanding (MoU) to strengthen their strategic collaboration in the development of modern railway technologies in Poland. The document underscores the two companies’ shared commitment to promoting innovation, safety, and quality in railway technologies in the Polish sector.
In September 2025, DSV and Atlas Air expand strategic partnership with new long-term dedicated freighter agreement. Under the agreement, Atlas Air will operate one of its newly delivered 777-200Fs exclusively on behalf of DSV, providing control over freight capacity, access to worldwide operating capabilities, and the benefit of Atlas Air’s extensive air traffic rights and operational flexibility.
Hub Types Covered:
• Urban Transit Hubs
• Highway Mobility Hubs
• Freight & Logistics Hubs
• Airport Mobility Hubs
• Other Hub Types
Energy Sources Covered:
• EV Charging Infrastructure
• Hydrogen Refueling Infrastructure
• Dual-Fuel Integrated Infrastructure
Applications Covered:
• Public Transportation Integration
• Fleet Operations
• Private Mobility
• Other Applications
End Users Covered:
• Municipal Authorities
• Transit Agencies
• Logistics Operators
• Other End Users
Regions Covered:
• North America
o United States
o Canada
o Mexico
• Europe
o United Kingdom
o Germany
o France
o Italy
o Spain
o Netherlands
o Belgium
o Sweden
o Switzerland
o Poland
o Rest of Europe
• Asia Pacific
o China
o Japan
o India
o South Korea
o Australia
o Indonesia
o Thailand
o Malaysia
o Singapore
o Vietnam
o Rest of Asia Pacific
• South America
o Brazil
o Argentina
o Colombia
o Chile
o Peru
o Rest of South America
• Rest of the World (RoW)
o Middle East
§ Saudi Arabia
§ United Arab Emirates
§ Qatar
§ Israel
§ Rest of Middle East
o Africa
§ South Africa
§ Egypt
§ Morocco
§ Rest of Africa
What our report offers:
- Market share assessments for the regional and country-level segments
- Strategic recommendations for the new entrants
- Covers Market data for the years 2023, 2024, 2025, 2026, 2027, 2028, 2030, 2032 and 2034
- Market Trends (Drivers, Constraints, Opportunities, Threats, Challenges, Investment Opportunities, and recommendations)
- Strategic recommendations in key business segments based on the market estimations
- Competitive landscaping mapping the key common trends
- Company profiling with detailed strategies, financials, and recent developments
- Supply chain trends mapping the latest technological advancements
Free Customization Offerings:
All the customers of this report will be entitled to receive one of the following free customization options:
• Company Profiling
o Comprehensive profiling of additional market players (up to 3)
o SWOT Analysis of key players (up to 3)
• Regional Segmentation
o Market estimations, Forecasts and CAGR of any prominent country as per the client's interest (Note: Depends on feasibility check)
• Competitive Benchmarking
o Benchmarking of key players based on product portfolio, geographical presence, and strategic alliances
Table of Contents
1 Executive Summary
1.1 Market Snapshot and Key Highlights
1.2 Growth Drivers, Challenges, and Opportunities
1.3 Competitive Landscape Overview
1.4 Strategic Insights and Recommendations
2 Research Framework
2.1 Study Objectives and Scope
2.2 Stakeholder Analysis
2.3 Research Assumptions and Limitations
2.4 Research Methodology
2.4.1 Data Collection (Primary and Secondary)
2.4.2 Data Modeling and Estimation Techniques
2.4.3 Data Validation and Triangulation
2.4.4 Analytical and Forecasting Approach
3 Market Dynamics and Trend Analysis
3.1 Market Definition and Structure
3.2 Key Market Drivers
3.3 Market Restraints and Challenges
3.4 Growth Opportunities and Investment Hotspots
3.5 Industry Threats and Risk Assessment
3.6 Technology and Innovation Landscape
3.7 Emerging and High-Growth Markets
3.8 Regulatory and Policy Environment
3.9 Impact of COVID-19 and Recovery Outlook
4 Competitive and Strategic Assessment
4.1 Porter's Five Forces Analysis
4.1.1 Supplier Bargaining Power
4.1.2 Buyer Bargaining Power
4.1.3 Threat of Substitutes
4.1.4 Threat of New Entrants
4.1.5 Competitive Rivalry
4.2 Market Share Analysis of Key Players
4.3 Product Benchmarking and Performance Comparison
5 Global Multi‑Modal Mobility Hubs Market, By Hub Type
5.1 Urban Transit Hubs
5.2 Highway Mobility Hubs
5.3 Freight & Logistics Hubs
5.4 Airport Mobility Hubs
5.5 Other Hub Types
6 Global Multi‑Modal Mobility Hubs Market, By Energy Source
6.1 EV Charging Infrastructure
6.2 Hydrogen Refueling Infrastructure
6.3 Dual-Fuel Integrated Infrastructure
7 Global Multi‑Modal Mobility Hubs Market, By Application
7.1 Public Transportation Integration
7.2 Fleet Operations
7.3 Private Mobility
7.4 Other Applications
8 Global Multi‑Modal Mobility Hubs Market, By End User
8.1 Municipal Authorities
8.2 Transit Agencies
8.3 Logistics Operators
8.4 Other End Users
9 Global Multi‑Modal Mobility Hubs Market, By Geography
9.1 North America
9.1.1 United States
9.1.2 Canada
9.1.3 Mexico
9.2 Europe
9.2.1 United Kingdom
9.2.2 Germany
9.2.3 France
9.2.4 Italy
9.2.5 Spain
9.2.6 Netherlands
9.2.7 Belgium
9.2.8 Sweden
9.2.9 Switzerland
9.2.10 Poland
9.2.11 Rest of Europe
9.3 Asia Pacific
9.3.1 China
9.3.2 Japan
9.3.3 India
9.3.4 South Korea
9.3.5 Australia
9.3.6 Indonesia
9.3.7 Thailand
9.3.8 Malaysia
9.3.9 Singapore
9.3.10 Vietnam
9.3.11 Rest of Asia Pacific
9.4 South America
9.4.1 Brazil
9.4.2 Argentina
9.4.3 Colombia
9.4.4 Chile
9.4.5 Peru
9.4.6 Rest of South America
9.5 Rest of the World (RoW)
9.5.1 Middle East
9.5.1.1 Saudi Arabia
9.5.1.2 United Arab Emirates
9.5.1.3 Qatar
9.5.1.4 Israel
9.5.1.5 Rest of Middle East
9.5.2 Africa
9.5.2.1 South Africa
9.5.2.2 Egypt
9.5.2.3 Morocco
9.5.2.4 Rest of Africa
10 Strategic Market Intelligence
10.1 Industry Value Network and Supply Chain Assessment
10.2 White-Space and Opportunity Mapping
10.3 Product Evolution and Market Life Cycle Analysis
10.4 Channel, Distributor, and Go-to-Market Assessment
11 Industry Developments and Strategic Initiatives
11.1 Mergers and Acquisitions
11.2 Partnerships, Alliances, and Joint Ventures
11.3 New Product Launches and Certifications
11.4 Capacity Expansion and Investments
11.5 Other Strategic Initiatives
12 Company Profiles
12.1 CEG World
12.2 SKIDATA
12.3 Tractebel (ENGIE)
12.4 Mobility Hub Partners
12.5 KITCO Ltd
12.6 Deutsche Post AG (DHL)
12.7 DSV
12.8 Kuehne+Nagel
12.9 A.P. Moller-Maersk
12.10 NIPPON EXPRESS HOLDINGS
12.11 Uber
12.12 Whim
12.13 Jelbi (BVG)
12.14 Trafi
12.15 Moovit
12.16 Siemens Mobility
12.17 DB Schenker
12.18 Cubic Corporation
List of Tables
1 Global Multi‑Modal Mobility Hubs Market Outlook, By Region (2023-2034) ($MN)
2 Global Multi‑Modal Mobility Hubs Market Outlook, By Hub Type (2023-2034) ($MN)
3 Global Multi‑Modal Mobility Hubs Market Outlook, By Urban Transit Hubs (2023-2034) ($MN)
4 Global Multi‑Modal Mobility Hubs Market Outlook, By Highway Mobility Hubs (2023-2034) ($MN)
5 Global Multi‑Modal Mobility Hubs Market Outlook, By Freight & Logistics Hubs (2023-2034) ($MN)
6 Global Multi‑Modal Mobility Hubs Market Outlook, By Airport Mobility Hubs (2023-2034) ($MN)
7 Global Multi‑Modal Mobility Hubs Market Outlook, By Other Hub Types (2023-2034) ($MN)
8 Global Multi‑Modal Mobility Hubs Market Outlook, By Energy Source (2023-2034) ($MN)
9 Global Multi‑Modal Mobility Hubs Market Outlook, By EV Charging Infrastructure (2023-2034) ($MN)
10 Global Multi‑Modal Mobility Hubs Market Outlook, By Hydrogen Refueling Infrastructure (2023-2034) ($MN)
11 Global Multi‑Modal Mobility Hubs Market Outlook, By Dual-Fuel Integrated Infrastructure (2023-2034) ($MN)
12 Global Multi‑Modal Mobility Hubs Market Outlook, By Application (2023-2034) ($MN)
13 Global Multi‑Modal Mobility Hubs Market Outlook, By Public Transportation Integration (2023-2034) ($MN)
14 Global Multi‑Modal Mobility Hubs Market Outlook, By Fleet Operations (2023-2034) ($MN)
15 Global Multi‑Modal Mobility Hubs Market Outlook, By Private Mobility (2023-2034) ($MN)
16 Global Multi‑Modal Mobility Hubs Market Outlook, By Other Applications (2023-2034) ($MN)
17 Global Multi‑Modal Mobility Hubs Market Outlook, By End User (2023-2034) ($MN)
18 Global Multi‑Modal Mobility Hubs Market Outlook, By Municipal Authorities (2023-2034) ($MN)
19 Global Multi‑Modal Mobility Hubs Market Outlook, By Transit Agencies (2023-2034) ($MN)
20 Global Multi‑Modal Mobility Hubs Market Outlook, By Logistics Operators (2023-2034) ($MN)
21 Global Multi‑Modal Mobility Hubs Market Outlook, By Other End Users (2023-2034) ($MN)
Note: Tables for North America, Europe, APAC, South America, and Rest of the World (RoW) Regions are also represented in the same manner as above.
List of Figures
RESEARCH METHODOLOGY

We at ‘Stratistics’ opt for an extensive research approach which involves data mining, data validation, and data analysis. The various research sources include in-house repository, secondary research, competitor’s sources, social media research, client internal data, and primary research.
Our team of analysts prefers the most reliable and authenticated data sources in order to perform the comprehensive literature search. With access to most of the authenticated data bases our team highly considers the best mix of information through various sources to obtain extensive and accurate analysis.
Each report takes an average time of a month and a team of 4 industry analysts. The time may vary depending on the scope and data availability of the desired market report. The various parameters used in the market assessment are standardized in order to enhance the data accuracy.
Data Mining
The data is collected from several authenticated, reliable, paid and unpaid sources and is filtered depending on the scope & objective of the research. Our reports repository acts as an added advantage in this procedure. Data gathering from the raw material suppliers, distributors and the manufacturers is performed on a regular basis, this helps in the comprehensive understanding of the products value chain. Apart from the above mentioned sources the data is also collected from the industry consultants to ensure the objective of the study is in the right direction.
Market trends such as technological advancements, regulatory affairs, market dynamics (Drivers, Restraints, Opportunities and Challenges) are obtained from scientific journals, market related national & international associations and organizations.
Data Analysis
From the data that is collected depending on the scope & objective of the research the data is subjected for the analysis. The critical steps that we follow for the data analysis include:
- Product Lifecycle Analysis
- Competitor analysis
- Risk analysis
- Porters Analysis
- PESTEL Analysis
- SWOT Analysis
The data engineering is performed by the core industry experts considering both the Marketing Mix Modeling and the Demand Forecasting. The marketing mix modeling makes use of multiple-regression techniques to predict the optimal mix of marketing variables. Regression factor is based on a number of variables and how they relate to an outcome such as sales or profits.
Data Validation
The data validation is performed by the exhaustive primary research from the expert interviews. This includes telephonic interviews, focus groups, face to face interviews, and questionnaires to validate our research from all aspects. The industry experts we approach come from the leading firms, involved in the supply chain ranging from the suppliers, distributors to the manufacturers and consumers so as to ensure an unbiased analysis.
We are in touch with more than 15,000 industry experts with the right mix of consultants, CEO's, presidents, vice presidents, managers, experts from both supply side and demand side, executives and so on.
The data validation involves the primary research from the industry experts belonging to:
- Leading Companies
- Suppliers & Distributors
- Manufacturers
- Consumers
- Industry/Strategic Consultants
Apart from the data validation the primary research also helps in performing the fill gap research, i.e. providing solutions for the unmet needs of the research which helps in enhancing the reports quality.
For more details about research methodology, kindly write to us at info@strategymrc.com
Frequently Asked Questions
In case of any queries regarding this report, you can contact the customer service by filing the “Inquiry Before Buy” form available on the right hand side. You may also contact us through email: info@strategymrc.com or phone: +1-301-202-5929
Yes, the samples are available for all the published reports. You can request them by filling the “Request Sample” option available in this page.
Yes, you can request a sample with your specific requirements. All the customized samples will be provided as per the requirement with the real data masked.
All our reports are available in Digital PDF format. In case if you require them in any other formats, such as PPT, Excel etc you can submit a request through “Inquiry Before Buy” form available on the right hand side. You may also contact us through email: info@strategymrc.com or phone: +1-301-202-5929
We offer a free 15% customization with every purchase. This requirement can be fulfilled for both pre and post sale. You may send your customization requirements through email at info@strategymrc.com or call us on +1-301-202-5929.
We have 3 different licensing options available in electronic format.
- Single User Licence: Allows one person, typically the buyer, to have access to the ordered product. The ordered product cannot be distributed to anyone else.
- 2-5 User Licence: Allows the ordered product to be shared among a maximum of 5 people within your organisation.
- Corporate License: Allows the product to be shared among all employees of your organisation regardless of their geographical location.
All our reports are typically be emailed to you as an attachment.
To order any available report you need to register on our website. The payment can be made either through CCAvenue or PayPal payments gateways which accept all international cards.
We extend our support to 6 months post sale. A post sale customization is also provided to cover your unmet needs in the report.
Request Customization
We offer complimentary customization of up to 15% with every purchase. To share your customization requirements, feel free to email us at info@strategymrc.com or call us on +1-301-202-5929. .
Please Note: Customization within the 15% threshold is entirely free of charge. If your request exceeds this limit, we will conduct a feasibility assessment. Following that, a detailed quote and timeline will be provided.
WHY CHOOSE US ?

Assured Quality
Best in class reports with high standard of research integrity

24X7 Research Support
Continuous support to ensure the best customer experience.

Free Customization
Adding more values to your product of interest.

Safe & Secure Access
Providing a secured environment for all online transactions.

Trusted by 600+ Brands
Serving the most reputed brands across the world.