
Network Attached Storage Market
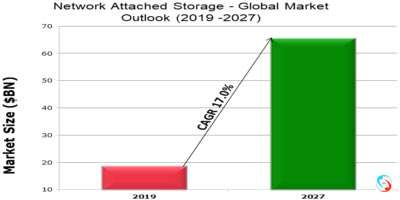
Network Attached Storage - Global Market Outlook (2019 -2027)
According to Stratistics MRC, the Global Network Attached Storage Market is accounted for $18.71 billion in 2019 and is expected to reach $65.71 billion by 2027 growing at a CAGR of 17.0% during the forecast period. Rapid adoption of 4G and 5G technologies creating high-volume digital content and government focus on digitization leading to massive growth in digital data are the major factors propelling the market growth. However, prime concern of data security when data is stored at remote location is hampering the market growth.
Network Attached Storage (NAS) is a device that is used for storage and retrieval of data from a centralized disk capacity. This device is connected to LAN and can be used by heterogeneous users at a time to store and access their data in a safer and reliable way. These devices are controlled by the browser-based utility and hence doesn’t really have a keyboard or display in its architecture. NAS devices are quite flexible and can be scaled out if additional storage is required. They are faster, user-friendly, having the high capacity at a fairly low cost. Small and medium enterprises are potentially adoption this technology, especially in the emerging economies.
Based on the design, the more than 20-bays segment is going to have a lucrative growth during the forecast period due to the features such as high storage capacity, high performance, fast response, and data recovery. Hence, these solutions are deployed in big industries, such as BFSI, manufacturing, large enterprises, and telecommunications and ITES where the data volumes are high and increasing on a regular basis.
By geography, Asia pacific is going to have a lucrative growth during the forecast period due to the presence of numerous small and mid-scale companies in the region. Also, the increasing investments by these companies in the development of IT infrastructure are driving the growth of the NAS market in these countries.
Some of the key players profiled in the Network Attached Storage Market include Buffalo Americas, Inc, Cisco Systems, Inc, Dell Technologies Inc, D-Link Corporation, Drobo, Inc, Hitachi, Ltd, Huawei Technologies Co., Ltd, IBM, Infortrend Technology Inc, Microsoft, NetApp, Inc, Panasas, SoftNAS, Inc, Synology, Inc, and Thecus Technology Corp.
Products Covered:
• High-End/Enterprise NAS
• Low-End/Desktop NAS
• Midmarket NAS
Designs Covered:
• 12 Bays to 20 Bays
• 1 Bay to 8 Bays
• 8 Bays to 12 Bays
• More than 20-Bays
Organization Sizes Covered:
• Large Enterprises
• Small and Medium-Sized Enterprises (SME)
Distribution Channels Covered:
• Offline
• Online
Storage Models Covered:
• Disk-less Models
• Disk Models
Storage Solutions Covered:
• Scale-out NAS
• Scale-up NAS
Deployment Types Covered:
• Hybrid
• On-Premises
• Remote
Solutions Covered:
• Hardware
• Software
End Users Covered:
• Commercial
• Home/Consumer NAS
Regions Covered:
• North America
o US
o Canada
o Mexico
• Europe
o Germany
o UK
o Italy
o France
o Spain
o Rest of Europe
• Asia Pacific
o Japan
o China
o India
o Australia
o New Zealand
o South Korea
o Rest of Asia Pacific
• South America
o Argentina
o Brazil
o Chile
o Rest of South America
• Middle East & Africa
o Saudi Arabia
o UAE
o Qatar
o South Africa
o Rest of Middle East & Africa
What our report offers:
- Market share assessments for the regional and country-level segments
- Strategic recommendations for the new entrants
- Covers Market data for the years 2018, 2019 2020, 2024, and 2027
- Market Trends (Drivers, Constraints, Opportunities, Threats, Challenges, Investment Opportunities, and recommendations)
- Strategic recommendations in key business segments based on the market estimations
- Competitive landscaping mapping the key common trends
- Company profiling with detailed strategies, financials, and recent developments
- Supply chain trends mapping the latest technological advancements
Free Customization Offerings:
All the customers of this report will be entitled to receive one of the following free customization options:
• Company Profiling
o Comprehensive profiling of additional market players (up to 3)
o SWOT Analysis of key players (up to 3)
• Regional Segmentation
o Market estimations, Forecasts and CAGR of any prominent country as per the client's interest (Note: Depends on feasibility check)
• Competitive Benchmarking
o Benchmarking of key players based on product portfolio, geographical presence, and strategic alliances
Table of Contents
1 Executive Summary
2 Preface
2.1 Abstract
2.2 Stake Holders
2.3 Research Scope
2.4 Research Methodology
2.4.1 Data Mining
2.4.2 Data Analysis
2.4.3 Data Validation
2.4.4 Research Approach
2.5 Research Sources
2.5.1 Primary Research Sources
2.5.2 Secondary Research Sources
2.5.3 Assumptions
3 Market Trend Analysis
3.1 Introduction
3.2 Drivers
3.3 Restraints
3.4 Opportunities
3.5 Threats
3.6 Product Analysis
3.7 End User Analysis
3.8 Emerging Markets
3.9 Impact of Covid-19
4 Porters Five Force Analysis
4.1 Bargaining power of suppliers
4.2 Bargaining power of buyers
4.3 Threat of substitutes
4.4 Threat of new entrants
4.5 Competitive rivalry
5 Global Network Attached Storage Market, By Product
5.1 Introduction
5.2 High-End/Enterprise NAS
5.3 Low-End/Desktop NAS
5.4 Midmarket NAS
6 Global Network Attached Storage Market, By Design
6.1 Introduction
6.2 12 Bays to 20 Bays
6.3 1 Bay to 8 Bays
6.4 8 Bays to 12 Bays
6.5 More than 20-Bays
7 Global Network Attached Storage Market, By Organization Size
7.1 Introduction
7.2 Large Enterprises
7.3 Small and Medium-Sized Enterprises (SME)
8 Global Network Attached Storage Market, By Distribution Channel
8.1 Introduction
8.2 Offline
8.3 Online
9 Global Network Attached Storage Market, By Storage Model
9.1 Introduction
9.2 Disk-less Models
9.3 Disk Models
10 Global Network Attached Storage Market, By Storage Solution
10.1 Introduction
10.2 Scale-out NAS
10.3 Scale-up NAS
11 Global Network Attached Storage Market, By Deployment Type
11.1 Introduction
11.2 Hybrid
11.3 On-Premises
11.4 Remote
12 Global Network Attached Storage Market, By Solution
12.1 Introduction
12.2 Hardware
12.3 Software
13 Global Network Attached Storage Market, By End User
13.1 Introduction
13.2 Commercial
13.2.1 Banking, Financial Services, and Insurance (BFSI)
13.2.2 Government
13.2.3 Media and Entertainment
13.2.4 Food Processing
13.2.5 Healthcare
13.2.6 Logistics
13.2.7 Manufacturing
13.2.8 Telecommunications and ITES
13.2.9 Business and Consulting
13.2.10 Education and Research
13.2.11 Energy and Utilities
13.2.12 Aerospace & Defense
13.2.13 Automotive
13.3 Home/Consumer NAS
14 Global Network Attached Storage Market, By Geography
14.1 Introduction
14.2 North America
14.2.1 US
14.2.2 Canada
14.2.3 Mexico
14.3 Europe
14.3.1 Germany
14.3.2 UK
14.3.3 Italy
14.3.4 France
14.3.5 Spain
14.3.6 Rest of Europe
14.4 Asia Pacific
14.4.1 Japan
14.4.2 China
14.4.3 India
14.4.4 Australia
14.4.5 New Zealand
14.4.6 South Korea
14.4.7 Rest of Asia Pacific
14.5 South America
14.5.1 Argentina
14.5.2 Brazil
14.5.3 Chile
14.5.4 Rest of South America
14.6 Middle East & Africa
14.6.1 Saudi Arabia
14.6.2 UAE
14.6.3 Qatar
14.6.4 South Africa
14.6.5 Rest of Middle East & Africa
15 Key Developments
15.1 Agreements, Partnerships, Collaborations and Joint Ventures
15.2 Acquisitions & Mergers
15.3 New Product Launch
15.4 Expansions
15.5 Other Key Strategies
16 Company Profiling
16.1 Buffalo Americas, Inc
16.2 Cisco Systems, Inc
16.3 Dell Technologies Inc
16.4 D-Link Corporation
16.5 Drobo, Inc
16.6 Hitachi, Ltd
16.7 Huawei Technologies Co., Ltd
16.8 IBM
16.9 Infortrend Technology Inc
16.10 Microsoft
16.11 NetApp, Inc
16.12 Panasas
16.13 SoftNAS, Inc
16.14 Synology, Inc
16.15 Thecus Technology Corp
List of Tables
1 Global Network Attached Storage Market Outlook, By Region (2018-2027) ($MN)
2 Global Network Attached Storage Market Outlook, By Product (2018-2027) ($MN)
3 Global Network Attached Storage Market Outlook, By High-End/Enterprise NAS (2018-2027) ($MN)
4 Global Network Attached Storage Market Outlook, By Low-End/Desktop NAS (2018-2027) ($MN)
5 Global Network Attached Storage Market Outlook, By Midmarket NAS (2018-2027) ($MN)
6 Global Network Attached Storage Market Outlook, By Design (2018-2027) ($MN)
7 Global Network Attached Storage Market Outlook, By 12 Bays to 20 Bays (2018-2027) ($MN)
8 Global Network Attached Storage Market Outlook, By 1 Bay to 8 Bays (2018-2027) ($MN)
9 Global Network Attached Storage Market Outlook, By 8 Bays to 12 Bays (2018-2027) ($MN)
10 Global Network Attached Storage Market Outlook, By More than 20-Bays (2018-2027) ($MN)
11 Global Network Attached Storage Market Outlook, By Organization Size (2018-2027) ($MN)
12 Global Network Attached Storage Market Outlook, By Large Enterprises (2018-2027) ($MN)
13 Global Network Attached Storage Market Outlook, By Small and Medium-Sized Enterprises (SME) (2018-2027) ($MN)
14 Global Network Attached Storage Market Outlook, By Distribution Channel (2018-2027) ($MN)
15 Global Network Attached Storage Market Outlook, By Offline (2018-2027) ($MN)
16 Global Network Attached Storage Market Outlook, By Online (2018-2027) ($MN)
17 Global Network Attached Storage Market Outlook, By Storage Model (2018-2027) ($MN)
18 Global Network Attached Storage Market Outlook, By Disk-less Models (2018-2027) ($MN)
19 Global Network Attached Storage Market Outlook, By Disk Models (2018-2027) ($MN)
20 Global Network Attached Storage Market Outlook, By Storage Solution (2018-2027) ($MN)
21 Global Network Attached Storage Market Outlook, By Scale-out NAS (2018-2027) ($MN)
22 Global Network Attached Storage Market Outlook, By Scale-up NAS (2018-2027) ($MN)
23 Global Network Attached Storage Market Outlook, By Deployment Type (2018-2027) ($MN)
24 Global Network Attached Storage Market Outlook, By Hybrid (2018-2027) ($MN)
25 Global Network Attached Storage Market Outlook, By On-Premises (2018-2027) ($MN)
26 Global Network Attached Storage Market Outlook, By Remote (2018-2027) ($MN)
27 Global Network Attached Storage Market Outlook, By Solution (2018-2027) ($MN)
28 Global Network Attached Storage Market Outlook, By Hardware (2018-2027) ($MN)
29 Global Network Attached Storage Market Outlook, By Software (2018-2027) ($MN)
30 Global Network Attached Storage Market Outlook, By End User (2018-2027) ($MN)
31 Global Network Attached Storage Market Outlook, By Commercial (2018-2027) ($MN)
32 Global Network Attached Storage Market Outlook, By Banking, Financial Services, and Insurance (BFSI) (2018-2027) ($MN)
33 Global Network Attached Storage Market Outlook, By Government (2018-2027) ($MN)
34 Global Network Attached Storage Market Outlook, By Media and Entertainment (2018-2027) ($MN)
35 Global Network Attached Storage Market Outlook, By Food Processing (2018-2027) ($MN)
36 Global Network Attached Storage Market Outlook, By Healthcare (2018-2027) ($MN)
37 Global Network Attached Storage Market Outlook, By Logistics (2018-2027) ($MN)
38 Global Network Attached Storage Market Outlook, By Manufacturing (2018-2027) ($MN)
39 Global Network Attached Storage Market Outlook, By Telecommunications and ITES (2018-2027) ($MN)
40 Global Network Attached Storage Market Outlook, By Business and Consulting (2018-2027) ($MN)
41 Global Network Attached Storage Market Outlook, By Education and Research (2018-2027) ($MN)
42 Global Network Attached Storage Market Outlook, By Energy and Utilities (2018-2027) ($MN)
43 Global Network Attached Storage Market Outlook, By Aerospace & Defense (2018-2027) ($MN)
44 Global Network Attached Storage Market Outlook, By Automotive (2018-2027) ($MN)
45 Global Network Attached Storage Market Outlook, By Home/Consumer NAS (2018-2027) ($MN)
Note: Tables for North America, Europe, APAC, South America, and Middle East & Africa Regions are also represented in the same manner as above.
List of Figures
RESEARCH METHODOLOGY

We at ‘Stratistics’ opt for an extensive research approach which involves data mining, data validation, and data analysis. The various research sources include in-house repository, secondary research, competitor’s sources, social media research, client internal data, and primary research.
Our team of analysts prefers the most reliable and authenticated data sources in order to perform the comprehensive literature search. With access to most of the authenticated data bases our team highly considers the best mix of information through various sources to obtain extensive and accurate analysis.
Each report takes an average time of a month and a team of 4 industry analysts. The time may vary depending on the scope and data availability of the desired market report. The various parameters used in the market assessment are standardized in order to enhance the data accuracy.
Data Mining
The data is collected from several authenticated, reliable, paid and unpaid sources and is filtered depending on the scope & objective of the research. Our reports repository acts as an added advantage in this procedure. Data gathering from the raw material suppliers, distributors and the manufacturers is performed on a regular basis, this helps in the comprehensive understanding of the products value chain. Apart from the above mentioned sources the data is also collected from the industry consultants to ensure the objective of the study is in the right direction.
Market trends such as technological advancements, regulatory affairs, market dynamics (Drivers, Restraints, Opportunities and Challenges) are obtained from scientific journals, market related national & international associations and organizations.
Data Analysis
From the data that is collected depending on the scope & objective of the research the data is subjected for the analysis. The critical steps that we follow for the data analysis include:
- Product Lifecycle Analysis
- Competitor analysis
- Risk analysis
- Porters Analysis
- PESTEL Analysis
- SWOT Analysis
The data engineering is performed by the core industry experts considering both the Marketing Mix Modeling and the Demand Forecasting. The marketing mix modeling makes use of multiple-regression techniques to predict the optimal mix of marketing variables. Regression factor is based on a number of variables and how they relate to an outcome such as sales or profits.
Data Validation
The data validation is performed by the exhaustive primary research from the expert interviews. This includes telephonic interviews, focus groups, face to face interviews, and questionnaires to validate our research from all aspects. The industry experts we approach come from the leading firms, involved in the supply chain ranging from the suppliers, distributors to the manufacturers and consumers so as to ensure an unbiased analysis.
We are in touch with more than 15,000 industry experts with the right mix of consultants, CEO's, presidents, vice presidents, managers, experts from both supply side and demand side, executives and so on.
The data validation involves the primary research from the industry experts belonging to:
- Leading Companies
- Suppliers & Distributors
- Manufacturers
- Consumers
- Industry/Strategic Consultants
Apart from the data validation the primary research also helps in performing the fill gap research, i.e. providing solutions for the unmet needs of the research which helps in enhancing the reports quality.
For more details about research methodology, kindly write to us at info@strategymrc.com
Frequently Asked Questions
In case of any queries regarding this report, you can contact the customer service by filing the “Inquiry Before Buy” form available on the right hand side. You may also contact us through email: info@strategymrc.com or phone: +1-301-202-5929
Yes, the samples are available for all the published reports. You can request them by filling the “Request Sample” option available in this page.
Yes, you can request a sample with your specific requirements. All the customized samples will be provided as per the requirement with the real data masked.
All our reports are available in Digital PDF format. In case if you require them in any other formats, such as PPT, Excel etc you can submit a request through “Inquiry Before Buy” form available on the right hand side. You may also contact us through email: info@strategymrc.com or phone: +1-301-202-5929
We offer a free 15% customization with every purchase. This requirement can be fulfilled for both pre and post sale. You may send your customization requirements through email at info@strategymrc.com or call us on +1-301-202-5929.
We have 3 different licensing options available in electronic format.
- Single User Licence: Allows one person, typically the buyer, to have access to the ordered product. The ordered product cannot be distributed to anyone else.
- 2-5 User Licence: Allows the ordered product to be shared among a maximum of 5 people within your organisation.
- Corporate License: Allows the product to be shared among all employees of your organisation regardless of their geographical location.
All our reports are typically be emailed to you as an attachment.
To order any available report you need to register on our website. The payment can be made either through CCAvenue or PayPal payments gateways which accept all international cards.
We extend our support to 6 months post sale. A post sale customization is also provided to cover your unmet needs in the report.
Request Customization
We offer complimentary customization of up to 15% with every purchase. To share your customization requirements, feel free to email us at info@strategymrc.com or call us on +1-301-202-5929. .
Please Note: Customization within the 15% threshold is entirely free of charge. If your request exceeds this limit, we will conduct a feasibility assessment. Following that, a detailed quote and timeline will be provided.
WHY CHOOSE US ?

Assured Quality
Best in class reports with high standard of research integrity

24X7 Research Support
Continuous support to ensure the best customer experience.

Free Customization
Adding more values to your product of interest.

Safe & Secure Access
Providing a secured environment for all online transactions.

Trusted by 600+ Brands
Serving the most reputed brands across the world.