
Nextgeneration Ev Charging Networks Market
Next-Generation EV Charging Networks Market Forecasts to 2034 - Global Analysis By Charger Type (AC Charging, DC Fast Charging and Wireless Charging), Power Output, Connector Type, Ownership Model, Installation Type, Connectivity, Application, End User and By Geography

|
Years Covered |
2023-2034 |
|
Estimated Year Value (2026) |
US $11.88 BN |
|
Projected Year Value (2034) |
US $47.14 BN |
|
CAGR (2026-2034) |
18.8% |
|
Regions Covered |
North America, Europe, Asia Pacific, South America, and Rest of the World (RoW) |
|
Countries Covered |
United States, Canada, Mexico, United Kingdom, Germany, France, Italy, Spain, Netherlands, Belgium, Sweden, Switzerland, Poland, Rest of Europe, China, Japan, India, South Korea, Australia, Indonesia, Thailand, Malaysia, Singapore, Vietnam, Rest of Asia Pacific, Brazil, Argentina, Colombia, Chile, Peru, Rest of South America, Saudi Arabia, United Arab Emirates, Qatar, Israel, Rest of Middle East, South Africa, Egypt, Morocco, and Rest of Africa. |
|
Largest Market |
Asia Pacific |
|
Highest Growing Market |
Europe |
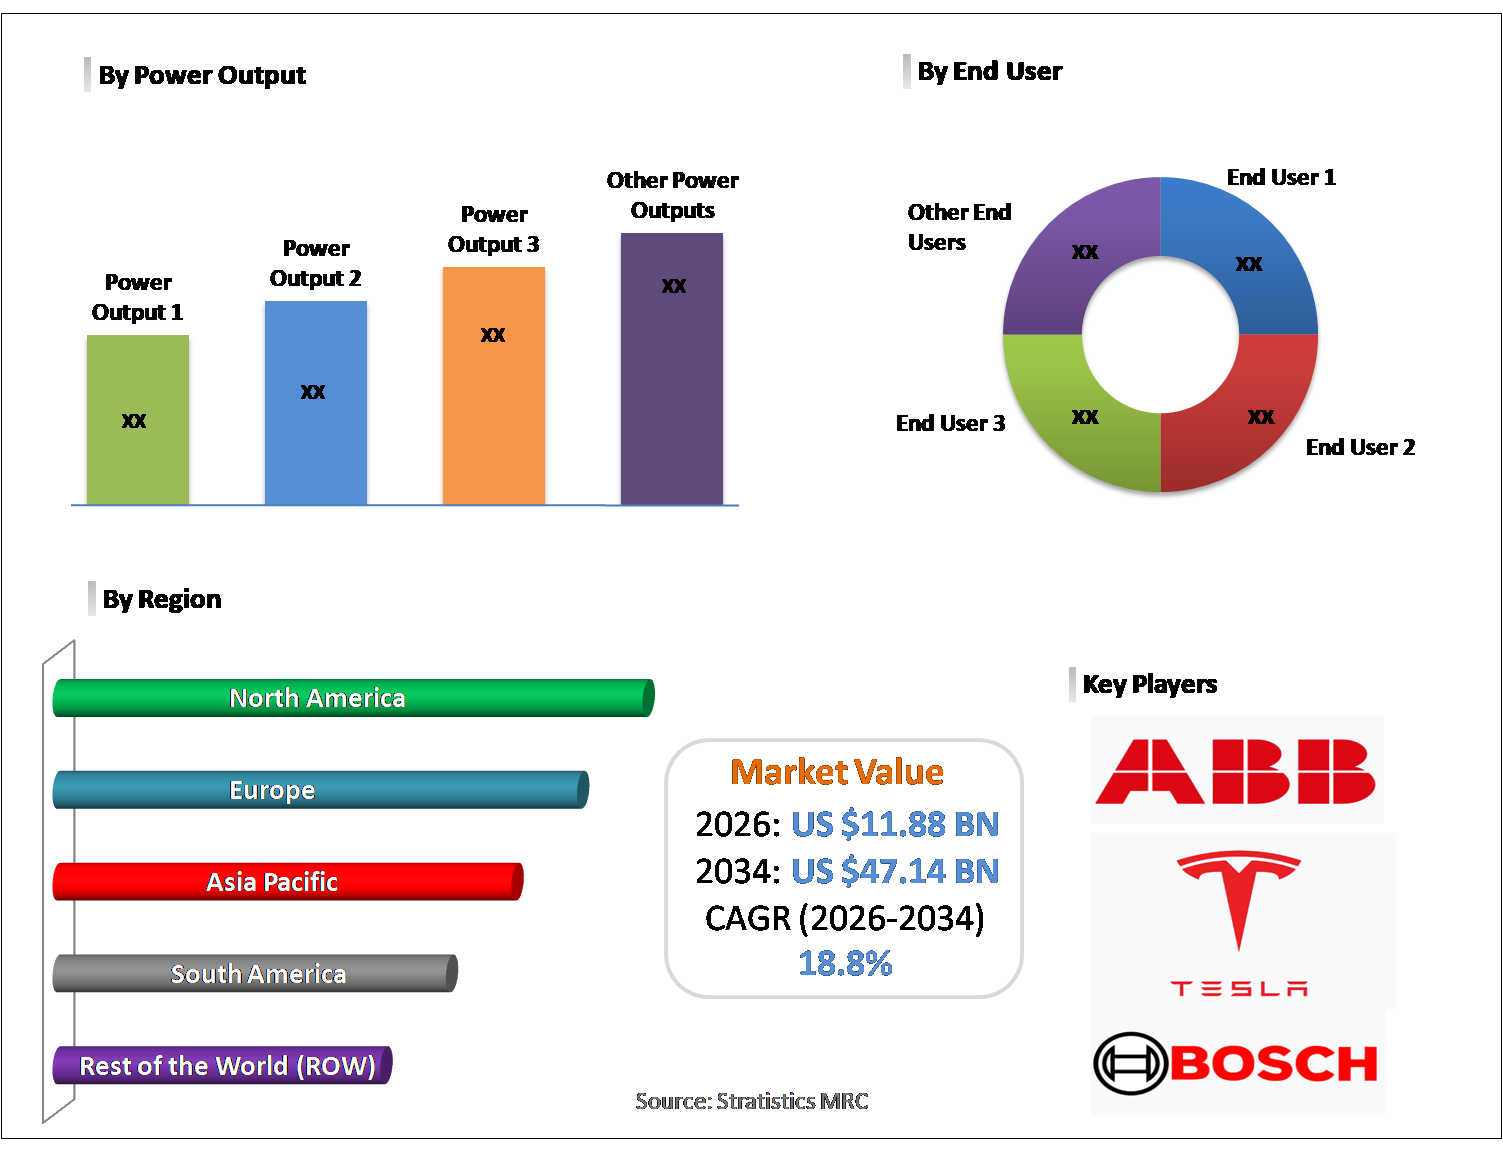
According to Stratistics MRC, the Global Next‑Generation EV Charging Networks Market is accounted for $11.88 billion in 2026 and is expected to reach $47.14 billion by 2034 growing at a CAGR of 18.8% during the forecast period. Next-Generation EV Charging Networks form a sophisticated infrastructure framework built to accommodate the expanding adoption of electric vehicles. By combining high-speed charging stations, smart grid integration, renewable power inputs, and battery storage solutions, these systems improve performance and dependability. Advanced technologies such as IoT connectivity, artificial intelligence-based energy management, and real-time data analytics help minimize charging durations and regulate power distribution effectively. Features like mobile app access, contactless payments, and vehicle-to-grid functionality enhance user experience while supporting grid resilience. With accelerating global electrification initiatives, these innovative charging networks play a critical role in enabling efficient and sustainable mobility systems.
According to the IEA Global EV Outlook 2023, the number of publicly accessible charging points worldwide reached 2.7 million at the end of 2022, with 900,000 added during that year — a 55% increase compared to 2021.
Market Dynamics:
Driver:
Rapid growth in electric vehicle adoption
The swift expansion of electric vehicle usage across global markets significantly fuels the growth of next-generation charging networks. Growing sustainability concerns, favorable policy incentives, tighter emissions standards, and falling battery prices are motivating individuals and enterprises to adopt EVs. As more passenger cars and commercial fleets become electric, the requirement for dependable, high-speed, and widely distributed charging stations rises steadily. Increasing urban populations and corporate fleet electrification amplify infrastructure needs. To accommodate growing EV volumes and alleviate range anxiety, advanced charging systems featuring ultra-fast technology and intelligent network integration are becoming critical to building efficient and future-ready mobility frameworks worldwide.
Restraint:
High initial infrastructure costs
Elevated setup expenses associated with advanced EV charging infrastructure significantly restrict market expansion. Establishing high-power stations requires investments in equipment, electrical grid enhancements, property procurement, and intelligent management platforms. Additional technologies, including cooling mechanisms and battery storage systems, add to overall project budgets. For many investors, extended return-on-investment timelines and unpredictable demand levels increase financial uncertainty. In developing regions, insufficient capital availability and limited governmental incentives further delay network rollout. Such economic challenges impede large-scale installation efforts and slow the global penetration of sophisticated and next-generation charging solutions.
Opportunity:
Development of ultra-fast and wireless charging
Innovation in rapid and cable-free charging systems opens new pathways for infrastructure development. Ultra-high-capacity chargers shorten refueling durations, increasing practicality for individual users and fleet operators. Inductive wireless charging technologies provide added convenience by removing the need for plugs and manual handling. Such advancements enable broader installation across smart cities, parking facilities, and automated transport systems. Continuous improvements in electrical components and safety mechanisms enhance system reliability. As consumers prioritize speed and simplicity, deploying advanced and next-generation charging formats offers strong competitive advantages and fuels sustained growth in the evolving EV ecosystem.
Threat:
Intense market competition and price wars
Growing rivalry among infrastructure providers, energy companies, and technology firms represents a major challenge for advanced charging networks. Rapid expansion by multiple participants intensifies competition, often driving down service prices and compressing margins. Promotional pricing tactics and strategic partnerships can escalate into prolonged price competition, impacting financial stability. Established corporations with substantial resources may dominate smaller operators, encouraging consolidation trends. Such competitive pressures create investment risks and reduce incentives for continuous technological advancement, potentially slowing balanced and sustainable growth of next-generation EV charging infrastructure worldwide.
Covid-19 Impact:
The outbreak of COVID-19 initially hindered expansion in advanced EV charging infrastructure as global supply chains were disrupted and infrastructure projects faced postponements. Movement restrictions reduced transportation activity, temporarily weakening demand for public charging services. Production constraints limited access to essential hardware and technological components. Despite short-term setbacks, the crisis encouraged governments to prioritize sustainable recovery initiatives and clean energy investments. Emphasis on resilient infrastructure, digital transformation, and environmentally friendly mobility stimulated renewed funding and policy support. Consequently, the market regained momentum after the pandemic, establishing a stronger foundation for long-term and sustainable growth.
The AC charging segment is expected to be the largest during the forecast period
The AC charging segment is expected to account for the largest market share during the forecast period because of its extensive presence and economic advantages. It is widely utilized in residential complexes, office buildings, and public parking areas where vehicles are stationary for longer durations, allowing sufficient charging time. Compared to high-power alternatives, AC systems require lower investment and are easier to maintain, encouraging large-scale implementation. Their seamless integration with standard electrical grids further supports expansion. Since routine commuting demands can typically be fulfilled through steady overnight charging, AC charging remains the most prevalent and established infrastructure choice in the market.
The public segment is expected to have the highest CAGR during the forecast period
Over the forecast period, the public segment is predicted to witness the highest growth rate. Rising electric vehicle ownership and policy-backed deployment strategies are increasing installation of charging stations in urban areas and transportation routes. Public facilities are essential for enabling long-distance travel and enhancing driver confidence. Strong participation from energy providers, private investors, and traditional fuel companies further accelerates network rollout. With the growth of electric fleets and mobility services, demand for widely accessible charging hubs is rising significantly, positioning the public segment as the most rapidly expanding category.
Region with largest share:
During the forecast period, the Asia Pacific region is expected to hold the largest market share owing to substantial electric vehicle penetration and proactive infrastructure development strategies. Growing urban centers, increasing consumer purchasing power, and heightened focus on emission reduction have fueled demand for electric mobility. Regional authorities provide financial incentives and policy support to accelerate charging network deployment. The strong manufacturing base for electric vehicles and battery technologies enhances supply chain efficiency. Additionally, investments in smart grid systems and renewable energy projects contribute to sustained infrastructure expansion, reinforcing Asia-Pacific’s leadership in the global charging network landscape.
Region with highest CAGR:
Over the forecast period, the Europe region is anticipated to exhibit the highest CAGR, driven by ambitious climate goals and comprehensive regulatory frameworks. Stringent emissions policies and strong governmental backing are encouraging large-scale deployment of charging facilities across highways and urban centers. Rising electric vehicle ownership among individuals and fleet operators fuels infrastructure demand. Harmonized charging standards and partnerships between energy providers and technology companies improve network integration. With sustainability initiatives deeply embedded in policy agendas, Europe is rapidly expanding its next-generation charging systems, positioning the region for accelerated and sustained market growth.

Key players in the market
Some of the key players in Next‑Generation EV Charging Networks Market include Blink Charging, Chargefox, ChargePoint, Electrify America, EVgo, Fastned, Ionity, ABB Ltd., Allego N.V., Beam Global, Siemens AG, TATA Power Limited, Tesla, Inc., TotalEnergies SE, Bosch, Shell Recharge, FLO and Rivian Adventure Network.
Key Developments:
In February 2026, Siemens announced the acquisition of Canopus AI, an innovator in computational and AI-driven metrology solutions, enabling semiconductor manufacturers to achieve new levels of precision and efficiency in wafer and mask inspection processes. This acquisition strengthens Siemens’ position in the semiconductor manufacturing ecosystem and expands its semiconductor design and manufacturing digital thread by integrating additional cutting-edge metrology technologies, enhanced with advanced AI capabilities.
In October 2025, ABB has signed a term sheet agreement with Dutch renewable energy company SwitcH2 to engineer and supply automation and electrification solutions for SwitcH2’s floating production, storage and offloading (FPSO) unit dedicated to producing green ammonia from green hydrogen.
In September 2025, Bosch and Alibaba Group announced an expanded strategic partnership to accelerate digital transformation through advanced cloud computing and AI technologies. The enhanced collaboration will focus on cloud-based enterprise operations, AI-driven business innovations, and e-commerce expansion.
Charger Types Covered:
• AC Charging
• DC Fast Charging
• Wireless Charging
Power Outputs Covered:
• Up to 3.7 kW
• 3.7-22 kW
• 22-100 kW
• 100-350 kW
• Above 350 kW
Connector Types Covered:
• CHAdeMO
• CCS (Combined Charging System)
• Type 2
• Other Connector Types
Ownership Models Covered:
• Membership Networks
• Non-Membership / Pay-Per-Use
Installation Types Covered:
• Fixed Charging Stations
• Portable Charging Units
Connectivities Covered:
• Standalone
• Smart Connected
Applications Covered:
• Residential
• Commercial
• Public
End Users Covered:
• Private Consumers
• Fleet Operators
• Government & Municipalities
• Other End Users
Regions Covered:
• North America
o United States
o Canada
o Mexico
• Europe
o United Kingdom
o Germany
o France
o Italy
o Spain
o Netherlands
o Belgium
o Sweden
o Switzerland
o Poland
o Rest of Europe
• Asia Pacific
o China
o Japan
o India
o South Korea
o Australia
o Indonesia
o Thailand
o Malaysia
o Singapore
o Vietnam
o Rest of Asia Pacific
• South America
o Brazil
o Argentina
o Colombia
o Chile
o Peru
o Rest of South America
• Rest of the World (RoW)
o Middle East
§ Saudi Arabia
§ United Arab Emirates
§ Qatar
§ Israel
§ Rest of Middle East
o Africa
§ South Africa
§ Egypt
§ Morocco
§ Rest of Africa
What our report offers:
- Market share assessments for the regional and country-level segments
- Strategic recommendations for the new entrants
- Covers Market data for the years 2023, 2024, 2025, 2026, 2027, 2028, 2030, 2032 and 2034
- Market Trends (Drivers, Constraints, Opportunities, Threats, Challenges, Investment Opportunities, and recommendations)
- Strategic recommendations in key business segments based on the market estimations
- Competitive landscaping mapping the key common trends
- Company profiling with detailed strategies, financials, and recent developments
- Supply chain trends mapping the latest technological advancements
Free Customization Offerings:
All the customers of this report will be entitled to receive one of the following free customization options:
• Company Profiling
o Comprehensive profiling of additional market players (up to 3)
o SWOT Analysis of key players (up to 3)
• Regional Segmentation
o Market estimations, Forecasts and CAGR of any prominent country as per the client's interest (Note: Depends on feasibility check)
• Competitive Benchmarking
o Benchmarking of key players based on product portfolio, geographical presence, and strategic alliances
Table of Contents
1 Executive Summary
1.1 Market Snapshot and Key Highlights
1.2 Growth Drivers, Challenges, and Opportunities
1.3 Competitive Landscape Overview
1.4 Strategic Insights and Recommendations
2 Research Framework
2.1 Study Objectives and Scope
2.2 Stakeholder Analysis
2.3 Research Assumptions and Limitations
2.4 Research Methodology
2.4.1 Data Collection (Primary and Secondary)
2.4.2 Data Modeling and Estimation Techniques
2.4.3 Data Validation and Triangulation
2.4.4 Analytical and Forecasting Approach
3 Market Dynamics and Trend Analysis
3.1 Market Definition and Structure
3.2 Key Market Drivers
3.3 Market Restraints and Challenges
3.4 Growth Opportunities and Investment Hotspots
3.5 Industry Threats and Risk Assessment
3.6 Technology and Innovation Landscape
3.7 Emerging and High-Growth Markets
3.8 Regulatory and Policy Environment
3.9 Impact of COVID-19 and Recovery Outlook
4 Competitive and Strategic Assessment
4.1 Porter's Five Forces Analysis
4.1.1 Supplier Bargaining Power
4.1.2 Buyer Bargaining Power
4.1.3 Threat of Substitutes
4.1.4 Threat of New Entrants
4.1.5 Competitive Rivalry
4.2 Market Share Analysis of Key Players
4.3 Product Benchmarking and Performance Comparison
5 Global Next‑Generation EV Charging Networks Market, By Charger Type
5.1 AC Charging
5.2 DC Fast Charging
5.3 Wireless Charging
6 Global Next‑Generation EV Charging Networks Market, By Power Output
6.1 Up to 3.7 kW
6.2 3.7-22 kW
6.3 22-100 kW
6.4 100-350 kW
6.5 Above 350 kW
7 Global Next‑Generation EV Charging Networks Market, By Connector Type
7.1 CHAdeMO
7.2 CCS (Combined Charging System)
7.3 Type 2
7.4 Other Connector Types
8 Global Next‑Generation EV Charging Networks Market, By Ownership Model
8.1 Membership Networks
8.2 Non-Membership / Pay-Per-Use
9 Global Next‑Generation EV Charging Networks Market, By Installation Type
9.1 Fixed Charging Stations
9.2 Portable Charging Units
10 Global Next‑Generation EV Charging Networks Market, By Connectivity
10.1 Standalone
10.2 Smart Connected
11 Global Next‑Generation EV Charging Networks Market, By Application
11.1 Residential
11.2 Commercial
11.3 Public
12 Global Next‑Generation EV Charging Networks Market, By End User
12.1 Private Consumers
12.2 Fleet Operators
12.3 Government & Municipalities
12.4 Other End Users
13 Global Next‑Generation EV Charging Networks Market, By Geography
13.1 North America
13.1.1 United States
13.1.2 Canada
13.1.3 Mexico
13.2 Europe
13.2.1 United Kingdom
13.2.2 Germany
13.2.3 France
13.2.4 Italy
13.2.5 Spain
13.2.6 Netherlands
13.2.7 Belgium
13.2.8 Sweden
13.2.9 Switzerland
13.2.10 Poland
13.2.11 Rest of Europe
13.3 Asia Pacific
13.3.1 China
13.3.2 Japan
13.3.3 India
13.3.4 South Korea
13.3.5 Australia
13.3.6 Indonesia
13.3.7 Thailand
13.3.8 Malaysia
13.3.9 Singapore
13.3.10 Vietnam
13.3.11 Rest of Asia Pacific
13.4 South America
13.4.1 Brazil
13.4.2 Argentina
13.4.3 Colombia
13.4.4 Chile
13.4.5 Peru
13.4.6 Rest of South America
13.5 Rest of the World (RoW)
13.5.1 Middle East
13.5.1.1 Saudi Arabia
13.5.1.2 United Arab Emirates
13.5.1.3 Qatar
13.5.1.4 Israel
13.5.1.5 Rest of Middle East
13.5.2 Africa
13.5.2.1 South Africa
13.5.2.2 Egypt
13.5.2.3 Morocco
13.5.2.4 Rest of Africa
14 Strategic Market Intelligence
14.1 Industry Value Network and Supply Chain Assessment
14.2 White-Space and Opportunity Mapping
14.3 Product Evolution and Market Life Cycle Analysis
14.4 Channel, Distributor, and Go-to-Market Assessment
15 Industry Developments and Strategic Initiatives
15.1 Mergers and Acquisitions
15.2 Partnerships, Alliances, and Joint Ventures
15.3 New Product Launches and Certifications
15.4 Capacity Expansion and Investments
15.5 Other Strategic Initiatives
16 Company Profiles
16.1 Blink Charging
16.2 Chargefox
16.3 ChargePoint
16.4 Electrify America
16.5 EVgo
16.6 Fastned
16.7 Ionity
16.8 ABB Ltd.
16.9 Allego N.V.
16.10 Beam Global
16.11 Siemens AG
16.12 TATA Power Limited
16.13 Tesla, Inc.
16.14 TotalEnergies SE
16.15 Bosch
16.16 Shell Recharge
16.17 FLO
16.18 Rivian Adventure Network
List of Tables
1 Global Next‑Generation EV Charging Networks Market Outlook, By Region (2023-2034) ($MN)
2 Global Next‑Generation EV Charging Networks Market Outlook, By Charger Type (2023-2034) ($MN)
3 Global Next‑Generation EV Charging Networks Market Outlook, By AC Charging (2023-2034) ($MN)
4 Global Next‑Generation EV Charging Networks Market Outlook, By DC Fast Charging (2023-2034) ($MN)
5 Global Next‑Generation EV Charging Networks Market Outlook, By Wireless Charging (2023-2034) ($MN)
6 Global Next‑Generation EV Charging Networks Market Outlook, By Power Output (2023-2034) ($MN)
7 Global Next‑Generation EV Charging Networks Market Outlook, By Up to 3.7 kW (2023-2034) ($MN)
8 Global Next‑Generation EV Charging Networks Market Outlook, By 3.7-22 kW (2023-2034) ($MN)
9 Global Next‑Generation EV Charging Networks Market Outlook, By 22-100 kW (2023-2034) ($MN)
10 Global Next‑Generation EV Charging Networks Market Outlook, By 100-350 kW (2023-2034) ($MN)
11 Global Next‑Generation EV Charging Networks Market Outlook, By Above 350 kW (2023-2034) ($MN)
12 Global Next‑Generation EV Charging Networks Market Outlook, By Connector Type (2023-2034) ($MN)
13 Global Next‑Generation EV Charging Networks Market Outlook, By CHAdeMO (2023-2034) ($MN)
14 Global Next‑Generation EV Charging Networks Market Outlook, By CCS (Combined Charging System) (2023-2034) ($MN)
15 Global Next‑Generation EV Charging Networks Market Outlook, By Type 2 (2023-2034) ($MN)
16 Global Next‑Generation EV Charging Networks Market Outlook, By Other Connector Types (2023-2034) ($MN)
17 Global Next‑Generation EV Charging Networks Market Outlook, By Ownership Model (2023-2034) ($MN)
18 Global Next‑Generation EV Charging Networks Market Outlook, By Membership Networks (2023-2034) ($MN)
19 Global Next‑Generation EV Charging Networks Market Outlook, By Non-Membership / Pay-Per-Use (2023-2034) ($MN)
20 Global Next‑Generation EV Charging Networks Market Outlook, By Installation Type (2023-2034) ($MN)
21 Global Next‑Generation EV Charging Networks Market Outlook, By Fixed Charging Stations (2023-2034) ($MN)
22 Global Next‑Generation EV Charging Networks Market Outlook, By Portable Charging Units (2023-2034) ($MN)
23 Global Next‑Generation EV Charging Networks Market Outlook, By Connectivity (2023-2034) ($MN)
24 Global Next‑Generation EV Charging Networks Market Outlook, By Standalone (2023-2034) ($MN)
25 Global Next‑Generation EV Charging Networks Market Outlook, By Smart Connected (2023-2034) ($MN)
26 Global Next‑Generation EV Charging Networks Market Outlook, By Application (2023-2034) ($MN)
27 Global Next‑Generation EV Charging Networks Market Outlook, By Residential (2023-2034) ($MN)
28 Global Next‑Generation EV Charging Networks Market Outlook, By Commercial (2023-2034) ($MN)
29 Global Next‑Generation EV Charging Networks Market Outlook, By Public (2023-2034) ($MN)
30 Global Next‑Generation EV Charging Networks Market Outlook, By End User (2023-2034) ($MN)
31 Global Next‑Generation EV Charging Networks Market Outlook, By Private Consumers (2023-2034) ($MN)
32 Global Next‑Generation EV Charging Networks Market Outlook, By Fleet Operators (2023-2034) ($MN)
33 Global Next‑Generation EV Charging Networks Market Outlook, By Government & Municipalities (2023-2034) ($MN)
34 Global Next‑Generation EV Charging Networks Market Outlook, By Other End Users (2023-2034) ($MN)
Note: Tables for North America, Europe, APAC, South America, and Rest of the World (RoW) Regions are also represented in the same manner as above.
List of Figures
RESEARCH METHODOLOGY

We at ‘Stratistics’ opt for an extensive research approach which involves data mining, data validation, and data analysis. The various research sources include in-house repository, secondary research, competitor’s sources, social media research, client internal data, and primary research.
Our team of analysts prefers the most reliable and authenticated data sources in order to perform the comprehensive literature search. With access to most of the authenticated data bases our team highly considers the best mix of information through various sources to obtain extensive and accurate analysis.
Each report takes an average time of a month and a team of 4 industry analysts. The time may vary depending on the scope and data availability of the desired market report. The various parameters used in the market assessment are standardized in order to enhance the data accuracy.
Data Mining
The data is collected from several authenticated, reliable, paid and unpaid sources and is filtered depending on the scope & objective of the research. Our reports repository acts as an added advantage in this procedure. Data gathering from the raw material suppliers, distributors and the manufacturers is performed on a regular basis, this helps in the comprehensive understanding of the products value chain. Apart from the above mentioned sources the data is also collected from the industry consultants to ensure the objective of the study is in the right direction.
Market trends such as technological advancements, regulatory affairs, market dynamics (Drivers, Restraints, Opportunities and Challenges) are obtained from scientific journals, market related national & international associations and organizations.
Data Analysis
From the data that is collected depending on the scope & objective of the research the data is subjected for the analysis. The critical steps that we follow for the data analysis include:
- Product Lifecycle Analysis
- Competitor analysis
- Risk analysis
- Porters Analysis
- PESTEL Analysis
- SWOT Analysis
The data engineering is performed by the core industry experts considering both the Marketing Mix Modeling and the Demand Forecasting. The marketing mix modeling makes use of multiple-regression techniques to predict the optimal mix of marketing variables. Regression factor is based on a number of variables and how they relate to an outcome such as sales or profits.
Data Validation
The data validation is performed by the exhaustive primary research from the expert interviews. This includes telephonic interviews, focus groups, face to face interviews, and questionnaires to validate our research from all aspects. The industry experts we approach come from the leading firms, involved in the supply chain ranging from the suppliers, distributors to the manufacturers and consumers so as to ensure an unbiased analysis.
We are in touch with more than 15,000 industry experts with the right mix of consultants, CEO's, presidents, vice presidents, managers, experts from both supply side and demand side, executives and so on.
The data validation involves the primary research from the industry experts belonging to:
- Leading Companies
- Suppliers & Distributors
- Manufacturers
- Consumers
- Industry/Strategic Consultants
Apart from the data validation the primary research also helps in performing the fill gap research, i.e. providing solutions for the unmet needs of the research which helps in enhancing the reports quality.
For more details about research methodology, kindly write to us at info@strategymrc.com
Frequently Asked Questions
In case of any queries regarding this report, you can contact the customer service by filing the “Inquiry Before Buy” form available on the right hand side. You may also contact us through email: info@strategymrc.com or phone: +1-301-202-5929
Yes, the samples are available for all the published reports. You can request them by filling the “Request Sample” option available in this page.
Yes, you can request a sample with your specific requirements. All the customized samples will be provided as per the requirement with the real data masked.
All our reports are available in Digital PDF format. In case if you require them in any other formats, such as PPT, Excel etc you can submit a request through “Inquiry Before Buy” form available on the right hand side. You may also contact us through email: info@strategymrc.com or phone: +1-301-202-5929
We offer a free 15% customization with every purchase. This requirement can be fulfilled for both pre and post sale. You may send your customization requirements through email at info@strategymrc.com or call us on +1-301-202-5929.
We have 3 different licensing options available in electronic format.
- Single User Licence: Allows one person, typically the buyer, to have access to the ordered product. The ordered product cannot be distributed to anyone else.
- 2-5 User Licence: Allows the ordered product to be shared among a maximum of 5 people within your organisation.
- Corporate License: Allows the product to be shared among all employees of your organisation regardless of their geographical location.
All our reports are typically be emailed to you as an attachment.
To order any available report you need to register on our website. The payment can be made either through CCAvenue or PayPal payments gateways which accept all international cards.
We extend our support to 6 months post sale. A post sale customization is also provided to cover your unmet needs in the report.
Request Customization
We offer complimentary customization of up to 15% with every purchase. To share your customization requirements, feel free to email us at info@strategymrc.com or call us on +1-301-202-5929. .
Please Note: Customization within the 15% threshold is entirely free of charge. If your request exceeds this limit, we will conduct a feasibility assessment. Following that, a detailed quote and timeline will be provided.
WHY CHOOSE US ?

Assured Quality
Best in class reports with high standard of research integrity

24X7 Research Support
Continuous support to ensure the best customer experience.

Free Customization
Adding more values to your product of interest.

Safe & Secure Access
Providing a secured environment for all online transactions.

Trusted by 600+ Brands
Serving the most reputed brands across the world.