
Permanent Magnet Motor Market
Permanent Magnet Motor Market Forecasts to 2028 – Global Analysis By Motor Type (Brushless DC, Hermetic Motors), Power Rating (Up to 25 kW, 25–100 kW), Magnet Type (Neodymium, Samarium Cobalt) and By Geography

|
Years Covered |
2020-2028 |
|
Estimated Year Value (2021) |
US $42.72 BN |
|
Projected Year Value (2028) |
US $90.95 BN |
|
CAGR (2021 - 2028) |
11.4% |
|
Regions Covered |
North America, Europe, Asia Pacific, South America, and Middle East & Africa |
|
Countries Covered |
US, Canada, Mexico, Germany, UK, Italy, France, Spain, Japan, China, India, Australia, New Zealand, South Korea, Rest of Asia Pacific, South America, Argentina, Brazil, Chile, Middle East & Africa, Saudi Arabia, UAE, Qatar, and South Africa |
|
Largest Market |
Asia Pacific |
|
Highest Growing Market |
North America |
According to Stratistics MRC, the Global Permanent Magnet Motor Market is accounted for $42.72 billion in 2021 and is expected to reach $90.95 billion by 2028 growing at a CAGR of 11.4% during the forecast period. Permanent magnet motor is a synchronous motor with permanent magnets attached to the surface of the motor. These motors are of three types, namely, permanent magnet AC motors, permanent magnet DC motors, and brushless DC motor. Permanent magnet motors have various advantages such as high efficiency, high power density, and ease of control.
Market Dynamics:
Driver:
Growing Demand For Energy-Efficient
The increasing demand for higher operating efficiency motors is likely to fuel the requirement of it across different industries. Most industries are using it to offer higher-functioning products with additional features residential and commercial sectors are also looking to use it for their HVAC applications. Appliances powered by efficient permanent magnet motors use 22-42% less energy than appliances using conventional alternating current motors. Appliances using PM motors are also more reliable than conventional appliances, an important attribute for appliances designed for use in off-grid or rural environments. These unique features are improving consumer satisfaction in off- and weak-grid markets and driving customers’ willingness to pay for better-performing appliances. Increasing reliance on electronic devices, growing industrial demand for industrial purposes such as in energy renewable in various industries like healthcare, aero-defence, etc and growing need for efficiency for electric motors and lowering the size of machines are driving the market.
Restraint:
High Cost
There is a high cost that is associated with the use of the market products. The main reason behind this increasing cost is that the cost of rare-earth magnets is high which adds to these market motors. A permanent magnet motor delivers high efficiency but is priced high because of the use of costly rare-earth magnets. Although some industrial, as well as commercial electronics manufacturers are reluctant to invest in it, is one of the factors restraint the market growth.
Opportunity:
Acceptance of Cost-Effective Ferrite Permanent Magnets
Rare-earth permanent magnets that are commonly used for permanent magnet motors are expensive. This is due to the use of expensive neodymium or samarium-cobalt magnets. Thus, ferrite magnets are used to manufacture cost-effective, permanent magnet motors. Apart from being cost-effective, these ferrite permanent magnets are easily available in China and have negligible current losses in low-frequency applications, such as motor drives. Many companies are seeking opportunities to use cost-effective ferrites due to the high pricing of rare-earth magnets. This factor is likely to create opportunities for the market.
Threat:
Easy Accessibility of Low-Quality and Low-Cost Electric Motors
The organized sector in the market mainly targets industrial buyers and maintains excellent product quality, while the unorganized sector offers low-cost alternatives to tap local markets. Local manufacturers of electric motors in most countries target the unorganized sector and compete strongly with the global suppliers in the respective markets. Leading market players are currently exposed to intense competition from unorganized players supplying inexpensive and low-quality electric motors. This acts as a key threat to the growth of the market.
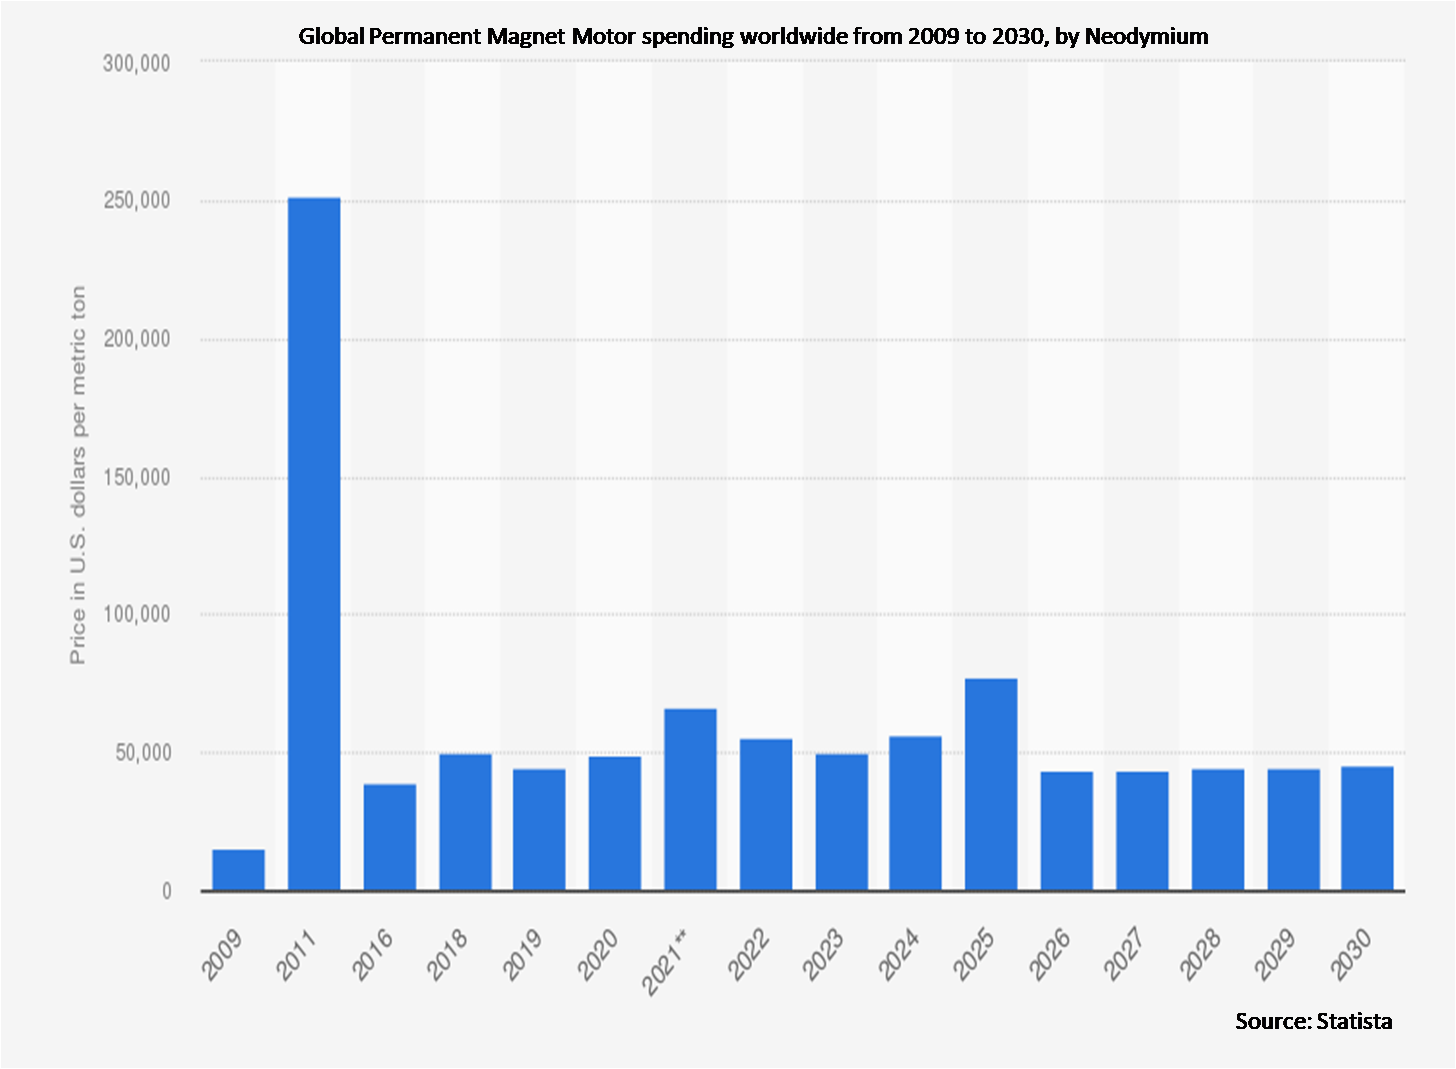
Neodymium segment is expected to be the largest during the forecast period
The high-energy product and high residual flux density of neodymium make it a compulsive choice of material for industrial applications. Neodymium offers both high- and low-grade variants, enabling it to deliver superior performance and torque, as compared to a conventional motor, thereby increasing its adoption. Neodymium is a primary element used in the production of permanent magnet motor, which is a rare earth element, and its extraction is quite expensive.
The brushless DC segment is expected to have the highest CAGR during the forecast period
A brushless DC electric motor, or electronically commutated motor (ECM), are synchronous motors backed by direct current electricity through an inverter or switching power supply, which generates power as alternating current to let each motor phase through a closed-loop controller. The controller gives current pulses to the motor windings while maintaining the motor's torque and speed, replacing the commutator in several conventional electric motors. The Brushless motor system and PMSM (permanent magnet synchronous motor) share the same design.
Region with highest share:
The Asia Pacific is projected to hold the highest market share, due to the growing investments in the automotive sector, especially in electric vehicles, and the growing manufacturing of electronics in the area. Moreover, the growing demands for energy-efficient motors for end-use applications such as electric vehicles, consumer electronics, and automobiles in the region. Furthermore, the rising number of industries including aerospace, automotive, oil & gas, and others; and growing demand for electric vehicles among consumers. Another reason for the growth of the market in APAC is the increase in the number of manufacturing plants in various sectors, such as transportation, chemicals, and pharmaceutical industries.
Region with highest CAGR:
North America is projected to have the highest CAGR, owing to the increasing investments by market players and other organizations, coupled with government initiatives toward building an energy-efficient and sustainable environment. The strong wind energy sector is set to grow in the province and boost the growth of the market during the forecast period.

Key players in the market:
Some of the key players profiled in the Permanent Magnet Motor Market include Yaskawa Electric Corporation, Baker Hughes, Toshiba International Corporation, Siemens AG, Rockwell Automation, Inc., Nidec Corporation, Johnson Electric Holdings Limited, Franklin Electric, Emerson Electric Co., Bühler Motor Group, Bosch Rexroth AG, Bonfiglioli Italia S.P.A., Autotrol Corporation, AMETEK, Inc., Allied Motion Technologies Inc., ABB Ltd.
Key developments:
In August 2018: Baker Hughes launched its magnificent permanent magnet motor (PMM) enabling operators to enhance electric submersible pumping efficiency thereby lowering powering requirement and overall lifting cost.
In December 2020: Toshiba Corporation announced that it developed a new magnetic material that delivers improved motor energy conversion efficiency. Through testing in an induction motor in the railway rolling stock drive systems, the company confirmed an efficiency increase of 0.9 pt, with an improvement approaching the efficiency of permanent magnet synchronous motors. The material can also be installed in permanent magnet synchronous motors to realize much higher efficiency.
In April 2021: Franklin Electric Co. Inc. acquired Puronics, Inc. and its wholly owned subsidiaries, headquartered in Livermore, California. Puronics is a residential and commercial water treatment products and services provider that is operating four company owned service centers and serving approximately 133 independent water quality dealers with approximately 260 locations in 31 states.
Motor Types Covered:
• Brushless DC
• Hermetic Motors
• Permanent Magnet Alternate Current Motor (PMAC)
• Permanent Magnet Direct Current Motor (PMDC)
Power Ratings Covered:
• Up to 25 kW
• 25–100 kW
• 100–300 kW
• 300 kW and Above
Magnet Types Covered:
• Neodymium
• Samarium Cobalt
• Ferrite
End Users Covered:
• Industrial
• Commercial
• Other End Users
Regions Covered:
• North America
o US
o Canada
o Mexico
• Europe
o Germany
o UK
o Italy
o France
o Spain
o Rest of Europe
• Asia Pacific
o Japan
o China
o India
o Australia
o New Zealand
o South Korea
o Rest of Asia Pacific
• South America
o Argentina
o Brazil
o Chile
o Rest of South America
• Middle East & Africa
o Saudi Arabia
o UAE
o Qatar
o South Africa
o Rest of Middle East & Africa
What our report offers:
- Market share assessments for the regional and country-level segments
- Strategic recommendations for the new entrants
- Covers Market data for the years 2020, 2021, 2022, 2025 and 2028
- Market Trends (Drivers, Constraints, Opportunities, Threats, Challenges, Investment Opportunities, and recommendations)
- Strategic recommendations in key business segments based on the market estimations
- Competitive landscaping mapping the key common trends
- Company profiling with detailed strategies, financials, and recent developments
- Supply chain trends mapping the latest technological advancements
Free Customization Offerings:
All the customers of this report will be entitled to receive one of the following free customization options:
• Company Profiling
o Comprehensive profiling of additional market players (up to 3)
o SWOT Analysis of key players (up to 3)
• Regional Segmentation
o Market estimations, Forecasts and CAGR of any prominent country as per the client's interest (Note: Depends on feasibility check)
• Competitive Benchmarking
o Benchmarking of key players based on product portfolio, geographical presence, and strategic alliances
Table of Contents
1 Executive Summary
2 Preface
2.1 Abstract
2.2 Stake Holders
2.3 Research Scope
2.4 Research Methodology
2.4.1 Data Mining
2.4.2 Data Analysis
2.4.3 Data Validation
2.4.4 Research Approach
2.5 Research Sources
2.5.1 Primary Research Sources
2.5.2 Secondary Research Sources
2.5.3 Assumptions
3 Market Trend Analysis
3.1 Introduction
3.2 Drivers
3.3 Restraints
3.4 Opportunities
3.5 Threats
3.6 End User Analysis
3.7 Emerging Markets
3.8 Impact of Covid-19
4 Porters Five Force Analysis
4.1 Bargaining power of suppliers
4.2 Bargaining power of buyers
4.3 Threat of substitutes
4.4 Threat of new entrants
4.5 Competitive rivalry
5 Global Permanent Magnet Motor Market, By Motor Type
5.1 Introduction
5.2 Brushless DC
5.3 Hermetic Motors
5.4 Permanent Magnet Alternate Current Motor (PMAC)
5.5 Permanent Magnet Direct Current Motor (PMDC)
6 Global Permanent Magnet Motor Market, By Power Rating
6.1 Introduction
6.2 Up to 25 kW
6.3 25–100 kW
6.4 100–300 kW
6.5 300 kW and Above
7 Global Permanent Magnet Motor Market, By Magnet Type
7.1 Introduction
7.2 Neodymium
7.3 Samarium Cobalt
7.4 Ferrite
8 Global Permanent Magnet Motor Market, By End User
8.1 Introduction
8.2 Industrial
8.2.1 Aerospace & Aviation
8.2.2 Automotive
8.2.3 Chemicals & Petrochemicals
8.2.4 Electronics
8.2.5 Food & Beverage
8.2.6 Pulp & Paper
8.2.7 Robotics
8.2.8 Textile
8.3 Commercial
8.3.1 Banks
8.3.2 Malls
8.3.3 Medical/Healthcare
8.3.4 Offices
8.3.5 Residential
8.4 Other End Users
8.4.1 Defense
8.4.2 Railways
9 Global Permanent Magnet Motor Market, By Geography
9.1 Introduction
9.2 North America
9.2.1 US
9.2.2 Canada
9.2.3 Mexico
9.3 Europe
9.3.1 Germany
9.3.2 UK
9.3.3 Italy
9.3.4 France
9.3.5 Spain
9.3.6 Rest of Europe
9.4 Asia Pacific
9.4.1 Japan
9.4.2 China
9.4.3 India
9.4.4 Australia
9.4.5 New Zealand
9.4.6 South Korea
9.4.7 Rest of Asia Pacific
9.5 South America
9.5.1 Argentina
9.5.2 Brazil
9.5.3 Chile
9.5.4 Rest of South America
9.6 Middle East & Africa
9.6.1 Saudi Arabia
9.6.2 UAE
9.6.3 Qatar
9.6.4 South Africa
9.6.5 Rest of Middle East & Africa
10 Key Developments
10.1 Agreements, Partnerships, Collaborations and Joint Ventures
10.2 Acquisitions & Mergers
10.3 New Product Launch
10.4 Expansions
10.5 Other Key Strategies
11 Company Profiling
11.1 Yaskawa Electric Corporation
11.2 Baker Hughes
11.3 Toshiba International Corporation
11.4 Siemens AG
11.5 Rockwell Automation, Inc.
11.6 Nidec Corporation
11.7 Johnson Electric Holdings Limited
11.8 Franklin Electric
11.9 Emerson Electric Co.
11.10 Bühler Motor Group
11.11 Bosch Rexroth AG
11.12 Bonfiglioli Italia S.P.A.
11.13 Autotrol Corporation
11.14 AMETEK, Inc.
11.15 Allied Motion Technologies Inc.
11.16 ABB Ltd.
List of Tables
1 Global Permanent Magnet Motor Market Outlook, By Region (2020-2028) (US $MN)
2 Global Permanent Magnet Motor Market Outlook, By Motor Type (2020-2028) (US $MN)
3 Global Permanent Magnet Motor Market Outlook, By Brushless DC (2020-2028) (US $MN)
4 Global Permanent Magnet Motor Market Outlook, By Hermetic Motors (2020-2028) (US $MN)
5 Global Permanent Magnet Motor Market Outlook, By Permanent Magnet Alternate Current Motor (PMAC) (2020-2028) (US $MN)
6 Global Permanent Magnet Motor Market Outlook, By Permanent Magnet Direct Current Motor (PMDC) (2020-2028) (US $MN)
7 Global Permanent Magnet Motor Market Outlook, By Power Rating (2020-2028) (US $MN)
8 Global Permanent Magnet Motor Market Outlook, By Up to 25 kW (2020-2028) (US $MN)
9 Global Permanent Magnet Motor Market Outlook, By 25–100 kW (2020-2028) (US $MN)
10 Global Permanent Magnet Motor Market Outlook, By 100–300 kW (2020-2028) (US $MN)
11 Global Permanent Magnet Motor Market Outlook, By 300 kW and Above (2020-2028) (US $MN)
12 Global Permanent Magnet Motor Market Outlook, By Magnet Type (2020-2028) (US $MN)
13 Global Permanent Magnet Motor Market Outlook, By Neodymium (2020-2028) (US $MN)
14 Global Permanent Magnet Motor Market Outlook, By Samarium Cobalt (2020-2028) (US $MN)
15 Global Permanent Magnet Motor Market Outlook, By Ferrite (2020-2028) (US $MN)
16 Global Permanent Magnet Motor Market Outlook, By End User (2020-2028) (US $MN)
17 Global Permanent Magnet Motor Market Outlook, By Industrial (2020-2028) (US $MN)
18 Global Permanent Magnet Motor Market Outlook, By Aerospace & Aviation (2020-2028) (US $MN)
19 Global Permanent Magnet Motor Market Outlook, By Automotive (2020-2028) (US $MN)
20 Global Permanent Magnet Motor Market Outlook, By Chemicals & Petrochemicals (2020-2028) (US $MN)
21 Global Permanent Magnet Motor Market Outlook, By Electronics (2020-2028) (US $MN)
22 Global Permanent Magnet Motor Market Outlook, By Food & Beverage (2020-2028) (US $MN)
23 Global Permanent Magnet Motor Market Outlook, By Pulp & Paper (2020-2028) (US $MN)
24 Global Permanent Magnet Motor Market Outlook, By Robotics (2020-2028) (US $MN)
25 Global Permanent Magnet Motor Market Outlook, By Textile (2020-2028) (US $MN)
26 Global Permanent Magnet Motor Market Outlook, By Commercial (2020-2028) (US $MN)
27 Global Permanent Magnet Motor Market Outlook, By Bank (2020-2028) (US $MN)
28 Global Permanent Magnet Motor Market Outlook, By Malls (2020-2028) (US $MN)
29 Global Permanent Magnet Motor Market Outlook, By Medical/Healthcare (2020-2028) (US $MN)
30 Global Permanent Magnet Motor Market Outlook, By Office (2020-2028) (US $MN)
31 Global Permanent Magnet Motor Market Outlook, By Residential (2020-2028) (US $MN)
32 Global Permanent Magnet Motor Market Outlook, By Other End Users (2020-2028) (US $MN)
33 Global Permanent Magnet Motor Market Outlook, By Defense (2020-2028) (US $MN)
34 Global Permanent Magnet Motor Market Outlook, By Railways (2020-2028) (US $MN)
Note- Tables for North America, Europe, APAC, South America, and Middle East & Africa Regions are also represented in the same manner as above.
List of Figures
RESEARCH METHODOLOGY

We at ‘Stratistics’ opt for an extensive research approach which involves data mining, data validation, and data analysis. The various research sources include in-house repository, secondary research, competitor’s sources, social media research, client internal data, and primary research.
Our team of analysts prefers the most reliable and authenticated data sources in order to perform the comprehensive literature search. With access to most of the authenticated data bases our team highly considers the best mix of information through various sources to obtain extensive and accurate analysis.
Each report takes an average time of a month and a team of 4 industry analysts. The time may vary depending on the scope and data availability of the desired market report. The various parameters used in the market assessment are standardized in order to enhance the data accuracy.
Data Mining
The data is collected from several authenticated, reliable, paid and unpaid sources and is filtered depending on the scope & objective of the research. Our reports repository acts as an added advantage in this procedure. Data gathering from the raw material suppliers, distributors and the manufacturers is performed on a regular basis, this helps in the comprehensive understanding of the products value chain. Apart from the above mentioned sources the data is also collected from the industry consultants to ensure the objective of the study is in the right direction.
Market trends such as technological advancements, regulatory affairs, market dynamics (Drivers, Restraints, Opportunities and Challenges) are obtained from scientific journals, market related national & international associations and organizations.
Data Analysis
From the data that is collected depending on the scope & objective of the research the data is subjected for the analysis. The critical steps that we follow for the data analysis include:
- Product Lifecycle Analysis
- Competitor analysis
- Risk analysis
- Porters Analysis
- PESTEL Analysis
- SWOT Analysis
The data engineering is performed by the core industry experts considering both the Marketing Mix Modeling and the Demand Forecasting. The marketing mix modeling makes use of multiple-regression techniques to predict the optimal mix of marketing variables. Regression factor is based on a number of variables and how they relate to an outcome such as sales or profits.
Data Validation
The data validation is performed by the exhaustive primary research from the expert interviews. This includes telephonic interviews, focus groups, face to face interviews, and questionnaires to validate our research from all aspects. The industry experts we approach come from the leading firms, involved in the supply chain ranging from the suppliers, distributors to the manufacturers and consumers so as to ensure an unbiased analysis.
We are in touch with more than 15,000 industry experts with the right mix of consultants, CEO's, presidents, vice presidents, managers, experts from both supply side and demand side, executives and so on.
The data validation involves the primary research from the industry experts belonging to:
- Leading Companies
- Suppliers & Distributors
- Manufacturers
- Consumers
- Industry/Strategic Consultants
Apart from the data validation the primary research also helps in performing the fill gap research, i.e. providing solutions for the unmet needs of the research which helps in enhancing the reports quality.
For more details about research methodology, kindly write to us at info@strategymrc.com
Frequently Asked Questions
In case of any queries regarding this report, you can contact the customer service by filing the “Inquiry Before Buy” form available on the right hand side. You may also contact us through email: info@strategymrc.com or phone: +1-301-202-5929
Yes, the samples are available for all the published reports. You can request them by filling the “Request Sample” option available in this page.
Yes, you can request a sample with your specific requirements. All the customized samples will be provided as per the requirement with the real data masked.
All our reports are available in Digital PDF format. In case if you require them in any other formats, such as PPT, Excel etc you can submit a request through “Inquiry Before Buy” form available on the right hand side. You may also contact us through email: info@strategymrc.com or phone: +1-301-202-5929
We offer a free 15% customization with every purchase. This requirement can be fulfilled for both pre and post sale. You may send your customization requirements through email at info@strategymrc.com or call us on +1-301-202-5929.
We have 3 different licensing options available in electronic format.
- Single User Licence: Allows one person, typically the buyer, to have access to the ordered product. The ordered product cannot be distributed to anyone else.
- 2-5 User Licence: Allows the ordered product to be shared among a maximum of 5 people within your organisation.
- Corporate License: Allows the product to be shared among all employees of your organisation regardless of their geographical location.
All our reports are typically be emailed to you as an attachment.
To order any available report you need to register on our website. The payment can be made either through CCAvenue or PayPal payments gateways which accept all international cards.
We extend our support to 6 months post sale. A post sale customization is also provided to cover your unmet needs in the report.
Request Customization
We offer complimentary customization of up to 15% with every purchase. To share your customization requirements, feel free to email us at info@strategymrc.com or call us on +1-301-202-5929. .
Please Note: Customization within the 15% threshold is entirely free of charge. If your request exceeds this limit, we will conduct a feasibility assessment. Following that, a detailed quote and timeline will be provided.
WHY CHOOSE US ?

Assured Quality
Best in class reports with high standard of research integrity

24X7 Research Support
Continuous support to ensure the best customer experience.

Free Customization
Adding more values to your product of interest.

Safe & Secure Access
Providing a secured environment for all online transactions.

Trusted by 600+ Brands
Serving the most reputed brands across the world.