
Pick And Place Machines Market
Pick and Place Machines Market Forecasts to 2032 - Global Analysis By Type (Manual, Semi-automatic and Automatic), Capacity, Technology, Distribution Channel, Application and By Geography

|
Years Covered |
2024-2032 |
|
Estimated Year Value (2025) |
US $3.0 BN |
|
Projected Year Value (2032) |
US $4.6 BN |
|
CAGR (2025-2032) |
6.4% |
|
Regions Covered |
North America, Europe, Asia Pacific, South America, and Middle East & Africa |
|
Countries Covered |
US, Canada, Mexico, Germany, UK, Italy, France, Spain, Japan, China, India, Australia, New Zealand, South Korea, Rest of Asia Pacific, South America, Argentina, Brazil, Chile, Middle East & Africa, Saudi Arabia, UAE, Qatar, and South Africa |
|
Largest Market |
Asia Pacific |
|
Highest Growing Market |
North America |
According to Stratistics MRC, the Global Pick and Place Machines Market is accounted for $3.0 billion in 2025 and is expected to reach $4.6 billion by 2032 growing at a CAGR of 6.4% during the forecast period. Pick and place machines are automated systems used in manufacturing and assembly lines to lift, move, and accurately position components onto designated locations, such as printed circuit boards (PCBs). These machines use robotic arms, vision systems, and precision controls to handle small or delicate parts with speed and accuracy, improving productivity and reducing human error. Commonly used in electronics, automotive, and packaging industries, pick and place machines support surface-mount technology (SMT) by placing components like resistors, capacitors, and microchips onto PCBs. Their programmable nature allows them to adapt to different product configurations, making them essential for high-volume, high-precision production environments.
Market Dynamics:
Driver:
Rising Demand for Automation
The growing desire for automation is boosting the Pick and Place Machines Market by improving industrial efficiency, lowering labor costs, and increasing production speed. Pick and place machines are essential for fulfilling high-volume production demands as companies embrace automated solutions more and more to maintain uniformity and expedite operations. They are essential in industries including electronics, automotive, and packaging because of their accuracy and dependability. Increased market expansion and technological breakthroughs in pick and place systems are fueled by this rising reliance on automation.
Restraint:
High Initial Investment Costs
High initial investment costs stymie the growth of the Pick and Place Machines Market, particularly among small and medium-sized businesses. The cost of purchasing, installing, and integrating this equipment with current systems is high. Potential adopters are frequently discouraged by the cost, which slows market growth. Widespread adoption across a range of industrial industries is also constrained by worries about return on investment and lengthy payback times, which deter businesses from upgrading to automated solutions.
Opportunity:
Growth of the Electronics Industry
The growth of the electronics industry is significantly driving the Pick and Place Machines Market. As demand for compact, high-performance electronic devices increases, manufacturers rely on pick and place machines for precise, high-speed component placement. The proliferation of smartphones and consumer electronics boosts PCB assembly needs, prompting automation adoption. Additionally, advancements in miniaturized components require accurate placement, making pick and place machines essential for productivity, and quality, thereby accelerating market growth across global manufacturing sectors.
Threat:
Maintenance and Operational Complexity
The maintenance and operational complexity of pick and place machines poses a significant hindrance to market growth. These machines require specialized technical expertise for installation, calibration, and routine maintenance, increasing operational downtime and costs. Frequent servicing and part replacements can disrupt production workflows, particularly in small and mid-sized enterprises with limited resources. Such complexities discourage adoption, especially in industries seeking simplified, low-maintenance automation solutions, thereby restraining broader market expansion.
Covid-19 Impact
The COVID-19 pandemic disrupted the Pick and Place Machines Market by halting manufacturing operations, delaying supply chains, and reducing workforce availability. Travel restrictions and lockdowns led to project delays, particularly in automotive and electronics industries. However, the crisis also accelerated automation adoption to minimize human contact, indirectly creating long-term demand. Despite short-term setbacks, the market gradually recovered with increased investments in automated production and robotics for enhanced operational resilience.
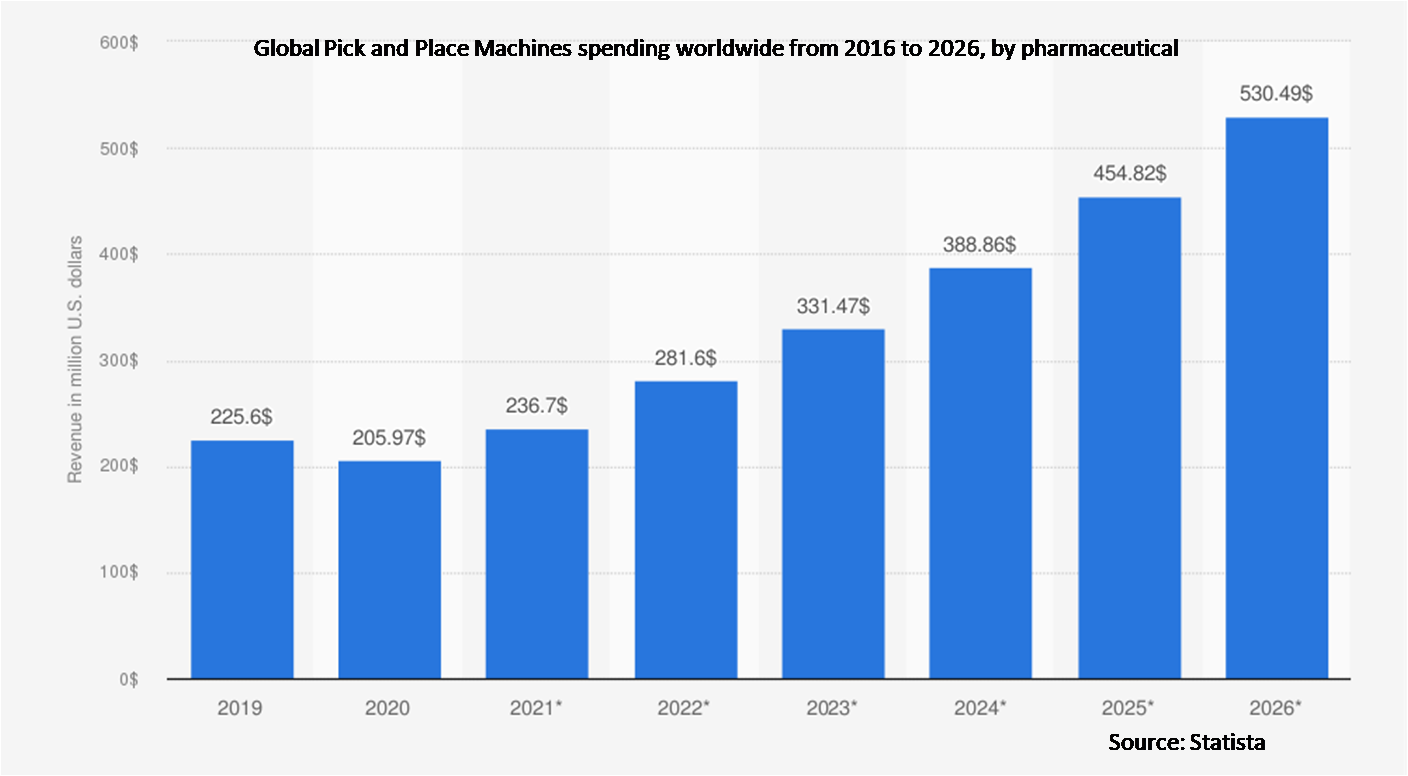
The pharmaceutical segment is expected to be the largest during the forecast period
The pharmaceutical segment is expected to account for the largest market share during the forecast period, due to rising demand for automation, precision, and hygiene in drug manufacturing and packaging. These machines enhance efficiency, reduce human error, and meet stringent regulatory standards. The need for fast, accurate handling of delicate products like vials, tablets, and syringes fuels adoption. Additionally, increased pharmaceutical R&D and production of personalized medicine further amplify the segment’s reliance on automated pick and place systems, boosting market expansion and innovation.
The vision-based segment is expected to have the highest CAGR during the forecast period
Over the forecast period, the vision-based segment is predicted to witness the highest growth rate, as it enhances precision, speed, and automation in industrial operations. With integrated cameras and image processing systems, these machines can accurately identify, locate, and place components, reducing human error and increasing throughput. This capability is particularly valuable in electronics, pharmaceuticals, and food packaging industries. The growing demand for smart manufacturing and Industry 4.0 solutions further boosts the adoption of vision-based systems, contributing significantly to market growth and technological advancement.
Region with largest share:
During the forecast period, the Asia Pacific region is expected to hold the largest market share due to rapid industrial automation and expansion of electronics manufacturing hubs in countries like China, Japan, South Korea, and India. Rising demand for consumer electronics, coupled with supportive government initiatives for smart manufacturing, is boosting market adoption. Additionally, the region's cost-effective labor and availability of raw materials are encouraging global manufacturers to set up production facilities, further accelerating the demand for pick and place machines.
Region with highest CAGR:
Over the forecast period, the North America region is anticipated to exhibit the highest CAGR, owing to rising automation in manufacturing and electronics sectors. The region's advanced technological infrastructure and demand for high-speed, precision assembly are driving adoption. Additionally, the surge in electronics production and automotive innovation fuels market expansion. Government support for smart factories and Industry 4.0 initiatives further boosts demand. These factors collectively create a robust environment for the growth and integration of pick and place machines across North America.

Key players in the market
Some of the key players profiled in the Pick and Place Machines Market include Fuji Corporation, Yamaha Motor Co., Ltd., Juki Corporation, Panasonic Corporation, ASM Assembly Systems GmbH & Co. KG, Mycronic AB, Hanwha Precision Machinery, Nordson Corporation, Essemtec AG, Europlacer Industries, Neoden Technology Co., Ltd., Evest Corporation, Autotronik-SMT GmbH, Shenzhen Glichn Technology Co., Ltd., DDM Novastar Inc., Manncorp, Apex Factory Automation, Mirae Corporation and i-Pulse Inc.
Key Developments:
In January 2025, Panasonic unveiled an innovative new energy efficient approach to heating, ventilation, and air conditioning (HVAC) that uses significantly less energy than conventional technologies.
In December 2024, Panasonic announced the launch of its BalancedHome Elite and Elite Plus Series of Energy Recovery Ventilators (ERV). Available in top and side port configurations and compliant with major building codes, the new BalancedHome series ERVs are versatile and efficient, giving builders the flexibility to choose between eight different models with four different CFM levels.
In November 2024, Panasonic and Arm announced a strategic partnership aimed at standardizing automotive architecture for Software-Defined Vehicles (SDVs).
Types Covered:
• Manual
• Semi-automatic
• Automatic
Capacities Covered:
• Upto 10,000 CPH
• 10,000-20,000 CPH
• Above 20,000 CPH
Technologies Covered:
• Vision based
• Force based
• Laser based
• Hybrid
Distribution Channels Covered:
• Direct
• Indirect
Applications Covered:
• Consumer electronics
• Automotive
• Packaging industry
• Pharmaceutical
• Logistics
• Other Applications
Regions Covered:
• North America
o US
o Canada
o Mexico
• Europe
o Germany
o UK
o Italy
o France
o Spain
o Rest of Europe
• Asia Pacific
o Japan
o China
o India
o Australia
o New Zealand
o South Korea
o Rest of Asia Pacific
• South America
o Argentina
o Brazil
o Chile
o Rest of South America
• Middle East & Africa
o Saudi Arabia
o UAE
o Qatar
o South Africa
o Rest of Middle East & Africa
What our report offers:
- Market share assessments for the regional and country-level segments
- Strategic recommendations for the new entrants
- Covers Market data for the years 2022, 2023, 2024, 2026, and 2030
- Market Trends (Drivers, Constraints, Opportunities, Threats, Challenges, Investment Opportunities, and recommendations)
- Strategic recommendations in key business segments based on the market estimations
- Competitive landscaping mapping the key common trends
- Company profiling with detailed strategies, financials, and recent developments
- Supply chain trends mapping the latest technological advancements
Free Customization Offerings:
All the customers of this report will be entitled to receive one of the following free customization options:
• Company Profiling
o Comprehensive profiling of additional market players (up to 3)
o SWOT Analysis of key players (up to 3)
• Regional Segmentation
o Market estimations, Forecasts and CAGR of any prominent country as per the client's interest (Note: Depends on feasibility check)
• Competitive Benchmarking
o Benchmarking of key players based on product portfolio, geographical presence, and strategic alliances
Table of Contents
1 Executive Summary
2 Preface
2.1 Abstract
2.2 Stake Holders
2.3 Research Scope
2.4 Research Methodology
2.4.1 Data Mining
2.4.2 Data Analysis
2.4.3 Data Validation
2.4.4 Research Approach
2.5 Research Sources
2.5.1 Primary Research Sources
2.5.2 Secondary Research Sources
2.5.3 Assumptions
3 Market Trend Analysis
3.1 Introduction
3.2 Drivers
3.3 Restraints
3.4 Opportunities
3.5 Threats
3.6 Technology Analysis
3.7 Application Analysis
3.8 Emerging Markets
3.9 Impact of Covid-19
4 Porters Five Force Analysis
4.1 Bargaining power of suppliers
4.2 Bargaining power of buyers
4.3 Threat of substitutes
4.4 Threat of new entrants
4.5 Competitive rivalry
5 Global Pick and Place Machines Market, By Type
5.1 Introduction
5.2 Manual
5.3 Semi-automatic
5.4 Automatic
6 Global Pick and Place Machines Market, By Capacity
6.1 Introduction
6.2 Upto 10,000 CPH
6.3 10,000-20,000 CPH
6.4 Above 20,000 CPH
7 Global Pick and Place Machines Market, By Technology
7.1 Introduction
7.2 Vision based
7.3 Force based
7.4 Laser based
7.5 Hybrid
8 Global Pick and Place Machines Market, By Distribution Channel
8.1 Introduction
8.2 Direct
8.3 Indirect
9 Global Pick and Place Machines Market, By Application
9.1 Introduction
9.2 Consumer electronics
9.3 Automotive
9.4 Packaging industry
9.5 Pharmaceutical
9.6 Logistics
9.7 Other Applications
10 Global Pick and Place Machines Market, By Geography
10.1 Introduction
10.2 North America
10.2.1 US
10.2.2 Canada
10.2.3 Mexico
10.3 Europe
10.3.1 Germany
10.3.2 UK
10.3.3 Italy
10.3.4 France
10.3.5 Spain
10.3.6 Rest of Europe
10.4 Asia Pacific
10.4.1 Japan
10.4.2 China
10.4.3 India
10.4.4 Australia
10.4.5 New Zealand
10.4.6 South Korea
10.4.7 Rest of Asia Pacific
10.5 South America
10.5.1 Argentina
10.5.2 Brazil
10.5.3 Chile
10.5.4 Rest of South America
10.6 Middle East & Africa
10.6.1 Saudi Arabia
10.6.2 UAE
10.6.3 Qatar
10.6.4 South Africa
10.6.5 Rest of Middle East & Africa
11 Key Developments
11.1 Agreements, Partnerships, Collaborations and Joint Ventures
11.2 Acquisitions & Mergers
11.3 New Product Launch
11.4 Expansions
11.5 Other Key Strategies
12 Company Profiling
12.1 Fuji Corporation
12.2 Yamaha Motor Co., Ltd.
12.3 Juki Corporation
12.4 Panasonic Corporation
12.5 ASM Assembly Systems GmbH & Co. KG
12.6 Mycronic AB
12.7 Hanwha Precision Machinery
12.8 Nordson Corporation
12.9 Essemtec AG
12.10 Europlacer Industries
12.11 Neoden Technology Co., Ltd.
12.12 Evest Corporation
12.13 Autotronik-SMT GmbH
12.14 Shenzhen Glichn Technology Co., Ltd.
12.15 DDM Novastar Inc.
12.16 Manncorp
12.17 Apex Factory Automation
12.18 Mirae Corporation
12.19 i-Pulse Inc.
List of Tables
1 Global Pick and Place Machines Market Outlook, By Region (2024-2032) ($MN)
2 Global Pick and Place Machines Market Outlook, By Type (2024-2032) ($MN)
3 Global Pick and Place Machines Market Outlook, By Manual (2024-2032) ($MN)
4 Global Pick and Place Machines Market Outlook, By Semi-automatic (2024-2032) ($MN)
5 Global Pick and Place Machines Market Outlook, By Automatic (2024-2032) ($MN)
6 Global Pick and Place Machines Market Outlook, By Capacity (2024-2032) ($MN)
7 Global Pick and Place Machines Market Outlook, By Upto 10,000 CPH (2024-2032) ($MN)
8 Global Pick and Place Machines Market Outlook, By 10,000-20,000 CPH (2024-2032) ($MN)
9 Global Pick and Place Machines Market Outlook, By Above 20,000 CPH (2024-2032) ($MN)
10 Global Pick and Place Machines Market Outlook, By Technology (2024-2032) ($MN)
11 Global Pick and Place Machines Market Outlook, By Vision based (2024-2032) ($MN)
12 Global Pick and Place Machines Market Outlook, By Force based (2024-2032) ($MN)
13 Global Pick and Place Machines Market Outlook, By Laser based (2024-2032) ($MN)
14 Global Pick and Place Machines Market Outlook, By Hybrid (2024-2032) ($MN)
15 Global Pick and Place Machines Market Outlook, By Distribution Channel (2024-2032) ($MN)
16 Global Pick and Place Machines Market Outlook, By Direct (2024-2032) ($MN)
17 Global Pick and Place Machines Market Outlook, By Indirect (2024-2032) ($MN)
18 Global Pick and Place Machines Market Outlook, By Application (2024-2032) ($MN)
19 Global Pick and Place Machines Market Outlook, By Consumer electronics (2024-2032) ($MN)
20 Global Pick and Place Machines Market Outlook, By Automotive (2024-2032) ($MN)
21 Global Pick and Place Machines Market Outlook, By Packaging industry (2024-2032) ($MN)
22 Global Pick and Place Machines Market Outlook, By Pharmaceutical (2024-2032) ($MN)
23 Global Pick and Place Machines Market Outlook, By Logistics (2024-2032) ($MN)
24 Global Pick and Place Machines Market Outlook, By Other Applications (2024-2032) ($MN)
25 North America Pick and Place Machines Market Outlook, By Country (2024-2032) ($MN)
26 North America Pick and Place Machines Market Outlook, By Type (2024-2032) ($MN)
27 North America Pick and Place Machines Market Outlook, By Manual (2024-2032) ($MN)
28 North America Pick and Place Machines Market Outlook, By Semi-automatic (2024-2032) ($MN)
29 North America Pick and Place Machines Market Outlook, By Automatic (2024-2032) ($MN)
30 North America Pick and Place Machines Market Outlook, By Capacity (2024-2032) ($MN)
31 North America Pick and Place Machines Market Outlook, By Upto 10,000 CPH (2024-2032) ($MN)
32 North America Pick and Place Machines Market Outlook, By 10,000-20,000 CPH (2024-2032) ($MN)
33 North America Pick and Place Machines Market Outlook, By Above 20,000 CPH (2024-2032) ($MN)
34 North America Pick and Place Machines Market Outlook, By Technology (2024-2032) ($MN)
35 North America Pick and Place Machines Market Outlook, By Vision based (2024-2032) ($MN)
36 North America Pick and Place Machines Market Outlook, By Force based (2024-2032) ($MN)
37 North America Pick and Place Machines Market Outlook, By Laser based (2024-2032) ($MN)
38 North America Pick and Place Machines Market Outlook, By Hybrid (2024-2032) ($MN)
39 North America Pick and Place Machines Market Outlook, By Distribution Channel (2024-2032) ($MN)
40 North America Pick and Place Machines Market Outlook, By Direct (2024-2032) ($MN)
41 North America Pick and Place Machines Market Outlook, By Indirect (2024-2032) ($MN)
42 North America Pick and Place Machines Market Outlook, By Application (2024-2032) ($MN)
43 North America Pick and Place Machines Market Outlook, By Consumer electronics (2024-2032) ($MN)
44 North America Pick and Place Machines Market Outlook, By Automotive (2024-2032) ($MN)
45 North America Pick and Place Machines Market Outlook, By Packaging industry (2024-2032) ($MN)
46 North America Pick and Place Machines Market Outlook, By Pharmaceutical (2024-2032) ($MN)
47 North America Pick and Place Machines Market Outlook, By Logistics (2024-2032) ($MN)
48 North America Pick and Place Machines Market Outlook, By Other Applications (2024-2032) ($MN)
49 Europe Pick and Place Machines Market Outlook, By Country (2024-2032) ($MN)
50 Europe Pick and Place Machines Market Outlook, By Type (2024-2032) ($MN)
51 Europe Pick and Place Machines Market Outlook, By Manual (2024-2032) ($MN)
52 Europe Pick and Place Machines Market Outlook, By Semi-automatic (2024-2032) ($MN)
53 Europe Pick and Place Machines Market Outlook, By Automatic (2024-2032) ($MN)
54 Europe Pick and Place Machines Market Outlook, By Capacity (2024-2032) ($MN)
55 Europe Pick and Place Machines Market Outlook, By Upto 10,000 CPH (2024-2032) ($MN)
56 Europe Pick and Place Machines Market Outlook, By 10,000-20,000 CPH (2024-2032) ($MN)
57 Europe Pick and Place Machines Market Outlook, By Above 20,000 CPH (2024-2032) ($MN)
58 Europe Pick and Place Machines Market Outlook, By Technology (2024-2032) ($MN)
59 Europe Pick and Place Machines Market Outlook, By Vision based (2024-2032) ($MN)
60 Europe Pick and Place Machines Market Outlook, By Force based (2024-2032) ($MN)
61 Europe Pick and Place Machines Market Outlook, By Laser based (2024-2032) ($MN)
62 Europe Pick and Place Machines Market Outlook, By Hybrid (2024-2032) ($MN)
63 Europe Pick and Place Machines Market Outlook, By Distribution Channel (2024-2032) ($MN)
64 Europe Pick and Place Machines Market Outlook, By Direct (2024-2032) ($MN)
65 Europe Pick and Place Machines Market Outlook, By Indirect (2024-2032) ($MN)
66 Europe Pick and Place Machines Market Outlook, By Application (2024-2032) ($MN)
67 Europe Pick and Place Machines Market Outlook, By Consumer electronics (2024-2032) ($MN)
68 Europe Pick and Place Machines Market Outlook, By Automotive (2024-2032) ($MN)
69 Europe Pick and Place Machines Market Outlook, By Packaging industry (2024-2032) ($MN)
70 Europe Pick and Place Machines Market Outlook, By Pharmaceutical (2024-2032) ($MN)
71 Europe Pick and Place Machines Market Outlook, By Logistics (2024-2032) ($MN)
72 Europe Pick and Place Machines Market Outlook, By Other Applications (2024-2032) ($MN)
73 Asia Pacific Pick and Place Machines Market Outlook, By Country (2024-2032) ($MN)
74 Asia Pacific Pick and Place Machines Market Outlook, By Type (2024-2032) ($MN)
75 Asia Pacific Pick and Place Machines Market Outlook, By Manual (2024-2032) ($MN)
76 Asia Pacific Pick and Place Machines Market Outlook, By Semi-automatic (2024-2032) ($MN)
77 Asia Pacific Pick and Place Machines Market Outlook, By Automatic (2024-2032) ($MN)
78 Asia Pacific Pick and Place Machines Market Outlook, By Capacity (2024-2032) ($MN)
79 Asia Pacific Pick and Place Machines Market Outlook, By Upto 10,000 CPH (2024-2032) ($MN)
80 Asia Pacific Pick and Place Machines Market Outlook, By 10,000-20,000 CPH (2024-2032) ($MN)
81 Asia Pacific Pick and Place Machines Market Outlook, By Above 20,000 CPH (2024-2032) ($MN)
82 Asia Pacific Pick and Place Machines Market Outlook, By Technology (2024-2032) ($MN)
83 Asia Pacific Pick and Place Machines Market Outlook, By Vision based (2024-2032) ($MN)
84 Asia Pacific Pick and Place Machines Market Outlook, By Force based (2024-2032) ($MN)
85 Asia Pacific Pick and Place Machines Market Outlook, By Laser based (2024-2032) ($MN)
86 Asia Pacific Pick and Place Machines Market Outlook, By Hybrid (2024-2032) ($MN)
87 Asia Pacific Pick and Place Machines Market Outlook, By Distribution Channel (2024-2032) ($MN)
88 Asia Pacific Pick and Place Machines Market Outlook, By Direct (2024-2032) ($MN)
89 Asia Pacific Pick and Place Machines Market Outlook, By Indirect (2024-2032) ($MN)
90 Asia Pacific Pick and Place Machines Market Outlook, By Application (2024-2032) ($MN)
91 Asia Pacific Pick and Place Machines Market Outlook, By Consumer electronics (2024-2032) ($MN)
92 Asia Pacific Pick and Place Machines Market Outlook, By Automotive (2024-2032) ($MN)
93 Asia Pacific Pick and Place Machines Market Outlook, By Packaging industry (2024-2032) ($MN)
94 Asia Pacific Pick and Place Machines Market Outlook, By Pharmaceutical (2024-2032) ($MN)
95 Asia Pacific Pick and Place Machines Market Outlook, By Logistics (2024-2032) ($MN)
96 Asia Pacific Pick and Place Machines Market Outlook, By Other Applications (2024-2032) ($MN)
97 South America Pick and Place Machines Market Outlook, By Country (2024-2032) ($MN)
98 South America Pick and Place Machines Market Outlook, By Type (2024-2032) ($MN)
99 South America Pick and Place Machines Market Outlook, By Manual (2024-2032) ($MN)
100 South America Pick and Place Machines Market Outlook, By Semi-automatic (2024-2032) ($MN)
101 South America Pick and Place Machines Market Outlook, By Automatic (2024-2032) ($MN)
102 South America Pick and Place Machines Market Outlook, By Capacity (2024-2032) ($MN)
103 South America Pick and Place Machines Market Outlook, By Upto 10,000 CPH (2024-2032) ($MN)
104 South America Pick and Place Machines Market Outlook, By 10,000-20,000 CPH (2024-2032) ($MN)
105 South America Pick and Place Machines Market Outlook, By Above 20,000 CPH (2024-2032) ($MN)
106 South America Pick and Place Machines Market Outlook, By Technology (2024-2032) ($MN)
107 South America Pick and Place Machines Market Outlook, By Vision based (2024-2032) ($MN)
108 South America Pick and Place Machines Market Outlook, By Force based (2024-2032) ($MN)
109 South America Pick and Place Machines Market Outlook, By Laser based (2024-2032) ($MN)
110 South America Pick and Place Machines Market Outlook, By Hybrid (2024-2032) ($MN)
111 South America Pick and Place Machines Market Outlook, By Distribution Channel (2024-2032) ($MN)
112 South America Pick and Place Machines Market Outlook, By Direct (2024-2032) ($MN)
113 South America Pick and Place Machines Market Outlook, By Indirect (2024-2032) ($MN)
114 South America Pick and Place Machines Market Outlook, By Application (2024-2032) ($MN)
115 South America Pick and Place Machines Market Outlook, By Consumer electronics (2024-2032) ($MN)
116 South America Pick and Place Machines Market Outlook, By Automotive (2024-2032) ($MN)
117 South America Pick and Place Machines Market Outlook, By Packaging industry (2024-2032) ($MN)
118 South America Pick and Place Machines Market Outlook, By Pharmaceutical (2024-2032) ($MN)
119 South America Pick and Place Machines Market Outlook, By Logistics (2024-2032) ($MN)
120 South America Pick and Place Machines Market Outlook, By Other Applications (2024-2032) ($MN)
121 Middle East & Africa Pick and Place Machines Market Outlook, By Country (2024-2032) ($MN)
122 Middle East & Africa Pick and Place Machines Market Outlook, By Type (2024-2032) ($MN)
123 Middle East & Africa Pick and Place Machines Market Outlook, By Manual (2024-2032) ($MN)
124 Middle East & Africa Pick and Place Machines Market Outlook, By Semi-automatic (2024-2032) ($MN)
125 Middle East & Africa Pick and Place Machines Market Outlook, By Automatic (2024-2032) ($MN)
126 Middle East & Africa Pick and Place Machines Market Outlook, By Capacity (2024-2032) ($MN)
127 Middle East & Africa Pick and Place Machines Market Outlook, By Upto 10,000 CPH (2024-2032) ($MN)
128 Middle East & Africa Pick and Place Machines Market Outlook, By 10,000-20,000 CPH (2024-2032) ($MN)
129 Middle East & Africa Pick and Place Machines Market Outlook, By Above 20,000 CPH (2024-2032) ($MN)
130 Middle East & Africa Pick and Place Machines Market Outlook, By Technology (2024-2032) ($MN)
131 Middle East & Africa Pick and Place Machines Market Outlook, By Vision based (2024-2032) ($MN)
132 Middle East & Africa Pick and Place Machines Market Outlook, By Force based (2024-2032) ($MN)
133 Middle East & Africa Pick and Place Machines Market Outlook, By Laser based (2024-2032) ($MN)
134 Middle East & Africa Pick and Place Machines Market Outlook, By Hybrid (2024-2032) ($MN)
135 Middle East & Africa Pick and Place Machines Market Outlook, By Distribution Channel (2024-2032) ($MN)
136 Middle East & Africa Pick and Place Machines Market Outlook, By Direct (2024-2032) ($MN)
137 Middle East & Africa Pick and Place Machines Market Outlook, By Indirect (2024-2032) ($MN)
138 Middle East & Africa Pick and Place Machines Market Outlook, By Application (2024-2032) ($MN)
139 Middle East & Africa Pick and Place Machines Market Outlook, By Consumer electronics (2024-2032) ($MN)
140 Middle East & Africa Pick and Place Machines Market Outlook, By Automotive (2024-2032) ($MN)
141 Middle East & Africa Pick and Place Machines Market Outlook, By Packaging industry (2024-2032) ($MN)
142 Middle East & Africa Pick and Place Machines Market Outlook, By Pharmaceutical (2024-2032) ($MN)
143 Middle East & Africa Pick and Place Machines Market Outlook, By Logistics (2024-2032) ($MN)
144 Middle East & Africa Pick and Place Machines Market Outlook, By Other Applications (2024-2032) ($MN)
List of Figures
RESEARCH METHODOLOGY

We at ‘Stratistics’ opt for an extensive research approach which involves data mining, data validation, and data analysis. The various research sources include in-house repository, secondary research, competitor’s sources, social media research, client internal data, and primary research.
Our team of analysts prefers the most reliable and authenticated data sources in order to perform the comprehensive literature search. With access to most of the authenticated data bases our team highly considers the best mix of information through various sources to obtain extensive and accurate analysis.
Each report takes an average time of a month and a team of 4 industry analysts. The time may vary depending on the scope and data availability of the desired market report. The various parameters used in the market assessment are standardized in order to enhance the data accuracy.
Data Mining
The data is collected from several authenticated, reliable, paid and unpaid sources and is filtered depending on the scope & objective of the research. Our reports repository acts as an added advantage in this procedure. Data gathering from the raw material suppliers, distributors and the manufacturers is performed on a regular basis, this helps in the comprehensive understanding of the products value chain. Apart from the above mentioned sources the data is also collected from the industry consultants to ensure the objective of the study is in the right direction.
Market trends such as technological advancements, regulatory affairs, market dynamics (Drivers, Restraints, Opportunities and Challenges) are obtained from scientific journals, market related national & international associations and organizations.
Data Analysis
From the data that is collected depending on the scope & objective of the research the data is subjected for the analysis. The critical steps that we follow for the data analysis include:
- Product Lifecycle Analysis
- Competitor analysis
- Risk analysis
- Porters Analysis
- PESTEL Analysis
- SWOT Analysis
The data engineering is performed by the core industry experts considering both the Marketing Mix Modeling and the Demand Forecasting. The marketing mix modeling makes use of multiple-regression techniques to predict the optimal mix of marketing variables. Regression factor is based on a number of variables and how they relate to an outcome such as sales or profits.
Data Validation
The data validation is performed by the exhaustive primary research from the expert interviews. This includes telephonic interviews, focus groups, face to face interviews, and questionnaires to validate our research from all aspects. The industry experts we approach come from the leading firms, involved in the supply chain ranging from the suppliers, distributors to the manufacturers and consumers so as to ensure an unbiased analysis.
We are in touch with more than 15,000 industry experts with the right mix of consultants, CEO's, presidents, vice presidents, managers, experts from both supply side and demand side, executives and so on.
The data validation involves the primary research from the industry experts belonging to:
- Leading Companies
- Suppliers & Distributors
- Manufacturers
- Consumers
- Industry/Strategic Consultants
Apart from the data validation the primary research also helps in performing the fill gap research, i.e. providing solutions for the unmet needs of the research which helps in enhancing the reports quality.
For more details about research methodology, kindly write to us at info@strategymrc.com
Frequently Asked Questions
In case of any queries regarding this report, you can contact the customer service by filing the “Inquiry Before Buy” form available on the right hand side. You may also contact us through email: info@strategymrc.com or phone: +1-301-202-5929
Yes, the samples are available for all the published reports. You can request them by filling the “Request Sample” option available in this page.
Yes, you can request a sample with your specific requirements. All the customized samples will be provided as per the requirement with the real data masked.
All our reports are available in Digital PDF format. In case if you require them in any other formats, such as PPT, Excel etc you can submit a request through “Inquiry Before Buy” form available on the right hand side. You may also contact us through email: info@strategymrc.com or phone: +1-301-202-5929
We offer a free 15% customization with every purchase. This requirement can be fulfilled for both pre and post sale. You may send your customization requirements through email at info@strategymrc.com or call us on +1-301-202-5929.
We have 3 different licensing options available in electronic format.
- Single User Licence: Allows one person, typically the buyer, to have access to the ordered product. The ordered product cannot be distributed to anyone else.
- 2-5 User Licence: Allows the ordered product to be shared among a maximum of 5 people within your organisation.
- Corporate License: Allows the product to be shared among all employees of your organisation regardless of their geographical location.
All our reports are typically be emailed to you as an attachment.
To order any available report you need to register on our website. The payment can be made either through CCAvenue or PayPal payments gateways which accept all international cards.
We extend our support to 6 months post sale. A post sale customization is also provided to cover your unmet needs in the report.
Request Customization
We offer complimentary customization of up to 15% with every purchase. To share your customization requirements, feel free to email us at info@strategymrc.com or call us on +1-301-202-5929. .
Please Note: Customization within the 15% threshold is entirely free of charge. If your request exceeds this limit, we will conduct a feasibility assessment. Following that, a detailed quote and timeline will be provided.
WHY CHOOSE US ?

Assured Quality
Best in class reports with high standard of research integrity

24X7 Research Support
Continuous support to ensure the best customer experience.

Free Customization
Adding more values to your product of interest.

Safe & Secure Access
Providing a secured environment for all online transactions.

Trusted by 600+ Brands
Serving the most reputed brands across the world.