
Positive Displacement Pumps Market
Positive Displacement Pumps Market Forecasts to 2028 – Global Analysis By Capacity (Small, Medium, High), Product Type (Reciprocating, Rotary), Application, and By Geography

|
Years Covered |
2020-2028 |
|
Estimated Year Value (2021) |
US $2,709.39 BN |
|
Projected Year Value (2028) |
US $4,322.31 BN |
|
CAGR (2021 - 2028) |
6.9% |
|
Regions Covered |
North America, Europe, Asia Pacific, South America, and Middle East & Africa |
|
Countries Covered |
US, Canada, Mexico, Germany, UK, Italy, France, Spain, Japan, China, India, Australia, New Zealand, South Korea, Rest of Asia Pacific, South America, Argentina, Brazil, Chile, Middle East & Africa, Saudi Arabia, UAE, Qatar, and South Africa |
|
Largest Market |
Asia Pacific |
|
Fastest Growing Market |
North America |
According to Stratistics MRC, the Global Positive Displacement Pumps Market is accounted for $2,709.39 billion in 2021 and is expected to reach $4,322.31 billion by 2028 growing at a CAGR of 6.9% during the forecast period. A positive displacement pump moves a fluid by repeatedly enclosing a fixed volume with the assistance of valves or seals and moving it precisely through the system. These kinds of pumps have a high capability of high-pressure improvement from low operating suction pressures, where the flow rate is controlled based on speed variation and by recycling feed material.
The growing population, increasing water & wastewater activities and rapid industrialization in developing countries have resulted in the ever-growing demand for oil& gas, power, and food & beverage, thus augmenting pump market growth. According to UNICEF, four billion people, almost two-thirds of the world’s population experience severe water scarcity for at least one month each year. Over two billion people live in countries where water supply is inadequate. Half of the world’s population could be living in areas facing water scarcity by as early as 2025.
Market Dynamics:
Driver:
Increasing mining activities
Positive displacement pumps are widely integrated into different industry verticals because of their high operational efficiency and less frequent maintenance needs. These are additionally utilized altogether in various mining operations across the globe because of their ability to reduce abrasive wear & tear of its components by working at slow speeds. A PDP also offers significant energy savings by working with high effectiveness and are introduced for mine dewatering & pumping fluids with solid content. Moreover, economical operations, varying pressure output, reliable operations, and optimum displacement design are some of the factors propelling the adoption of these units in power generation stations.
Restraint:
Precise operation conditions coupled with need of additional equipment
The movement of pistons in a positive displacement pump often creates pulsations between the outlet and inlet ports of the body. These extreme pulsations are probably going to impart significant damage to local systems if they are not treated. Consequently, a pulsation dampener is needed in an oscillating PDP unit to treat the oscillations and mitigate risks to other equipment. Also, the products require pressure relief or safety valves along with numerous other wear & tear prevention parts as it does not put restrictions on the pressure of the fluid. PD pumps are additionally susceptible to high speeds attributable to their complex mass balancing to solve vibrating issues.
Opportunity:
Implementation of advanced solutions
Several industry players are promptly expanding their focus on providing end-to-end pump monitoring to limit any risk of component failure. Different innovations are integrated to provide cost-effective solutions for observing temperature, vibration, flow rate, and fluid movement by installing tools like sensors, Wi-Fi, data analytics, advanced variable frequency drives, and Industrial Internet of Things (IIoT). Moreover, these innovative solutions broadly help to perform predictive analysis and precisely evaluate the equipment’s life cycle, and performance indication and preclude the facility from unplanned downtime.
Threat:
Availability of centrifugal pumps
The high market share of centrifugal pumps is probably going to act as a challenge to the global positive displacement pumps market growth. Centrifugal pumps have a comparatively higher market share than the positive displacement pumps market globally. This is typical because performance characteristics combined with its extended scope of end-user applications make it a preferred choice over positive displacement pumps. Additionally, in terms of the product cost, centrifugal pumps are relatively inexpensive as compared to positive displacement pumps.
The reciprocating pump segment is expected to be the largest during the forecast period
The reciprocating pump segment is estimated to have a lucrative growth owing to its extensive features and a wide range of applications. The pump utilizes a plunger, piston, or diaphragm in continuous back-and-forth movement to provide high-pressure output with accurate metering of pump discharges. Reciprocating pumps are available in single-acting and double-acting system designs based on the number of discharges and suction per crankshaft revolution.
The chemicals and petrochemicals segment is expected to have the highest CAGR during the forecast period
The chemicals and petrochemicals segment is anticipated to witness the fastest CAGR growth during the forecast period owing to the constant requirement of various chemical products as raw materials to manufacture other goods along with the rising construction of different-sized chemical plants.
Region with highest share:
Asia Pacific is projected to hold the largest market share during the forecast period due to the presence of large domestic markets such as China, India, Indonesia, etc, and expanding hydrocarbon activities to suffice the expanding energy demand among various countries. Also, many manufacturers are establishing their production base in the Asia Pacific to take advantage of the regional markets.
Region with highest CAGR:
North America is projected to have the highest CAGR over the forecast period owing to the presence of a wide range of domestic manufacturing and processing industries along with huge water and wastewater management and power generation sectors. U.S. and Canada are the key countries with established power generation and chemical processing plants propelling the market in the region.

Key players in the market
Some of the key players profiled in the Positive Displacement Pumps Market include Alfa Laval, Xylem Inc., WILO SE, Tsurumi Pump, Ampco Pumps Company Inc., Sulzer AG, Ruhrpumpen Group, Pentair, Lakeside Equipment Corporation, KSB AG, ITT Inc., Grundfos, Flowserve Corporation, Ebara Corporation, Dover Corporation, Atlas Copco, The Weir Group plc and Blackmer.
Key Developments:
In Sep 2020, Blackmer launched its new MAGNES Series Sliding Vane Magnetic Drive Pumps. The pumps represent the latest advancement in seal-less magnetic drive technology. Blackmer MAGNES Series pumps incorporate innovative design features that provide a unique combination of flexibility, functionality, and reliability.
In November 2019, The Weir Group plc. announced the successful integration of their GEHO positive displacement pumps in SIMEC mining’s project in South Australia. The company’s GEHO units help to transport slurry at the rate of around 300 tons per hour through a pipeline to a steel producing facility.
Capacities Covered:
• Small Capacity
• Medium Capacity
• High Capacity
Product Types Covered:
• Reciprocating Pump
• Peristaltic Pumps
• Rotary Pump
Pump Characteristics Covered:
• Special Purpose Pumps
• Engineered Pumps
• Standard Pumps
Raw Materials Covered:
• Stainless Steel
• Polycarbonate
• Cast Iron
• Bronze
Applications Covered:
• Downstream
• Midstream
• Upstream
End Users Covered:
• Water & Wastewater
• Pulp & Paper
• Mining
• Oil & Gas
• Pharmaceutical
• Food & Beverage
• Power Generation
• Chemicals and Petrochemicals
• Automotive
• Other End Users
Regions Covered:
• North America
o US
o Canada
o Mexico
• Europe
o Germany
o UK
o Italy
o France
o Spain
o Rest of Europe
• Asia Pacific
o Japan
o China
o India
o Australia
o New Zealand
o South Korea
o Rest of Asia Pacific
• South America
o Argentina
o Brazil
o Chile
o Rest of South America
• Middle East & Africa
o Saudi Arabia
o UAE
o Qatar
o South Africa
o Rest of Middle East & Africa
What our report offers:
- Market share assessments for the regional and country-level segments
- Strategic recommendations for the new entrants
- Covers Market data for the years 2020, 2021, 2022, 2025, and 2028
- Market Trends (Drivers, Constraints, Opportunities, Threats, Challenges, Investment Opportunities, and recommendations)
- Strategic recommendations in key business segments based on the market estimations
- Competitive landscaping mapping the key common trends
- Company profiling with detailed strategies, financials, and recent developments
- Supply chain trends mapping the latest technological advancements
Free Customization Offerings:
All the customers of this report will be entitled to receive one of the following free customization options:
• Company Profiling
o Comprehensive profiling of additional market players (up to 3)
o SWOT Analysis of key players (up to 3)
• Regional Segmentation
o Market estimations, Forecasts and CAGR of any prominent country as per the client's interest (Note: Depends on feasibility check)
• Competitive Benchmarking
o Benchmarking of key players based on product portfolio, geographical presence, and strategic alliances
Table of Contents
1 Executive Summary
2 Preface
2.1 Abstract
2.2 Stake Holders
2.3 Research Scope
2.4 Research Methodology
2.4.1 Data Mining
2.4.2 Data Analysis
2.4.3 Data Validation
2.4.4 Research Approach
2.5 Research Sources
2.5.1 Primary Research Sources
2.5.2 Secondary Research Sources
2.5.3 Assumptions
3 Market Trend Analysis
3.1 Introduction
3.2 Drivers
3.3 Restraints
3.4 Opportunities
3.5 Threats
3.6 Product Analysis
3.7 Application Analysis
3.8 End User Analysis
3.9 Emerging Markets
3.10 Impact of Covid-19
4 Porters Five Force Analysis
4.1 Bargaining power of suppliers
4.2 Bargaining power of buyers
4.3 Threat of substitutes
4.4 Threat of new entrants
4.5 Competitive rivalry
5 Global Positive Displacement Pumps Market, By Capacity
5.1 Introduction
5.2 Small Capacity
5.3 Medium Capacity
5.4 High Capacity
6 Global Positive Displacement Pumps Market, By Product
6.1 Introduction
6.2 Reciprocating Pump
6.2.1 Piston/Plunger
6.2.2 Diaphragm
6.3 Peristaltic Pumps
6.4 Rotary Pump
6.4.1 Vane
6.4.2 Screw
6.4.3 Progressing Cavity (PC)
6.4.4 Lobe
6.4.5 Gear
7 Global Positive Displacement Pumps Market, By Pump Characteristics
7.1 Introduction
7.2 Special Purpose Pumps
7.3 Engineered Pumps
7.4 Standard Pumps
8 Global Positive Displacement Pumps Market, By Raw Material
8.1 Introduction
8.2 Stainless Steel
8.3 Polycarbonate
8.4 Cast Iron
8.5 Bronze
9 Global Positive Displacement Pumps Market, By Application
9.1 Introduction
9.2 Downstream
9.3 Midstream
9.4 Upstream
10 Global Positive Displacement Pumps Market, By End User
10.1 Introduction
10.2 Water & Wastewater
10.3 Pulp & Paper
10.4 Mining
10.5 Oil & Gas
10.6 Pharmaceutical
10.7 Food & Beverage
10.8 Power Generation
10.9 Chemicals and Petrochemicals
10.10 Automotive
10.11 Other End Users
10.11.1 Construction
10.11.2 Aerospace
11 Global Positive Displacement Pumps Market, By Geography
11.1 Introduction
11.2 North America
11.2.1 US
11.2.2 Canada
11.2.3 Mexico
11.3 Europe
11.3.1 Germany
11.3.2 UK
11.3.3 Italy
11.3.4 France
11.3.5 Spain
11.3.6 Rest of Europe
11.4 Asia Pacific
11.4.1 Japan
11.4.2 China
11.4.3 India
11.4.4 Australia
11.4.5 New Zealand
11.4.6 South Korea
11.4.7 Rest of Asia Pacific
11.5 South America
11.5.1 Argentina
11.5.2 Brazil
11.5.3 Chile
11.5.4 Rest of South America
11.6 Middle East & Africa
11.6.1 Saudi Arabia
11.6.2 UAE
11.6.3 Qatar
11.6.4 South Africa
11.6.5 Rest of Middle East & Africa
12 Key Developments
12.1 Agreements, Partnerships, Collaborations and Joint Ventures
12.2 Acquisitions & Mergers
12.3 New Product Launch
12.4 Expansions
12.5 Other Key Strategies
13 Company Profiling
13.1 Alfa Laval
13.2 Xylem Inc.
13.3 WILO SE
13.4 Tsurumi Pump
13.5 Ampco Pumps Company Inc.
13.6 Sulzer AG
13.7 Ruhrpumpen Group
13.8 Pentair
13.9 Lakeside Equipment Corporation
13.10 KSB AG
13.11 ITT Inc.
13.12 Grundfos
13.13 Flowserve Corporation
13.14 Ebara Corporation
13.15 Dover Corporation
13.16 Atlas Copco
13.17 The Weir Group plc.
13.18 Blackmer
List of Tables
1 Global Positive Displacement Pumps Market Outlook, By Region (2020-2028) ($MN)
2 Global Positive Displacement Pumps Market Outlook, By Capacity (2020-2028) ($MN)
3 Global Positive Displacement Pumps Market Outlook, By Small Capacity (2020-2028) ($MN)
4 Global Positive Displacement Pumps Market Outlook, By Medium Capacity (2020-2028) ($MN)
5 Global Positive Displacement Pumps Market Outlook, By High Capacity (2020-2028) ($MN)
6 Global Positive Displacement Pumps Market Outlook, By Product (2020-2028) ($MN)
7 Global Positive Displacement Pumps Market Outlook, By Reciprocating Pump (2020-2028) ($MN)
8 Global Positive Displacement Pumps Market Outlook, By Piston/Plunger (2020-2028) ($MN)
9 Global Positive Displacement Pumps Market Outlook, By Diaphragm (2020-2028) ($MN)
10 Global Positive Displacement Pumps Market Outlook, By Peristaltic Pumps (2020-2028) ($MN)
11 Global Positive Displacement Pumps Market Outlook, By Rotary Pump (2020-2028) ($MN)
12 Global Positive Displacement Pumps Market Outlook, By Vane (2020-2028) ($MN)
13 Global Positive Displacement Pumps Market Outlook, By Screw (2020-2028) ($MN)
14 Global Positive Displacement Pumps Market Outlook, By Progressing Cavity (PC) (2020-2028) ($MN)
15 Global Positive Displacement Pumps Market Outlook, By Lobe (2020-2028) ($MN)
16 Global Positive Displacement Pumps Market Outlook, By Gear (2020-2028) ($MN)
17 Global Positive Displacement Pumps Market Outlook, By Pump Characteristics (2020-2028) ($MN)
18 Global Positive Displacement Pumps Market Outlook, By Special Purpose Pumps (2020-2028) ($MN)
19 Global Positive Displacement Pumps Market Outlook, By Engineered Pumps (2020-2028) ($MN)
20 Global Positive Displacement Pumps Market Outlook, By Standard Pumps (2020-2028) ($MN)
21 Global Positive Displacement Pumps Market Outlook, By Raw Material (2020-2028) ($MN)
22 Global Positive Displacement Pumps Market Outlook, By Stainless Steel (2020-2028) ($MN)
23 Global Positive Displacement Pumps Market Outlook, By Polycarbonate (2020-2028) ($MN)
24 Global Positive Displacement Pumps Market Outlook, By Cast Iron (2020-2028) ($MN)
25 Global Positive Displacement Pumps Market Outlook, By Bronze (2020-2028) ($MN)
26 Global Positive Displacement Pumps Market Outlook, By Application (2020-2028) ($MN)
27 Global Positive Displacement Pumps Market Outlook, By Downstream (2020-2028) ($MN)
28 Global Positive Displacement Pumps Market Outlook, By Midstream (2020-2028) ($MN)
29 Global Positive Displacement Pumps Market Outlook, By Upstream (2020-2028) ($MN)
30 Global Positive Displacement Pumps Market Outlook, By End User (2020-2028) ($MN)
31 Global Positive Displacement Pumps Market Outlook, By Water & Wastewater (2020-2028) ($MN)
32 Global Positive Displacement Pumps Market Outlook, By Pulp & Paper (2020-2028) ($MN)
33 Global Positive Displacement Pumps Market Outlook, By Mining (2020-2028) ($MN)
34 Global Positive Displacement Pumps Market Outlook, By Oil & Gas (2020-2028) ($MN)
35 Global Positive Displacement Pumps Market Outlook, By Pharmaceutical (2020-2028) ($MN)
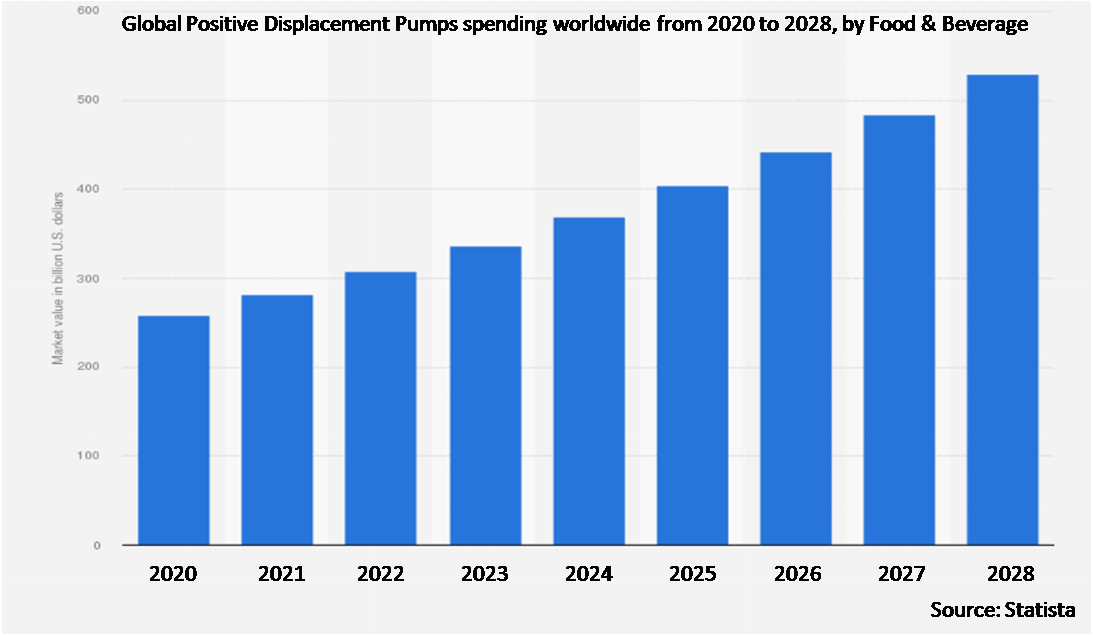
36 Global Positive Displacement Pumps Market Outlook, By Food & Beverage (2020-2028) ($MN)
37 Global Positive Displacement Pumps Market Outlook, By Power Generation (2020-2028) ($MN)
38 Global Positive Displacement Pumps Market Outlook, By Chemicals and Petrochemicals (2020-2028) ($MN)
39 Global Positive Displacement Pumps Market Outlook, By Automotive (2020-2028) ($MN)
40 Global Positive Displacement Pumps Market Outlook, By Other End Users (2020-2028) ($MN)
41 Global Positive Displacement Pumps Market Outlook, By Construction (2020-2028) ($MN)
42 Global Positive Displacement Pumps Market Outlook, By Aerospace (2020-2028) ($MN)
Note: Tables for North America, Europe, APAC, South America, and Middle East & Africa Regions are also represented in the same manner as above.
List of Figures
RESEARCH METHODOLOGY

We at ‘Stratistics’ opt for an extensive research approach which involves data mining, data validation, and data analysis. The various research sources include in-house repository, secondary research, competitor’s sources, social media research, client internal data, and primary research.
Our team of analysts prefers the most reliable and authenticated data sources in order to perform the comprehensive literature search. With access to most of the authenticated data bases our team highly considers the best mix of information through various sources to obtain extensive and accurate analysis.
Each report takes an average time of a month and a team of 4 industry analysts. The time may vary depending on the scope and data availability of the desired market report. The various parameters used in the market assessment are standardized in order to enhance the data accuracy.
Data Mining
The data is collected from several authenticated, reliable, paid and unpaid sources and is filtered depending on the scope & objective of the research. Our reports repository acts as an added advantage in this procedure. Data gathering from the raw material suppliers, distributors and the manufacturers is performed on a regular basis, this helps in the comprehensive understanding of the products value chain. Apart from the above mentioned sources the data is also collected from the industry consultants to ensure the objective of the study is in the right direction.
Market trends such as technological advancements, regulatory affairs, market dynamics (Drivers, Restraints, Opportunities and Challenges) are obtained from scientific journals, market related national & international associations and organizations.
Data Analysis
From the data that is collected depending on the scope & objective of the research the data is subjected for the analysis. The critical steps that we follow for the data analysis include:
- Product Lifecycle Analysis
- Competitor analysis
- Risk analysis
- Porters Analysis
- PESTEL Analysis
- SWOT Analysis
The data engineering is performed by the core industry experts considering both the Marketing Mix Modeling and the Demand Forecasting. The marketing mix modeling makes use of multiple-regression techniques to predict the optimal mix of marketing variables. Regression factor is based on a number of variables and how they relate to an outcome such as sales or profits.
Data Validation
The data validation is performed by the exhaustive primary research from the expert interviews. This includes telephonic interviews, focus groups, face to face interviews, and questionnaires to validate our research from all aspects. The industry experts we approach come from the leading firms, involved in the supply chain ranging from the suppliers, distributors to the manufacturers and consumers so as to ensure an unbiased analysis.
We are in touch with more than 15,000 industry experts with the right mix of consultants, CEO's, presidents, vice presidents, managers, experts from both supply side and demand side, executives and so on.
The data validation involves the primary research from the industry experts belonging to:
- Leading Companies
- Suppliers & Distributors
- Manufacturers
- Consumers
- Industry/Strategic Consultants
Apart from the data validation the primary research also helps in performing the fill gap research, i.e. providing solutions for the unmet needs of the research which helps in enhancing the reports quality.
For more details about research methodology, kindly write to us at info@strategymrc.com
Frequently Asked Questions
In case of any queries regarding this report, you can contact the customer service by filing the “Inquiry Before Buy” form available on the right hand side. You may also contact us through email: info@strategymrc.com or phone: +1-301-202-5929
Yes, the samples are available for all the published reports. You can request them by filling the “Request Sample” option available in this page.
Yes, you can request a sample with your specific requirements. All the customized samples will be provided as per the requirement with the real data masked.
All our reports are available in Digital PDF format. In case if you require them in any other formats, such as PPT, Excel etc you can submit a request through “Inquiry Before Buy” form available on the right hand side. You may also contact us through email: info@strategymrc.com or phone: +1-301-202-5929
We offer a free 15% customization with every purchase. This requirement can be fulfilled for both pre and post sale. You may send your customization requirements through email at info@strategymrc.com or call us on +1-301-202-5929.
We have 3 different licensing options available in electronic format.
- Single User Licence: Allows one person, typically the buyer, to have access to the ordered product. The ordered product cannot be distributed to anyone else.
- 2-5 User Licence: Allows the ordered product to be shared among a maximum of 5 people within your organisation.
- Corporate License: Allows the product to be shared among all employees of your organisation regardless of their geographical location.
All our reports are typically be emailed to you as an attachment.
To order any available report you need to register on our website. The payment can be made either through CCAvenue or PayPal payments gateways which accept all international cards.
We extend our support to 6 months post sale. A post sale customization is also provided to cover your unmet needs in the report.
Request Customization
We offer complimentary customization of up to 15% with every purchase. To share your customization requirements, feel free to email us at info@strategymrc.com or call us on +1-301-202-5929. .
Please Note: Customization within the 15% threshold is entirely free of charge. If your request exceeds this limit, we will conduct a feasibility assessment. Following that, a detailed quote and timeline will be provided.
WHY CHOOSE US ?

Assured Quality
Best in class reports with high standard of research integrity

24X7 Research Support
Continuous support to ensure the best customer experience.

Free Customization
Adding more values to your product of interest.

Safe & Secure Access
Providing a secured environment for all online transactions.

Trusted by 600+ Brands
Serving the most reputed brands across the world.