
Power To X Technology Market
Power-to-X Technology Market Forecasts to 2034 - Global Analysis By Type (Power-to-Hydrogen (PtH2), Power-to-Ammonia (PtA), Power-to-Methanol (PtM), Power-to-Synthetic Fuels (e-Fuels), Power-to-Gas (PtG), Power-to-Chemicals and Power-to-Heat Solutions), Component, Application, End User and By Geography

|
Years Covered |
2023-2034 |
|
Estimated Year Value (2026) |
US $0.8 BN |
|
Projected Year Value (2034) |
US $1.9 BN |
|
CAGR (2026- 2034) |
11.4% |
|
Regions Covered |
North America, Europe, Asia Pacific, South America, and Rest of the World (RoW) |
|
Countries Covered |
United States, Canada, Mexico, United Kingdom, Germany, France, Italy, Spain, Netherlands, Belgium, Sweden, Switzerland, Poland, Rest of Europe, China, Japan, India, South Korea, Australia, Indonesia, Thailand, Malaysia, Singapore, Vietnam, Rest of Asia Pacific, Brazil, Argentina, Colombia, Chile, Peru, Rest of South America, Saudi Arabia, United Arab Emirates, Qatar, Israel, Rest of Middle East, South Africa, Egypt, Morocco, and Rest of Africa. |
|
Largest Market |
North America |
|
Highest Growing Market |
Asia Pacific |
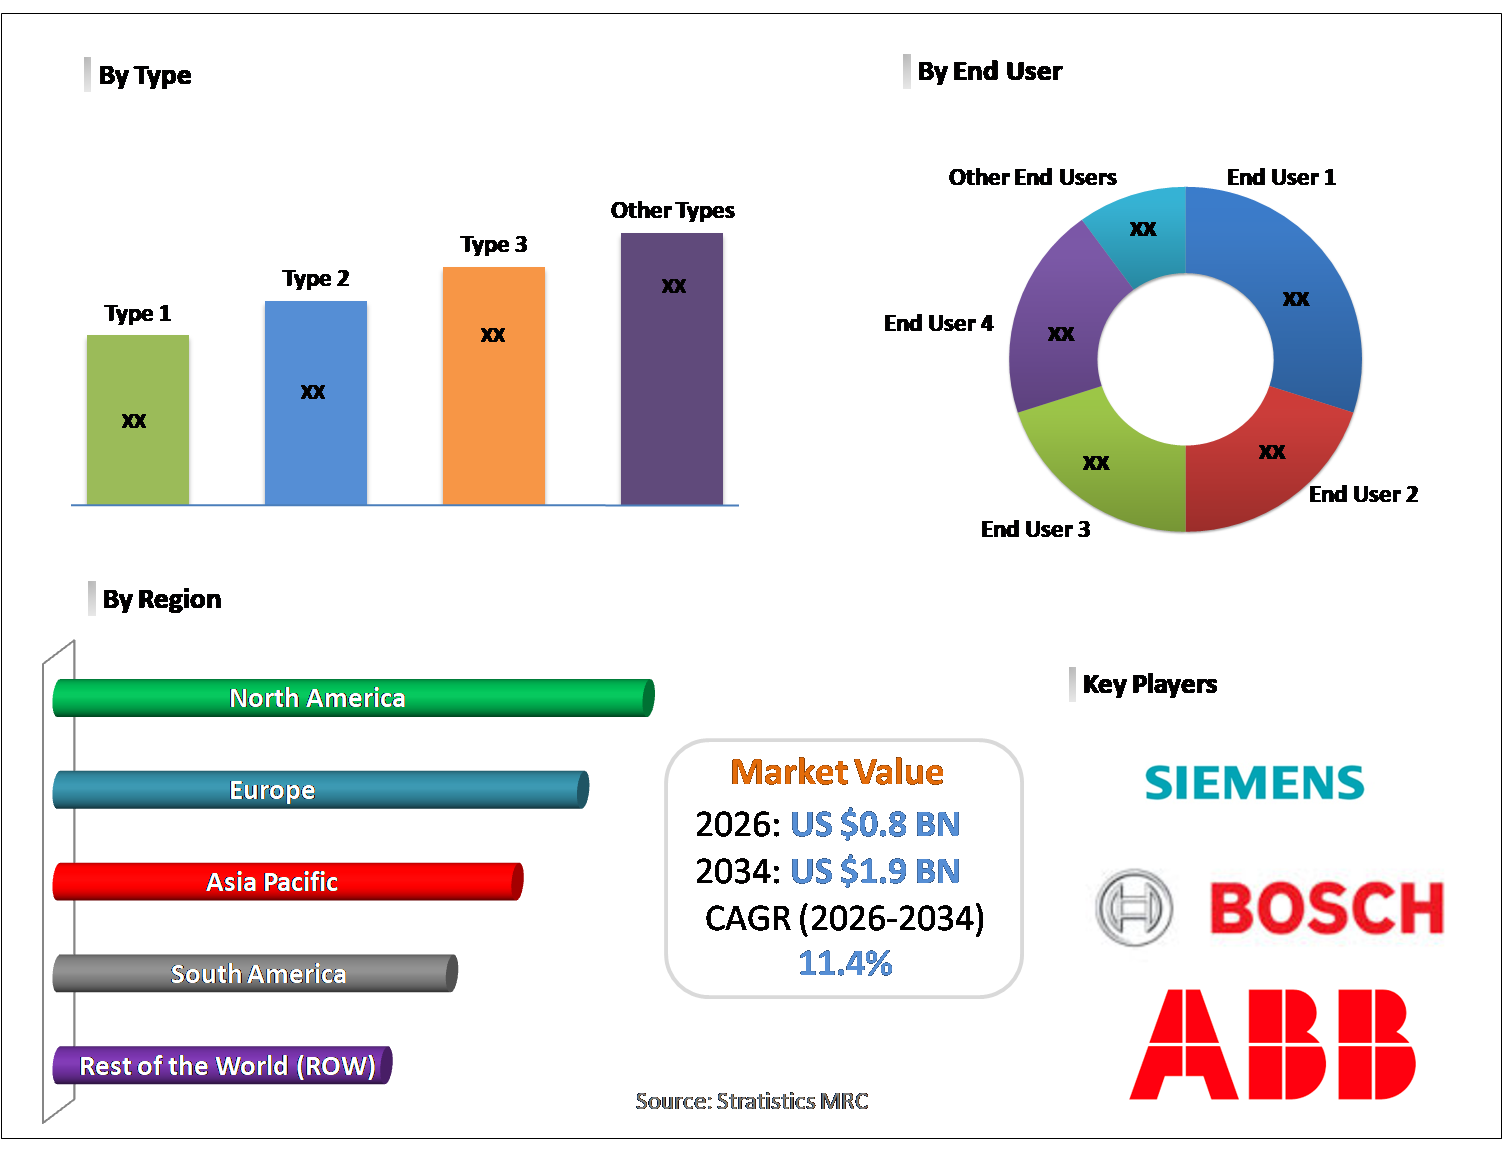
According to Stratistics MRC, the Global Power-to-X Technology Market is accounted for $0.8 billion in 2026 and is expected to reach $1.9 billion by 2034 growing at a CAGR of 11.4% during the forecast period. Power-to-X technology refers to converting surplus renewable electricity into other useful forms of energy or products. The “X” can represent fuels, chemicals, or heat. For example, excess wind or solar power can be transformed into hydrogen, synthetic gas, or liquid fuels. This process helps store energy, stabilize grids, and decarbonize industries that are hard to electrify. It creates flexible pathways for using renewable energy beyond direct electricity, making it a cornerstone for building sustainable and integrated energy systems worldwide.
Market Dynamics:
Driver:
Industrial sector decarbonization mandates
Stringent carbon reduction targets across heavy industries are significantly accelerating adoption of Power-to-X technologies. Steel, chemicals, and refining sectors are under regulatory pressure to lower Scope 1 and Scope 2 emissions. Consequently, green hydrogen and synthetic fuels are emerging as viable decarbonization pathways. Fueled by carbon pricing mechanisms and emissions trading systems, industries are reallocating capital toward clean conversion technologies. Moreover, corporate net-zero commitments reinforce long-term investment visibility. As regulatory intensity increases globally, industrial decarbonization mandates remain a primary growth driver for the Power-to-X Technology Market.
Restraint:
Electrolyzer capital intensity
High upfront investment requirements for electrolyzer infrastructure present a substantial market restraint. Capital expenditure includes system procurement, renewable power integration, compression, and storage facilities. As a result, project bankability often depends on subsidies or long-term offtake agreements. Additionally, fluctuating renewable electricity prices impact operational economics. Smaller developers face financing constraints due to technology risk perception. Therefore, despite long-term cost reduction potential, electrolyzer capital intensity continues to limit rapid scalability.
Opportunity:
Sustainable aviation fuel production
Expanding demand for sustainable aviation fuel (SAF) creates strong growth opportunities for Power-to-X platforms. Airlines are actively pursuing synthetic e-fuels to meet carbon neutrality goals. Consequently, power-to-liquid pathways leveraging green hydrogen and captured CO₂ are gaining strategic importance. Government blending mandates and SAF incentives further enhance commercial viability. Moreover, partnerships between energy producers and aviation stakeholders accelerate demonstration projects. As aviation decarbonization becomes urgent, SAF production represents a high-potential revenue stream.
Threat:
Battery energy storage competition
Battery energy storage systems pose a competitive threat, particularly in short-duration grid balancing applications. Lithium-ion technologies benefit from declining costs and established supply chains. Therefore, in certain use cases, batteries may offer more immediate economic returns. Additionally, policy incentives frequently prioritize battery-backed renewable integration. Power-to-X solutions typically require larger infrastructure commitments and longer development timelines. Consequently, battery storage competitiveness may slow adoption in selected energy conversion segments.
Covid-19 Impact:
The COVID-19 pandemic initially delayed large-scale Power-to-X investments due to capital expenditure reprioritization. Industrial slowdowns reduced immediate hydrogen demand across refining and transportation sectors. However, green recovery stimulus packages revitalized clean hydrogen strategies. Governments incorporated hydrogen roadmaps into long-term economic resilience plans. Furthermore, supply chain localization initiatives strengthened electrolyzer manufacturing capacity. As post-pandemic decarbonization momentum accelerated, Power-to-X projects regained strategic and financial traction.
The power-to-hydrogen (PtH2)segment is expected to be the largest during the forecast period
The power-to-hydrogen (PtH2) segment is expected to account for the largest market share during the forecast period. This pathway enables conversion of renewable electricity into green hydrogen for industrial and mobility applications. Consequently, PtH2 serves as the foundational platform for downstream Power-to-X derivatives. Strong policy backing for hydrogen infrastructure supports segment dominance. Moreover, large-scale pilot projects validate commercial feasibility. As hydrogen demand expands across sectors, PtH2 remains the leading revenue-generating segment.
The electrolyzerssegment is expected to have the highest CAGR during the forecast period
Over the forecast period, the electrolyzers segment is predicted to witness the highest growth rate. Continuous technological innovation in PEM, alkaline, and solid oxide electrolyzers enhances efficiency and scalability. Furthermore, manufacturing capacity expansions are driving gradual cost reductions. Strategic joint ventures between technology providers and energy companies accelerate deployment pipelines. As renewable capacity additions rise, electrolyzer demand strengthens proportionally. Therefore, electrolyzers represent the fastest-growing component within the Power-to-X Technology Market.
Region with largest share:
During the forecast period, the North America region is expected to hold the largest market share. Strong federal incentives and hydrogen tax credits support large-scale project development. In addition, established renewable infrastructure provides favorable integration conditions. Corporate decarbonization commitments across industrial clusters further stimulate demand. Presence of advanced technology developers strengthens innovation ecosystems. Consequently, North America maintains revenue leadership in the global Power-to-X landscape.
Region with highest CAGR:
Over the forecast period, the Asia Pacific region is anticipated to exhibit the highest CAGR. Rapid industrial expansion and rising energy demand drive hydrogen adoption strategies. Governments in Japan, South Korea, China, and Australia are investing heavily in hydrogen roadmaps. Moreover, export-oriented green ammonia and e-fuel projects enhance regional competitiveness. Strategic public-private collaborations accelerate infrastructure deployment. As energy transition policies intensify, Asia Pacific emerges as the fastest-growing regional market.

Key players in the market
Some of the key players in Power-to-X Technology Market include Siemens Energy AG, Thyssenkrupp AG, Nel ASA, ITM Power plc, Plug Power Inc., Air Liquide S.A., Linde plc, Mitsubishi Heavy Industries, Ltd., ENGIE SA, Ørsted A/S, TotalEnergies SE, Shell plc, Equinor ASA, Haldor Topsoe A/S, Uniper SE, Snam S.p.A., ABB Ltd., and Bosch Limited.
Key Developments:
In February 2026, Nel ASA announced the commissioning of its large-scale alkaline electrolyser facility in Europe, designed to support Power-to-Hydrogen projects and enable integration of renewable electricity into industrial energy systems.
In January 2026, Siemens Energy AG partnered with European utilities to expand Power-to-Ammonia pilot projects, demonstrating ammonia’s role as a scalable energy carrier for seasonal storage and decarbonization of heavy industry.
In December 2025, Plug Power Inc. launched its Power-to-Liquid initiative, converting renewable hydrogen into synthetic fuels for aviation and shipping, strengthening its portfolio in sustainable transport solutions.
Types Covered:
• Power-to-Hydrogen (PtH2)
• Power-to-Ammonia (PtA)
• Power-to-Methanol (PtM)
• Power-to-Synthetic Fuels (e-Fuels)
• Power-to-Gas (PtG)
• Power-to-Chemicals
• Power-to-Heat Solutions
Components Covered:
• Electrolyzers
• Synthesis Reactors
• Carbon Capture Units
• Storage & Distribution Systems
• Control & Automation Systems
• Renewable Power Integration Systems
Applications Covered:
• Energy Storage & Grid Balancing
• Transportation Fuels
• Industrial Feedstock Production
• Maritime & Aviation Fuels
• Seasonal Energy Storage
• Decarbonization of Heavy Industry
End Users Covered:
• Utility Companies
• Oil & Gas Companies
• Chemical Manufacturers
• Steel & Cement Producers
• Aviation & Maritime Operators
• Government & Public Sector
Regions Covered:
• North America
o United States
o Canada
o Mexico
• Europe
o United Kingdom
o Germany
o France
o Italy
o Spain
o Netherlands
o Belgium
o Sweden
o Switzerland
o Poland
o Rest of Europe
• Asia Pacific
o China
o Japan
o India
o South Korea
o Australia
o Indonesia
o Thailand
o Malaysia
o Singapore
o Vietnam
o Rest of Asia Pacific
• South America
o Brazil
o Argentina
o Colombia
o Chile
o Peru
o Rest of South America
• Rest of the World (RoW)
o Middle East
§ Saudi Arabia
§ United Arab Emirates
§ Qatar
§ Israel
§ Rest of Middle East
o Africa
§ South Africa
§ Egypt
§ Morocco
§ Rest of Africa
What our report offers:
- Market share assessments for the regional and country-level segments
- Strategic recommendations for the new entrants
- Covers Market data for the years 2023, 2024, 2025, 2026, 2027, 2028, 2030, 2032 and 2034
- Market Trends (Drivers, Constraints, Opportunities, Threats, Challenges, Investment Opportunities, and recommendations)
- Strategic recommendations in key business segments based on the market estimations
- Competitive landscaping mapping the key common trends
- Company profiling with detailed strategies, financials, and recent developments
- Supply chain trends mapping the latest technological advancements
Free Customization Offerings:
All the customers of this report will be entitled to receive one of the following free customization options:
• Company Profiling
o Comprehensive profiling of additional market players (up to 3)
o SWOT Analysis of key players (up to 3)
• Regional Segmentation
o Market estimations, Forecasts and CAGR of any prominent country as per the client's interest (Note: Depends on feasibility check)
• Competitive Benchmarking
o Benchmarking of key players based on product portfolio, geographical presence, and strategic alliances
Table of Contents
1 Executive Summary
1.1 Market Snapshot and Key Highlights
1.2 Growth Drivers, Challenges, and Opportunities
1.3 Competitive Landscape Overview
1.4 Strategic Insights and Recommendations
2 Research Framework
2.1 Study Objectives and Scope
2.2 Stakeholder Analysis
2.3 Research Assumptions and Limitations
2.4 Research Methodology
2.4.1 Data Collection (Primary and Secondary)
2.4.2 Data Modeling and Estimation Techniques
2.4.3 Data Validation and Triangulation
2.4.4 Analytical and Forecasting Approach
3 Market Dynamics and Trend Analysis
3.1 Market Definition and Structure
3.2 Key Market Drivers
3.3 Market Restraints and Challenges
3.4 Growth Opportunities and Investment Hotspots
3.5 Industry Threats and Risk Assessment
3.6 Technology and Innovation Landscape
3.7 Emerging and High-Growth Markets
3.8 Regulatory and Policy Environment
3.9 Impact of COVID-19 and Recovery Outlook
4 Competitive and Strategic Assessment
4.1 Porter's Five Forces Analysis
4.1.1 Supplier Bargaining Power
4.1.2 Buyer Bargaining Power
4.1.3 Threat of Substitutes
4.1.4 Threat of New Entrants
4.1.5 Competitive Rivalry
4.2 Market Share Analysis of Key Players
4.3 Product Benchmarking and Performance Comparison
5 Global Power-to-X Technology Market, By Type
5.1 Power-to-Hydrogen (PtH2)
5.2 Power-to-Ammonia (PtA)
5.3 Power-to-Methanol (PtM)
5.4 Power-to-Synthetic Fuels (e-Fuels)
5.5 Power-to-Gas (PtG)
5.6 Power-to-Chemicals
5.7 Power-to-Heat Solutions
6 Global Power-to-X Technology Market, By Component
6.1 Electrolyzers
6.1.1 Alkaline Electrolyzers
6.1.2 PEM Electrolyzers
6.1.3 Solid Oxide Electrolyzers
6.2 Synthesis Reactors
6.3 Carbon Capture Units
6.4 Storage & Distribution Systems
6.5 Control & Automation Systems
6.6 Renewable Power Integration Systems
7 Global Power-to-X Technology Market, By Application
7.1 Energy Storage & Grid Balancing
7.2 Transportation Fuels
7.3 Industrial Feedstock Production
7.4 Maritime & Aviation Fuels
7.5 Seasonal Energy Storage
7.6 Decarbonization of Heavy Industry
8 Global Power-to-X Technology Market, By End User
8.1 Utility Companies
8.2 Oil & Gas Companies
8.3 Chemical Manufacturers
8.4 Steel & Cement Producers
8.5 Aviation & Maritime Operators
8.6 Government & Public Sector
9 Global Power-to-X Technology Market, By Geography
9.1 North America
9.1.1 United States
9.1.2 Canada
9.1.3 Mexico
9.2 Europe
9.2.1 United Kingdom
9.2.2 Germany
9.2.3 France
9.2.4 Italy
9.2.5 Spain
9.2.6 Netherlands
9.2.7 Belgium
9.2.8 Sweden
9.2.9 Switzerland
9.2.10 Poland
9.2.11 Rest of Europe
9.3 Asia Pacific
9.3.1 China
9.3.2 Japan
9.3.3 India
9.3.4 South Korea
9.3.5 Australia
9.3.6 Indonesia
9.3.7 Thailand
9.3.8 Malaysia
9.3.9 Singapore
9.3.10 Vietnam
9.3.11 Rest of Asia Pacific
9.4 South America
9.4.1 Brazil
9.4.2 Argentina
9.4.3 Colombia
9.4.4 Chile
9.4.5 Peru
9.4.6 Rest of South America
9.5 Rest of the World (RoW)
9.5.1 Middle East
9.5.1.1 Saudi Arabia
9.5.1.2 United Arab Emirates
9.5.1.3 Qatar
9.5.1.4 Israel
9.5.1.5 Rest of Middle East
9.5.2 Africa
9.5.2.1 South Africa
9.5.2.2 Egypt
9.5.2.3 Morocco
9.5.2.4 Rest of Africa
10 Strategic Market Intelligence
10.1 Industry Value Network and Supply Chain Assessment
10.2 White-Space and Opportunity Mapping
10.3 Product Evolution and Market Life Cycle Analysis
10.4 Channel, Distributor, and Go-to-Market Assessment
11 Industry Developments and Strategic Initiatives
11.1 Mergers and Acquisitions
11.2 Partnerships, Alliances, and Joint Ventures
11.3 New Product Launches and Certifications
11.4 Capacity Expansion and Investments
11.5 Other Strategic Initiatives
12 Company Profiles
12.1 Siemens Energy AG
12.2 Thyssenkrupp AG
12.3 Nel ASA
12.4 ITM Power plc
12.5 Plug Power Inc.
12.6 Air Liquide S.A.
12.7 Linde plc
12.8 Mitsubishi Heavy Industries, Ltd.
12.9 ENGIE SA
12.10 Ørsted A/S
12.11 TotalEnergies SE
12.12 Shell plc
12.13 Equinor ASA
12.14 Haldor Topsoe A/S
12.15 Uniper SE
12.16 Snam S.p.A.
12.17 ABB Ltd.
12.18 Bosch Limited
List of Tables
1 Global Power-to-X Technology Market Outlook, By Region (2023-2034) ($MN)
2 Global Power-to-X Technology Market Outlook, By Type (2023-2034) ($MN)
3 Global Power-to-X Technology Market Outlook, By Power-to-Hydrogen (PtH2) (2023-2034) ($MN)
4 Global Power-to-X Technology Market Outlook, By Power-to-Ammonia (PtA) (2023-2034) ($MN)
5 Global Power-to-X Technology Market Outlook, By Power-to-Methanol (PtM) (2023-2034) ($MN)
6 Global Power-to-X Technology Market Outlook, By Power-to-Synthetic Fuels (e-Fuels) (2023-2034) ($MN)
7 Global Power-to-X Technology Market Outlook, By Power-to-Gas (PtG) (2023-2034) ($MN)
8 Global Power-to-X Technology Market Outlook, By Power-to-Chemicals (2023-2034) ($MN)
9 Global Power-to-X Technology Market Outlook, By Power-to-Heat Solutions (2023-2034) ($MN)
10 Global Power-to-X Technology Market Outlook, By Component (2023-2034) ($MN)
11 Global Power-to-X Technology Market Outlook, By Electrolyzers (2023-2034) ($MN)
12 Global Power-to-X Technology Market Outlook, By Alkaline Electrolyzers (2023-2034) ($MN)
13 Global Power-to-X Technology Market Outlook, By PEM Electrolyzers (2023-2034) ($MN)
14 Global Power-to-X Technology Market Outlook, By Solid Oxide Electrolyzers (2023-2034) ($MN)
15 Global Power-to-X Technology Market Outlook, By Synthesis Reactors (2023-2034) ($MN)
16 Global Power-to-X Technology Market Outlook, By Carbon Capture Units (2023-2034) ($MN)
17 Global Power-to-X Technology Market Outlook, By Storage & Distribution Systems (2023-2034) ($MN)
18 Global Power-to-X Technology Market Outlook, By Control & Automation Systems (2023-2034) ($MN)
19 Global Power-to-X Technology Market Outlook, By Renewable Power Integration Systems (2023-2034) ($MN)
20 Global Power-to-X Technology Market Outlook, By Application (2023-2034) ($MN)
21 Global Power-to-X Technology Market Outlook, By Energy Storage & Grid Balancing (2023-2034) ($MN)
22 Global Power-to-X Technology Market Outlook, By Transportation Fuels (2023-2034) ($MN)
23 Global Power-to-X Technology Market Outlook, By Industrial Feedstock Production (2023-2034) ($MN)
24 Global Power-to-X Technology Market Outlook, By Maritime & Aviation Fuels (2023-2034) ($MN)
25 Global Power-to-X Technology Market Outlook, By Seasonal Energy Storage (2023-2034) ($MN)
26 Global Power-to-X Technology Market Outlook, By Decarbonization of Heavy Industry (2023-2034) ($MN)
27 Global Power-to-X Technology Market Outlook, By End User (2023-2034) ($MN)
28 Global Power-to-X Technology Market Outlook, By Utility Companies (2023-2034) ($MN)
29 Global Power-to-X Technology Market Outlook, By Oil & Gas Companies (2023-2034) ($MN)
30 Global Power-to-X Technology Market Outlook, By Chemical Manufacturers (2023-2034) ($MN)
31 Global Power-to-X Technology Market Outlook, By Steel & Cement Producers (2023-2034) ($MN)
32 Global Power-to-X Technology Market Outlook, By Aviation & Maritime Operators (2023-2034) ($MN)
33 Global Power-to-X Technology Market Outlook, By Government & Public Sector (2023-2034) ($MN)
Note: Tables for North America, Europe, APAC, South America, and Rest of the World (RoW) Regions are also represented in the same manner as above.
List of Figures
RESEARCH METHODOLOGY

We at ‘Stratistics’ opt for an extensive research approach which involves data mining, data validation, and data analysis. The various research sources include in-house repository, secondary research, competitor’s sources, social media research, client internal data, and primary research.
Our team of analysts prefers the most reliable and authenticated data sources in order to perform the comprehensive literature search. With access to most of the authenticated data bases our team highly considers the best mix of information through various sources to obtain extensive and accurate analysis.
Each report takes an average time of a month and a team of 4 industry analysts. The time may vary depending on the scope and data availability of the desired market report. The various parameters used in the market assessment are standardized in order to enhance the data accuracy.
Data Mining
The data is collected from several authenticated, reliable, paid and unpaid sources and is filtered depending on the scope & objective of the research. Our reports repository acts as an added advantage in this procedure. Data gathering from the raw material suppliers, distributors and the manufacturers is performed on a regular basis, this helps in the comprehensive understanding of the products value chain. Apart from the above mentioned sources the data is also collected from the industry consultants to ensure the objective of the study is in the right direction.
Market trends such as technological advancements, regulatory affairs, market dynamics (Drivers, Restraints, Opportunities and Challenges) are obtained from scientific journals, market related national & international associations and organizations.
Data Analysis
From the data that is collected depending on the scope & objective of the research the data is subjected for the analysis. The critical steps that we follow for the data analysis include:
- Product Lifecycle Analysis
- Competitor analysis
- Risk analysis
- Porters Analysis
- PESTEL Analysis
- SWOT Analysis
The data engineering is performed by the core industry experts considering both the Marketing Mix Modeling and the Demand Forecasting. The marketing mix modeling makes use of multiple-regression techniques to predict the optimal mix of marketing variables. Regression factor is based on a number of variables and how they relate to an outcome such as sales or profits.
Data Validation
The data validation is performed by the exhaustive primary research from the expert interviews. This includes telephonic interviews, focus groups, face to face interviews, and questionnaires to validate our research from all aspects. The industry experts we approach come from the leading firms, involved in the supply chain ranging from the suppliers, distributors to the manufacturers and consumers so as to ensure an unbiased analysis.
We are in touch with more than 15,000 industry experts with the right mix of consultants, CEO's, presidents, vice presidents, managers, experts from both supply side and demand side, executives and so on.
The data validation involves the primary research from the industry experts belonging to:
- Leading Companies
- Suppliers & Distributors
- Manufacturers
- Consumers
- Industry/Strategic Consultants
Apart from the data validation the primary research also helps in performing the fill gap research, i.e. providing solutions for the unmet needs of the research which helps in enhancing the reports quality.
For more details about research methodology, kindly write to us at info@strategymrc.com
Frequently Asked Questions
In case of any queries regarding this report, you can contact the customer service by filing the “Inquiry Before Buy” form available on the right hand side. You may also contact us through email: info@strategymrc.com or phone: +1-301-202-5929
Yes, the samples are available for all the published reports. You can request them by filling the “Request Sample” option available in this page.
Yes, you can request a sample with your specific requirements. All the customized samples will be provided as per the requirement with the real data masked.
All our reports are available in Digital PDF format. In case if you require them in any other formats, such as PPT, Excel etc you can submit a request through “Inquiry Before Buy” form available on the right hand side. You may also contact us through email: info@strategymrc.com or phone: +1-301-202-5929
We offer a free 15% customization with every purchase. This requirement can be fulfilled for both pre and post sale. You may send your customization requirements through email at info@strategymrc.com or call us on +1-301-202-5929.
We have 3 different licensing options available in electronic format.
- Single User Licence: Allows one person, typically the buyer, to have access to the ordered product. The ordered product cannot be distributed to anyone else.
- 2-5 User Licence: Allows the ordered product to be shared among a maximum of 5 people within your organisation.
- Corporate License: Allows the product to be shared among all employees of your organisation regardless of their geographical location.
All our reports are typically be emailed to you as an attachment.
To order any available report you need to register on our website. The payment can be made either through CCAvenue or PayPal payments gateways which accept all international cards.
We extend our support to 6 months post sale. A post sale customization is also provided to cover your unmet needs in the report.
Request Customization
We offer complimentary customization of up to 15% with every purchase. To share your customization requirements, feel free to email us at info@strategymrc.com or call us on +1-301-202-5929. .
Please Note: Customization within the 15% threshold is entirely free of charge. If your request exceeds this limit, we will conduct a feasibility assessment. Following that, a detailed quote and timeline will be provided.
WHY CHOOSE US ?

Assured Quality
Best in class reports with high standard of research integrity

24X7 Research Support
Continuous support to ensure the best customer experience.

Free Customization
Adding more values to your product of interest.

Safe & Secure Access
Providing a secured environment for all online transactions.

Trusted by 600+ Brands
Serving the most reputed brands across the world.